
Charts: Trading View
(Italics: Previous Analysis)
US Dollar Index (Daily Timeframe):
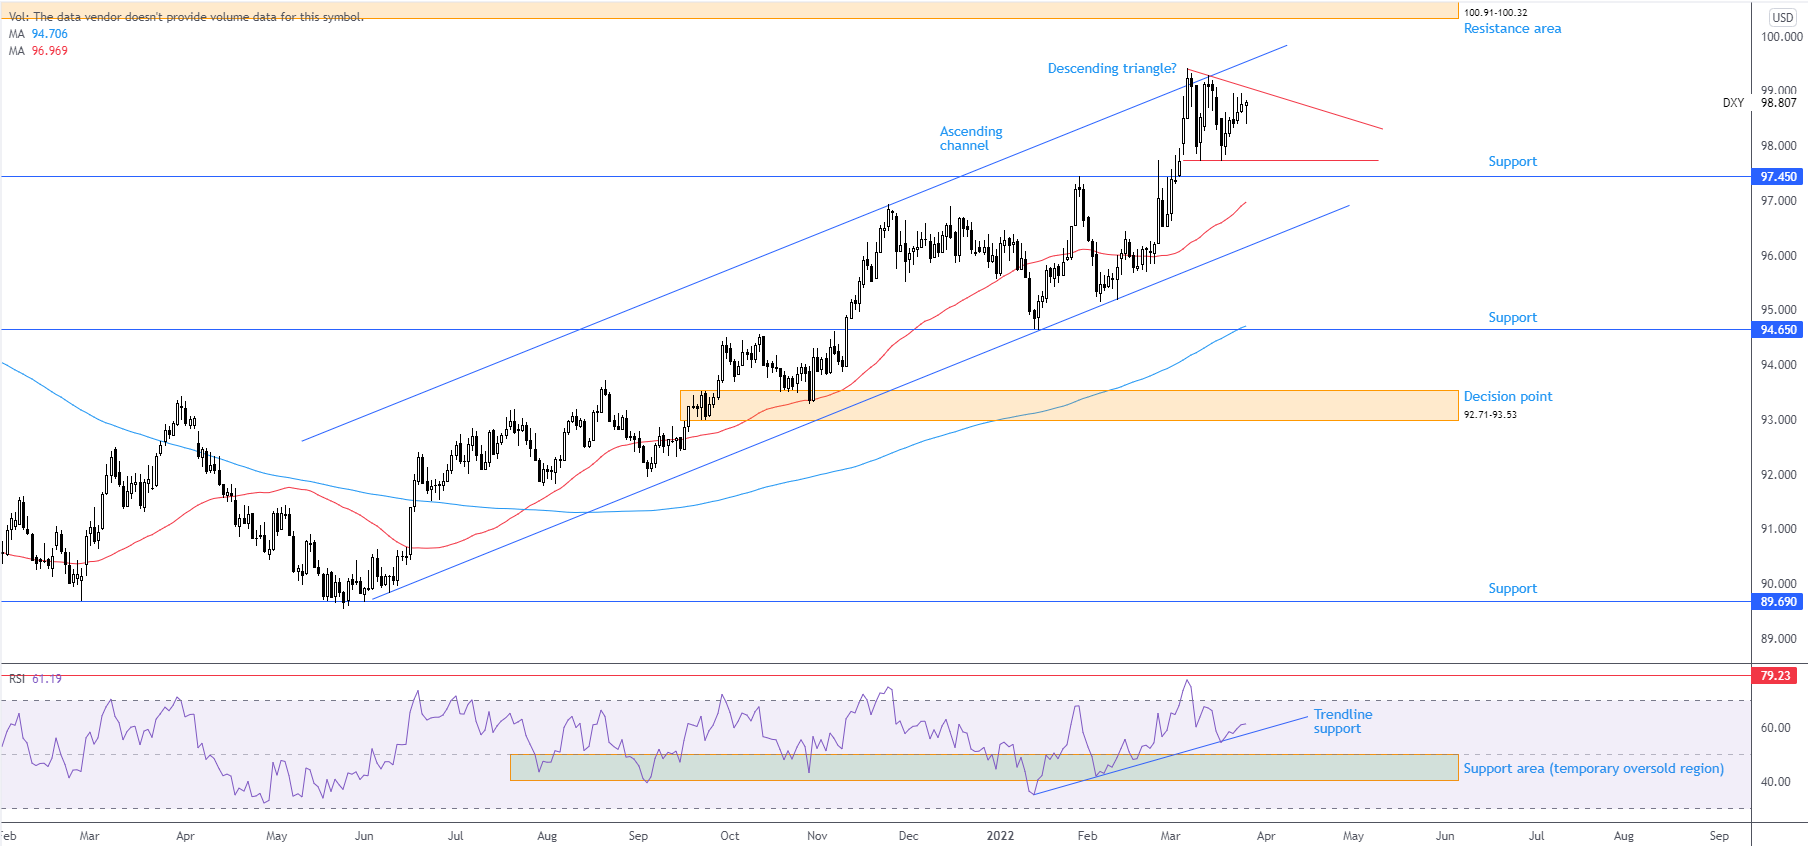
Dollar bulls, according to the US Dollar Index (USDX), regained consciousness last week, adding 0.6 percent and reclaiming a large slice of the prior week’s near-1 percent drop. Since 7th March, buyers and sellers have been squaring off within the limits of a descending triangle, extended from 99.42 and 97.71. Although descending triangles are commonly viewed as continuation patterns within a downtrend, instances of descending triangles providing bearish reversal structure are evident which is what’s ‘potentially’ brewing right now.
Channel resistance, taken from the high 96.94, continues to cap upside and reinforces the upper boundary of the aforementioned descending triangle. Therefore, this emphasises the possibility of a USD breakdown. Support at 97.45 remains unchallenged just south of the triangle, with the 50-day simple moving average at 96.97 on course to join the support. Outperformance this week, nonetheless, would shine light on resistance at 100.91-100.32. Technical elements also show the 50-day simple moving average crossed above the 200-day simple moving average in July 2021, currently trading around 94.71. Technicians often label this as a ‘Golden Cross’, implying a longer-term uptrend could be on the table.
In terms of where we stand regarding trend direction, the USDX exhibits well-defined upward movement. Since price made contact with support from 89.69 in May 2021, the unit has shaped a series of higher highs and higher lows. The weekly timeframe, on the other hand, has displayed a long-term range since 2015, fluctuating between 103.82 and 88.25. Yet, this consolidation followed dominant bullish action since May 2011 (72.70). For that reason, the primary trend is considered north with the secondary trend (daily timeframe) demonstrating a clear bullish narrative.
Momentum studies, based on the relative strength index (RSI), shows the indicator entertained a rebound from trendline support in recent trading, taken from the low 36.35. This, of course, bolsters a bullish setting. Be that as it may, indicator support between 40.00 and 50.00 (a temporary oversold region since August 2021—common view in uptrends) is an area also likely to call for attention this week, plotted under the trendline.
Technical Outlook:
Focus is on the descending triangle; a breakout beyond this pattern helps estimate future dollar movement. Resistance at 100.91-100.32 and support from 97.45 are areas of note outside of the pattern.
 EUR/USD:
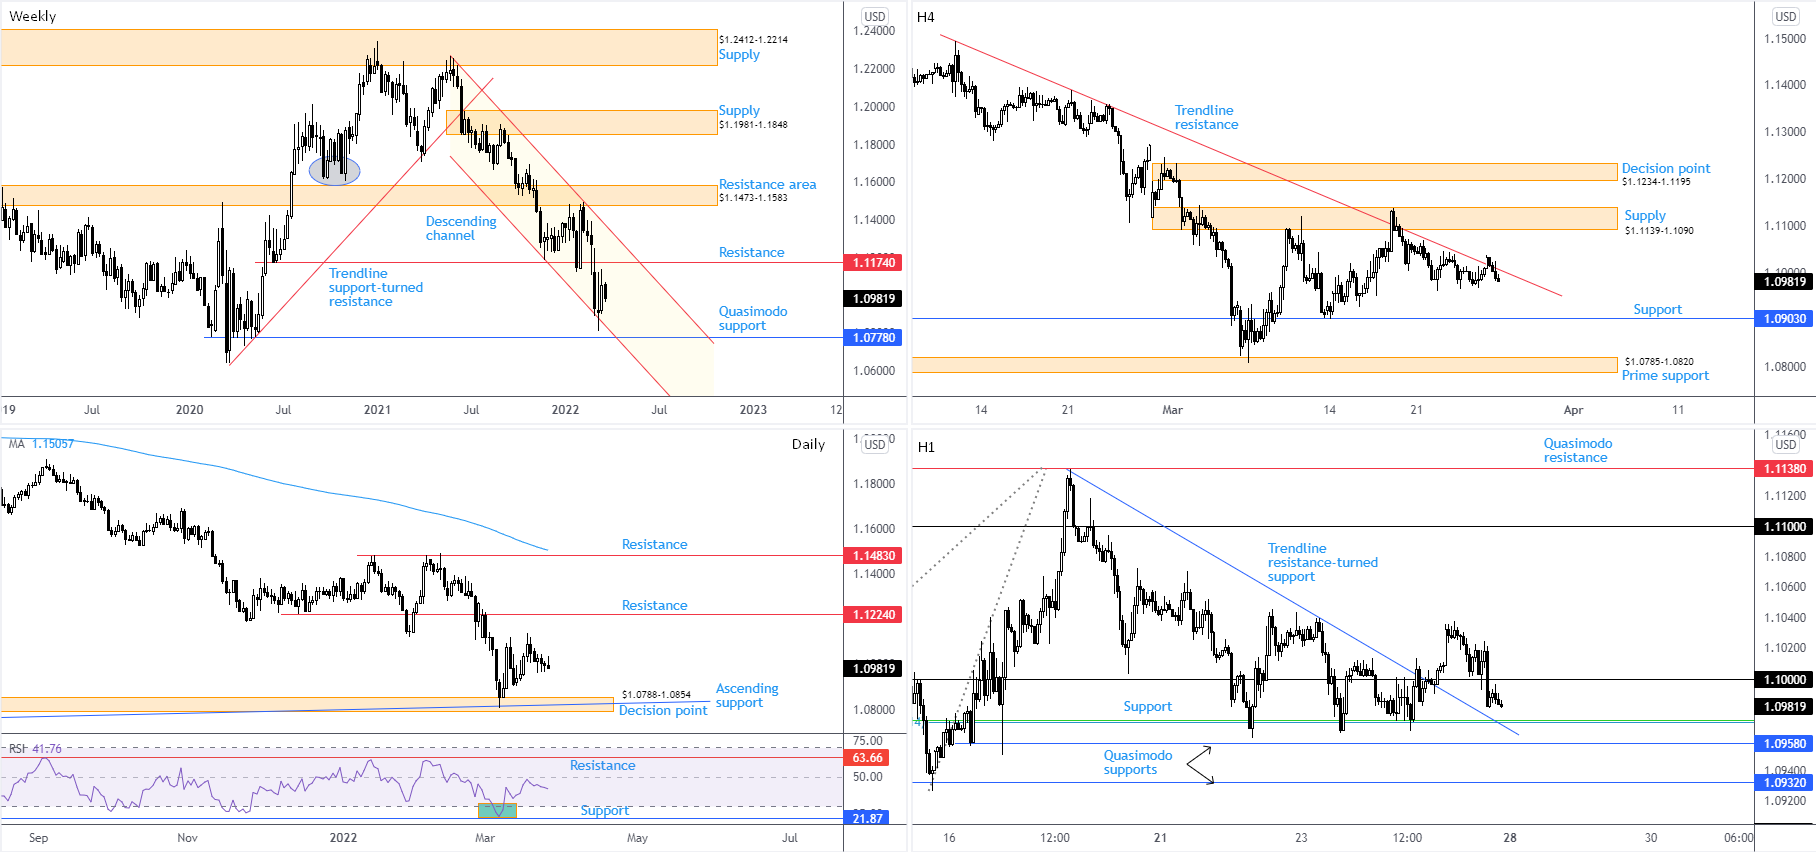
EUR/USD bulls failed to build off the prior week’s 1.3 percent rally last week, finishing lower by 0.6 percent. Longer-term, the trend remains averse to upside movement, reflecting bearish status since topping at $1.2350 at the beginning of January (2021). This is reinforced by a weekly trendline support breach, drawn from the low $1.0636, together with the break of the $1.1602 November 2020 low (circled) and the pair refreshing year-to-date lows at $1.0806 in early March. Weekly resistance continues to call for attention at $1.1174, strategically positioned within the current downtrend. Weekly channel support, extended from the low $1.1186 (arranged north of weekly Quasimodo support at $1.0778), remains a technical ‘floor’ for the time being.
Sharing chart space with weekly channel support, the daily timeframe shows movement shook hands with the $1.0788-1.0854 decision point (as well as an intersecting ascending support, drawn from the $1.0340 3rd January low 2017) in early March. Closely joining weekly resistance at $1.1174 is daily resistance at $1.1224. Territory north of the level unearths area to daily resistance at $1.1483 (located nearby the 200-day simple moving average at $1.1506—price has traded south of here since mid-June). An additional study on the daily scale reveals the relative strength index (RSI) turned ahead of the 50.00 centreline. Maintaining position under the latter informs market participants average losses outweigh average gains (negative momentum).
Across the page, the technical landscape on the H4 timeframe shows the unit respected trendline resistance (drawn from the high $1.1495) in mid-March, a descending line intersecting with the $1.1139-1.1090 supply at the time. Interestingly, the trendline also held back buyers on Friday. Scope to press as far south as support coming in at $1.0903 remains on the table for this chart. A break of 22nd March low from $1.0961 is action traders are likely to eye this week to ‘confirm’ a bearish presence on the latest test of trendline resistance.
H1 support around $1.0972, made up of a 78.6% Fibonacci retracement ratio and a 50.00% level, has proved a stubborn base, withstanding three downside attempts last week. Despite this, buyers have been unable to find agreement north of $1.10. Friday, as you can see, dropped back under the psychological level for a fourth time last week, eyeballing $1.0972 once again. What gives this support extra credibility is trendline resistance-turned support, taken from the high $1.1137, and neighbouring Quasimodo support priced from $1.0958 (below calls for Quasimodo support at $1.0932, followed by $1.09).
Technical Outlook:
Medium term:
On account of current trend direction (lower), weekly and daily resistances between $1.1174-1.1224 might welcome active sellers should the ‘zone’ make a show this week. Then again, it’s important to remain cognisant of the prospect of continuation moves lower from current price, targeting the daily decision point from $1.0788-1.0854.
Short-term:
H1 Quasimodo support at $1.0958, together with H1 support at $1.0972 and H1 trendline support, delivers a short-term ‘floor’ to be mindful of early week.
A crucial technical caveat to bear in mind, though, is the H4 timeframe rejecting trendline resistance and displaying room to navigate lower prices until $1.0903 support. For that reason, traders are also urged to prepare for a $1.0958 breach and continuation to $1.0932 and $1.09ish on the H1.
AUD/USD:
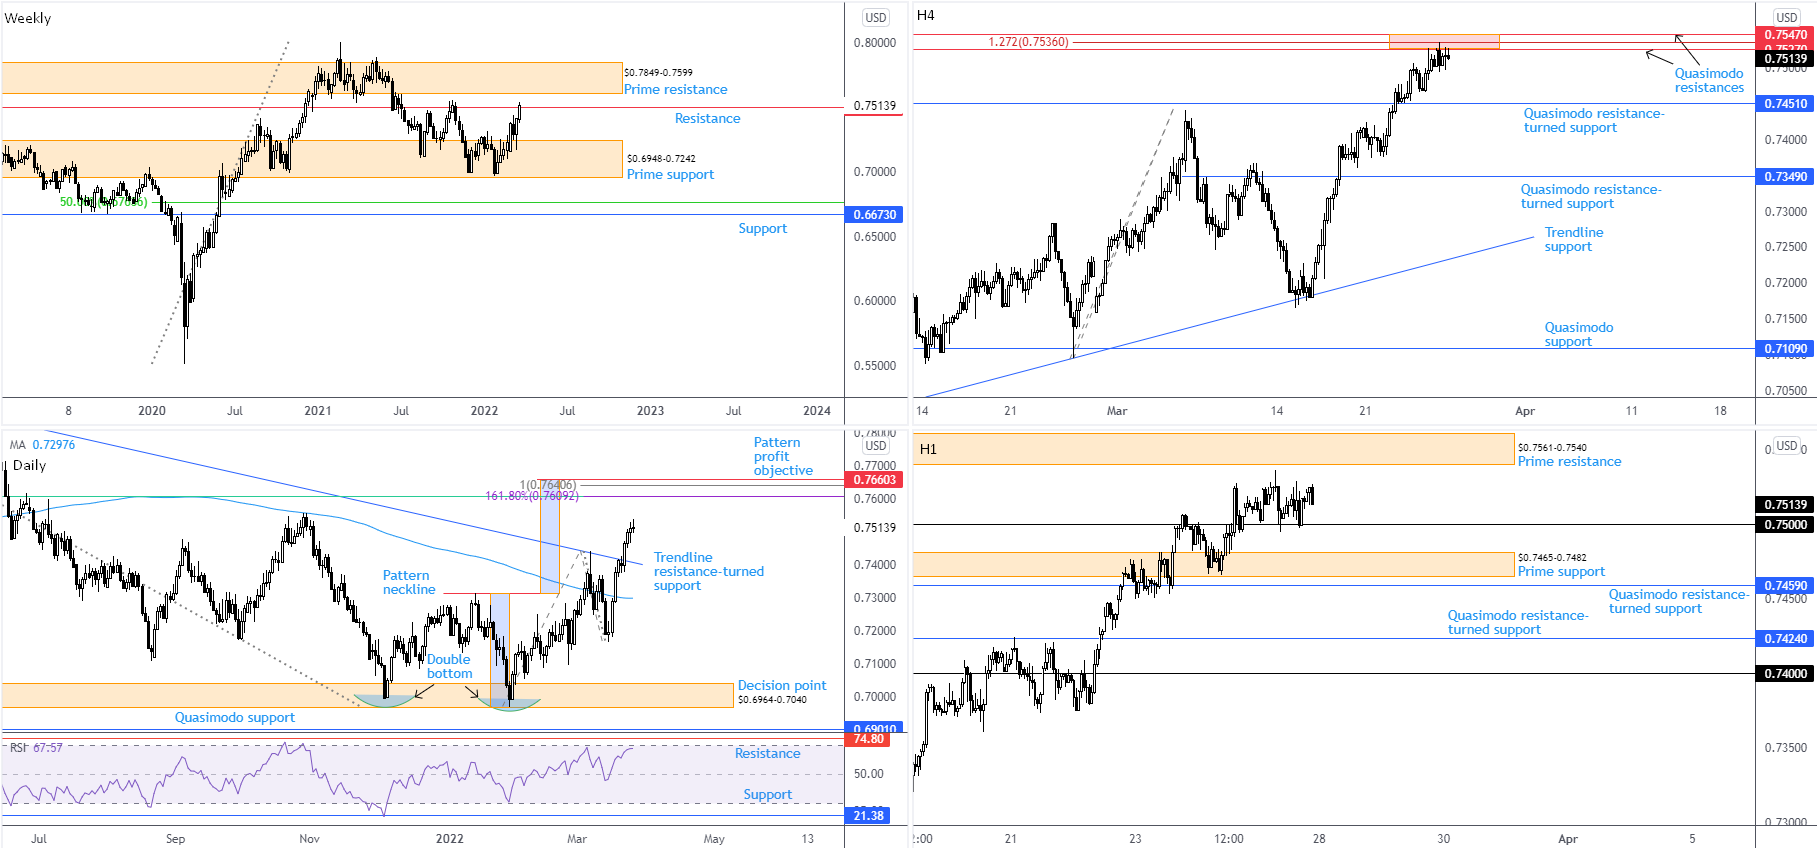
Extending recovery gains last week, AUD/USD added 1.4 percent and occupied weekly resistance coming in from $0.7501. This followed the prior week’s decisive bid from weekly prime support at $0.6948-0.7242. As a result of recent movement, weekly prime resistance at $0.7849-0.7599 also warrants focus this week.
While the surge higher may excite traders and investors, the trend, according to overall chart studies, suggests that surpassing the noted resistance levels on the weekly scale may be problematic. Longer term, the monthly timeframe has portrayed a downtrend since August 2011, signifying the 12.9 percent correction from mid-Feb tops at $0.8007 (2021) on the weekly timeframe might be the start of a bearish phase and not a dip-buying opportunity within the 2021 advance from pandemic lows of $0.5506. A bearish scene from $0.7051 resistance or prime resistance at $0.7849-0.7599, therefore, could develop. If a $0.6948-0.7242 break lower should come to pass, weekly support at $0.6673 and a 50% retracement at $0.6764 are observable.
Meanwhile on the daily timeframe, early trading last week pencilled in a trendline resistance breach (drawn from the high $0.8007). Communicating a bullish signal, the possibility of a continuation run towards $0.7660 is in the offing. As you can see, the double-bottom pattern ($0.6991) had its neckline taken ($0.7314) in early March and drew attention to its profit objective at $0.7660 (connects closely with Fibonacci resistance between $0.7641 and $0.7609). However, recognising the weekly space connecting with resistance (see above), upside momentum lacked energy in the second half of the week, consequently establishing upper shadows. According to the relative strength index (RSI), despite a rebound from the 50.00 centreline, the indicator has yet to engulf the 68.24 high formed on 4th March. So, bearish divergence might eventually emerge. Should we invade overbought territory, nevertheless, indicator resistance from 74.80 is of particular importance.
According to H4 space, the currency pair crossed swords with an area of resistance between $0.7547 and $0.7527 (composed of two Quasimodo resistances and a 1.272% Fibonacci expansion) on Thursday. Sellers, at the time of writing, appear unwilling to commit to pull things towards Quasimodo resistance-turned support coming in at $0.7451. Still, it’s important that traders do not overlook this area as the base dovetails closely with weekly resistance mentioned above at $0.7501.
H1 prime support resides beneath $0.75 at $0.7465-0.7482. As evident from the H1 timeframe, the unit spent Friday’s session respecting $0.75 as support, threatening to join hands with neighbouring prime resistance at $0.7561-0.7540.
Technical Outlook:
Medium term:
The area between the lower limit of weekly prime resistance at $0.7849-0.7599 and weekly resistance at $0.7501 is a space likely to be watched closely this week, as the trend places this zone in favourable light for sellers.
Daily flow exhibits scope to approach Fibonacci resistance between $0.7641 and $0.7609 (as well as the double-top profit objective at $0.7660) which informs technicians that the lower area of weekly prime resistance at $0.7849-0.7599 is a more realistic resistance for sellers this week.
Short term:
Prime support located on the H1 timeframe at $0.7465-0.7482 is strategically positioned beneath $0.75 to perhaps facilitate a whipsaw scenario early week (stop-run under $0.75). Should this come to fruition, further buying could overwhelm bearish interest from H1 prime resistance at $0.7561-0.7540 to target $0.76. Note that this is in conjunction with daily structure also suggesting a pop to the $0.76ish region.
USD/JPY:
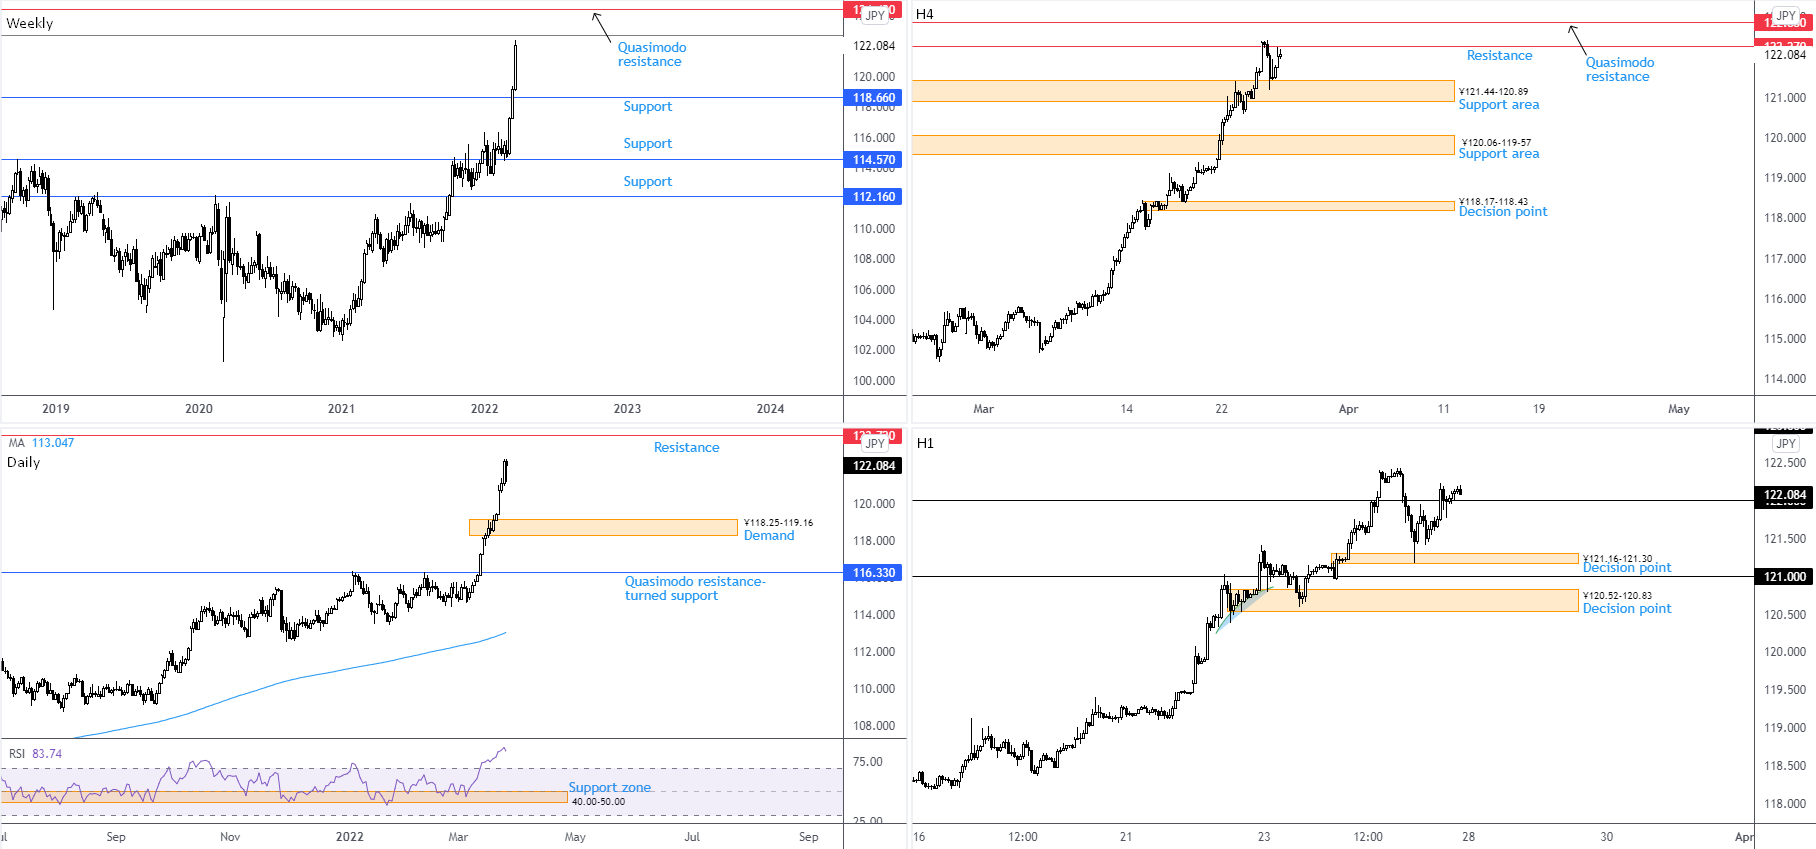
USD/JPY has been on a tear of late, observing three near-full-bodied bullish candles. Last week settled higher by 2.5 percent—MTD we are a healthy 6.2 percent higher. Overhead resistances on the weekly timeframe this week are a deep 88.6% Fibonacci retracement at ¥122.76 and Quasimodo resistance at ¥124.42. In terms of weekly support, ¥118.66 is visible. Although ¥124.42-122.76 offer resistance, trend studies communicate a bullish vibe. The overall longer-term trend has been higher since 2012 (check monthly timeframe). The 21.5 percent correction from June 2015 to June 2016 provided a dip-buying opportunity, as did a subsequent 14.8 percent correction from December 2016 to pandemic lows formed early March 2020. Adding to this, we also broke the ¥118.66 December 2016 high in mid-March.
Daily movement reveals the currency pair eked out a modest loss on Friday (-0.20 percent), snapping a five-day bullish phase. In line with the weekly timeframe, daily price is seen zeroing in on resistance coming in at ¥123.72 (centred between weekly resistances at ¥124.42 and ¥122.76). Demand warrants attention to the downside at ¥118.25-119.16 should sellers make a show this week. An additional technical note is the relative strength index (RSI) marginally peaking around 87.00, a level not seen since 2014. Although a considerably high RSI value, with the likelihood of upside momentum levelling off at this point, traders are urged to exercise caution as amidst trending environments the RSI can remain within overbought space for prolonged periods and initiate a number of false bearish signals.
Short-term activity on the H4 timeframe shows Thursday’s bullish efforts were derailed by resistance at ¥122.27. Calling above throws light on Quasimodo resistance at ¥122.88 (blending closely with weekly resistance at ¥122.76), while dipping lower has a support area at ¥121.44-120.89 to target, which happened to welcome buyers early Friday. Tunnelling lower from current levels exposes fresh support at ¥120.06-119-57.
Out of the H1 timeframe, price rebounded from a clear ¥121.16-121.30 decision point in early trade Friday, with US hours climbing above ¥122 and subsequently retesting the latter to form moderate support into the close. In the event buyers defend ¥121 support, Thursday’s high from ¥122.43 is seen as possible resistance, followed by ¥123.
Technical Outlook:
Medium term:
Based on weekly and daily charts, additional upside in this market is possible, in line with the current trend. A potential headwind on the bigger picture to be aware of falls in between the weekly timeframe’s 88.6% Fibonacci retracement at ¥122.76 and weekly Quasimodo resistance from ¥124.42.
Short term:
Recognising the higher timeframes demonstrate space to move north until reaching resistance around ¥122.76, and the H1 timeframe retesting ¥122 as support on Friday, this could lead short-term action higher to ¥122.76 and H4 Quasimodo resistance at ¥122.88. If ¥122 does indeed deliver H1 support, H4 resistance from ¥122.27 is in a vulnerable setting.
GBP/USD:
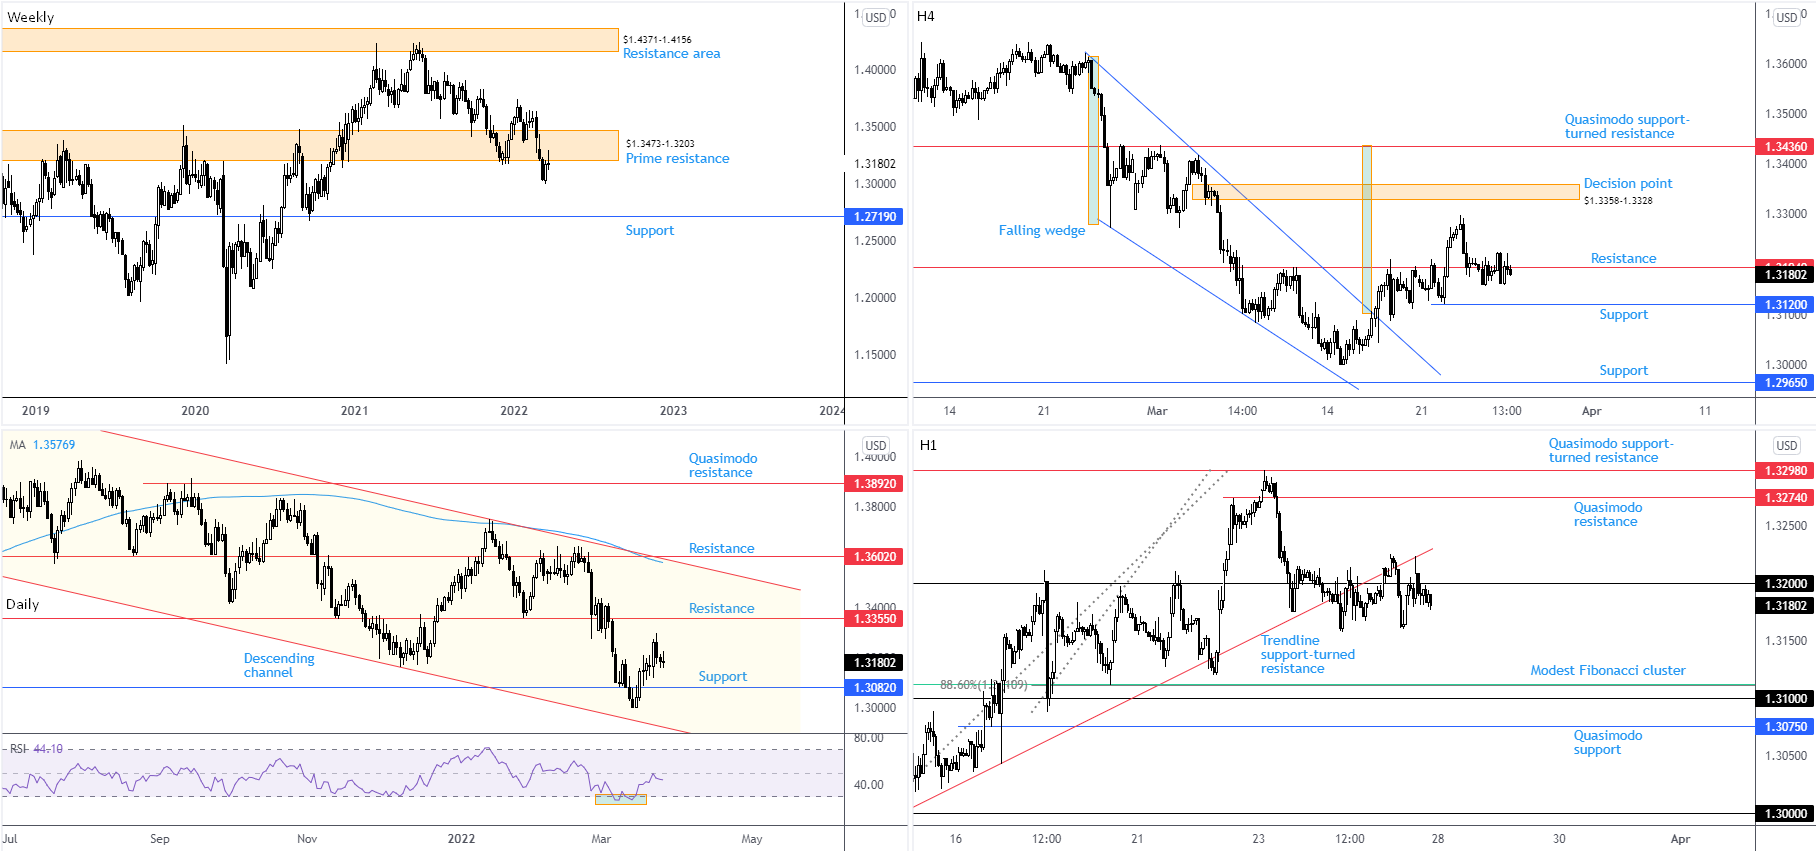
Buyers and sellers settled on neutral ground last week, ranging between $1.3298 and $1.3120.
Buying remains questionable on GBP/USD. Not only is the trend to likely weigh on upside efforts, prime resistance is a focal point on the weekly timeframe at $1.3473-1.3203 with the chart demonstrating scope to drop as far south as weekly support from $1.2719. Trend direction has been southbound since late 2007 tops at $2.1161. As a result, the 25 percent move from pandemic lows in March 2020 to February 2021 might be viewed as a pullback within the larger downtrend. This, of course, places a question mark on the 8.5 percent ‘correction’ from February 2021 to March 2022, suggesting the possibility of continuation selling.
Based on daily analysis, nevertheless, GBP/USD continues to work with space north of a recently engulfed resistance from $1.3082. Should the latter pencil in support, this builds a foundation to test resistance at $1.3355. Unsupportive of follow-through buying, of course, is the relative strength index (RSI), seen modestly levelling off ahead of the key 50.00 centreline. For any longer-term trend followers watching the longer-dated moving averages, you will also note the currency pair continues to operate south of the 200-day simple moving average at $1.3577—a (technical) bearish view.
Moving to the H4 timeframe, technicians will acknowledge support was taken at $1.3194 and subsequently retested as resistance. Should sellers remain in the driving seat and overthrow support from $1.3120 this week, downside appears clear until support from $1.2965.
From the H1 timeframe, Friday’s action retested the lower side of $1.32 and trendline support-turned resistance, extended from the low $1.3000. South of here, a modest Fibonacci cluster inhabits the $1.3111ish region, followed by $1.31 and a Quasimodo support from $1.3075.
Technical Outlook:
Medium term:
Given weekly prime resistance at $1.3473-1.3203 receiving price action, in addition to trend direction facing southbound, upside efforts on the daily timeframe north of support at $1.3082 are likely to be fragile. Therefore, chart studies indicate a test of $1.3082 and possible clearance of the level.
Short term:
H4 resistance in play around $1.3194 and H1 defending the lower side of $1.32 implies H1 sellers may take aim at H4 support from $1.3120 this week, shadowed by H1 Fibonacci (cluster) support at $1.3111 and the $1.31 figure.
DISCLAIMER:
The information contained in this material is intended for general advice only. It does not take into account your investment objectives, financial situation or particular needs. FP Markets has made every effort to ensure the accuracy of the information as at the date of publication. FP Markets does not give any warranty or representation as to the material. Examples included in this material are for illustrative purposes only. To the extent permitted by law, FP Markets and its employees shall not be liable for any loss or damage arising in any way (including by way of negligence) from or in connection with any information provided in or omitted from this material. Features of the FP Markets products including applicable fees and charges are outlined in the Product Disclosure Statements available from FP Markets website, www.fpmarkets.com and should be considered before deciding to deal in those products. Derivatives can be risky; losses can exceed your initial payment. FP Markets recommends that you seek independent advice. First Prudential Markets Pty Ltd trading as FP Markets ABN 16 112 600 281, Australian Financial Services License Number 286354.


 Access +10,000 financial
instruments
Access +10,000 financial
instruments