
Charts: Trading View
(Italics: Previous Analysis)
US Dollar Index (Daily Timeframe):
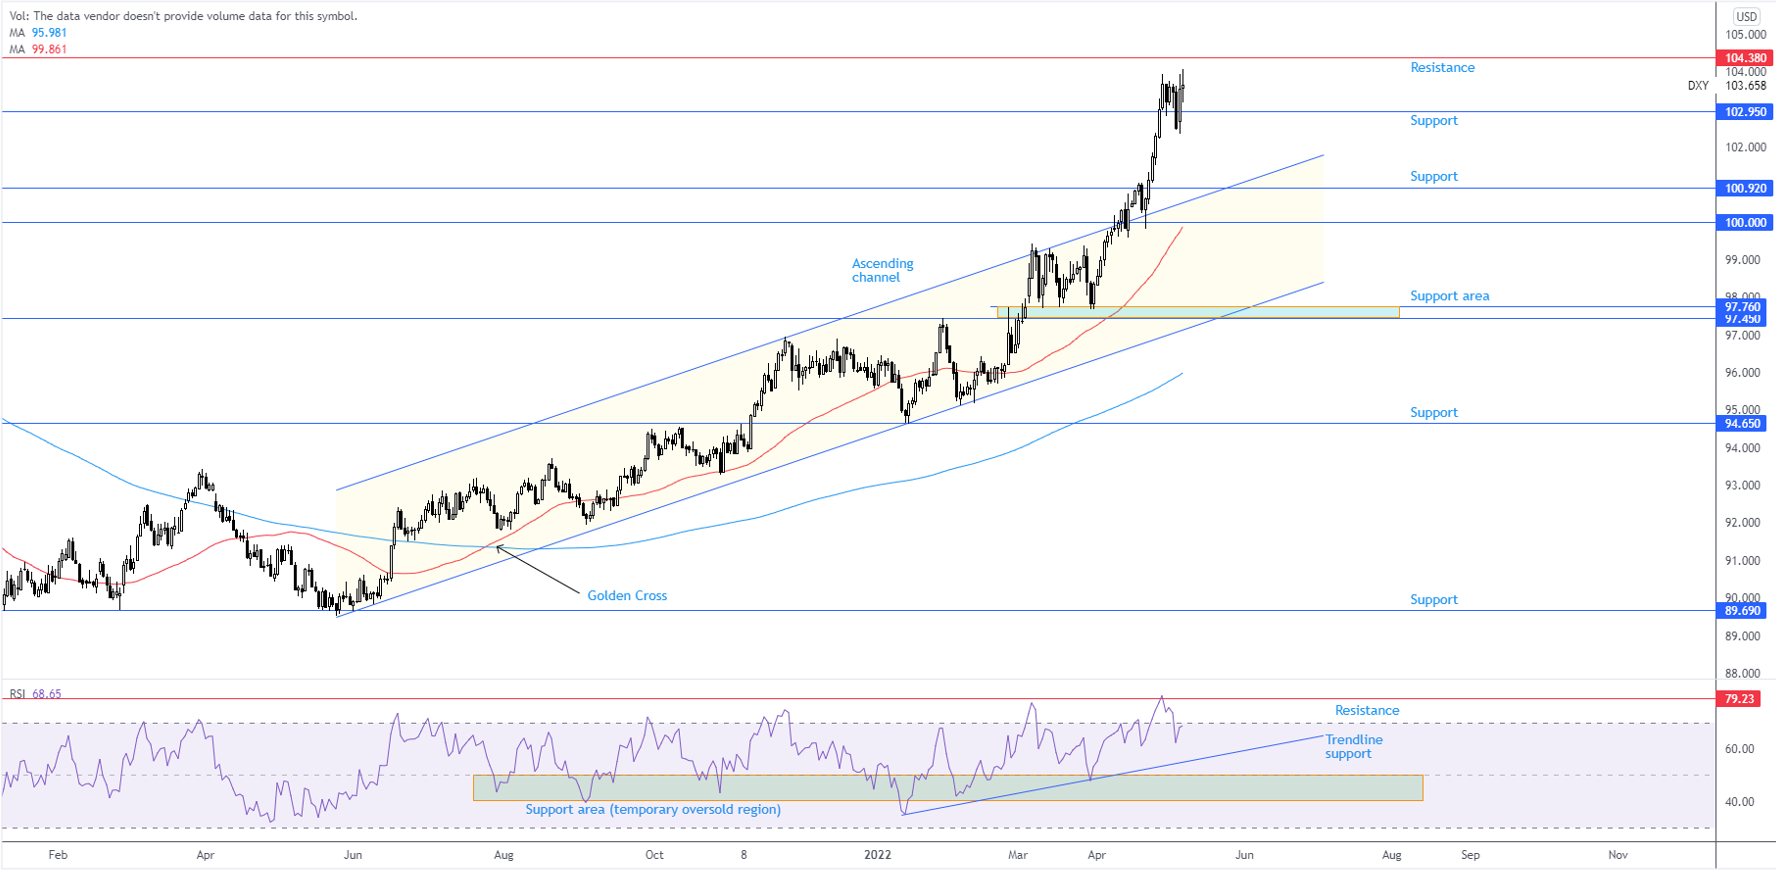
Upside momentum faded considerably in the first full week of May, in spite of eking out a modest 0.4 per cent gain as well as unearthing a fifth consecutive week in positive territory and refreshing multi-year pinnacles. Through the relative strength index (RSI), we can see the popular momentum gauge on the weekly timeframe continues to roam within overbought space, touching levels not seen since March 2015. The daily timeframe’s RSI value also shook hands with indicator resistance at 79.23 in late April and subsequently departed overbought territory. Both readings are viewed as symptoms of decelerating momentum. Should the daily indicator dip lower, focus shifts to trendline support, extended from the low 35.04, and support between 40.00-50.00: a ‘temporary’ oversold region since August 2021.
Structurally, however, resistance-turned support from 102.95 remained resilient, serving as a floor during the week. Should buyers extend their position from the aforementioned level, resistance from 104.38 warrants consideration (a level boasting strong historical significance). A bearish showing, on the other hand, redirects the radar to support coming in at 100.92, a base complemented by channel resistance-turned support, drawn from the high 96.94.
Trend studies remain unchanged as we head into a fresh week of trading. Direction has exhibited well-defined upward movement since price made contact with support from 89.69 in May 2021, which may help reinforce 102.95 support. The upside bias is also shown through the 50-day simple moving average crossing above the 200-day simple moving average in August 2021 (‘Golden Cross’).
Technical Outlook:
In light of slowing momentum, traders and investors are likely to adopt a cautious stance this week. Current buyers will want to observe a firm defence from support at 102.95 before pyramiding positions. If the aforementioned support gives way—communicated as a possibility by the RSI—a short-term bearish showing could emerge to 100.92 and channel support, both of which serve as a location fresh dip buyers may be drawn to.
EUR/USD:
Year to date, Europe’s shared currency is nursing losses of 7 per cent against its US counterpart. April plunged 4.8 percent, with last week closing unchanged. Suffice it to say, this has not been a welcoming market for buyers this year so far.
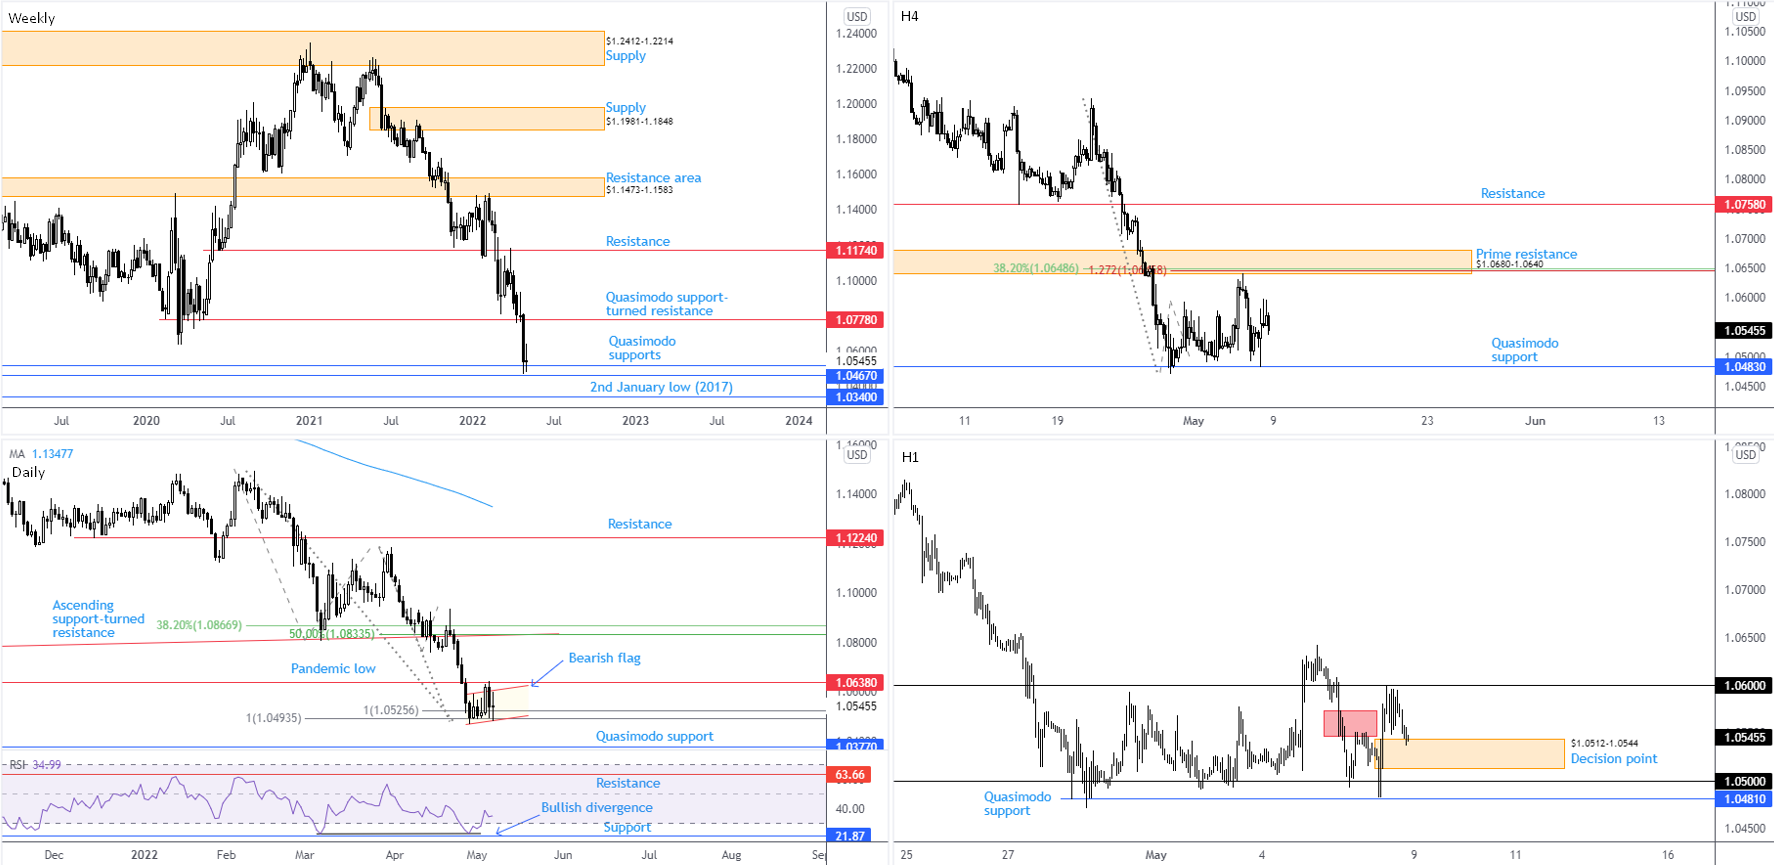
Quasimodo supports between $1.0467 and $1.0517 warrant attention on the weekly timeframe, following the end-of-month (April) 2.4 per cent decline. However, the noted levels have offered little to persuade buyers to commit. One factor likely discouraging any meaningful buying is the current downtrend, dominant since the beginning of 2021. Adding to this, seen clearly from the monthly timeframe, the overall vibe has been to the downside since topping in April 2008. Territory beneath current weekly supports calls attention towards the $1.0340 2nd January low (2017).
Aiding the bearish setting is price action on the daily timeframe retesting the lower side of the pandemic low of $1.0638 (March 2020) which established resistance on Thursday. Consequent to this, the currency pair revisited two 100% Fibonacci projections between $1.0494 and $1.0526. Between the noted support and resistances, therefore, is the battlefield we’re presented with this week, shaped by way of a bearish flag ($1.0471/$1.0593). Despite sellers having the edge (on the basis of the downtrend) which could lead the currency pair to Quasimodo support at $1.0377, traders are urged to acknowledge resistance north of current resistance in the event of upside movement: an ascending resistance, drawn from a low of $1.0340, as well as a 50.0% retracement at $1.0834 and a 38.2% Fibonacci retracement at $1.0867. In terms of the relative strength index (RSI), the indicator’s value exited oversold territory, following a near-test of support at 21.87 late April. Interestingly, traders may acknowledge early regular bullish divergence forming; a bullish failure swing would likely be a welcomed formation to help confirm the divergence.
Price action on the H4 timeframe is seen interacting with prime resistance from $1.0680-1.0640 (an area accompanied by a 38.2% Fibonacci retracement at $1.0649 and a 1.272% Fibonacci projection at $1.0646) and Quasimodo support stationed at $1.0483. Short term, a freshly moulded decision point decorated the H1 chart on Friday at $1.0512-1.0544 (fixed north of $1.05 and Quasimodo support from $1.0481). $1.0512-1.0544 is an area that formed prior to attacking another decision point area (red) that permitted the unit to approach $1.06.
Technical Outlook:
Medium term:
Weekly Quasimodo supports between $1.0467 and $1.0517 will, once again, remain a talking point this week, as will the daily timeframe’s 100% Fibonacci projections at $1.0494 and $1.0526, together with the pandemic low (resistance) at $1.0638. Overall, though, this market is rooted within a decisive downtrend and, consequently, may influence bullish movement from the noted supports and encourage price to print a breakout below the daily timeframe’s bearish flag which, by extension, could exacerbate downside pressure to daily Quasimodo support from $1.0377.
Short term:
Between the lower side of H4 prime resistance at $1.0640 and the $1.06 figure on the H1 scale is likely a watched area early this week for sellers. Note that supporting the upper side of the noted area is the pandemic low (resistance) at $1.0638.
The H1 decision point at $1.0512-1.0544 is also a key zone, though given the bearish vibe this market offers right now it’s unlikely that a sizeable reaction materialises here. For that reason, short-term action might see price attempt to move beyond $1.05 early week.
AUD/USD:
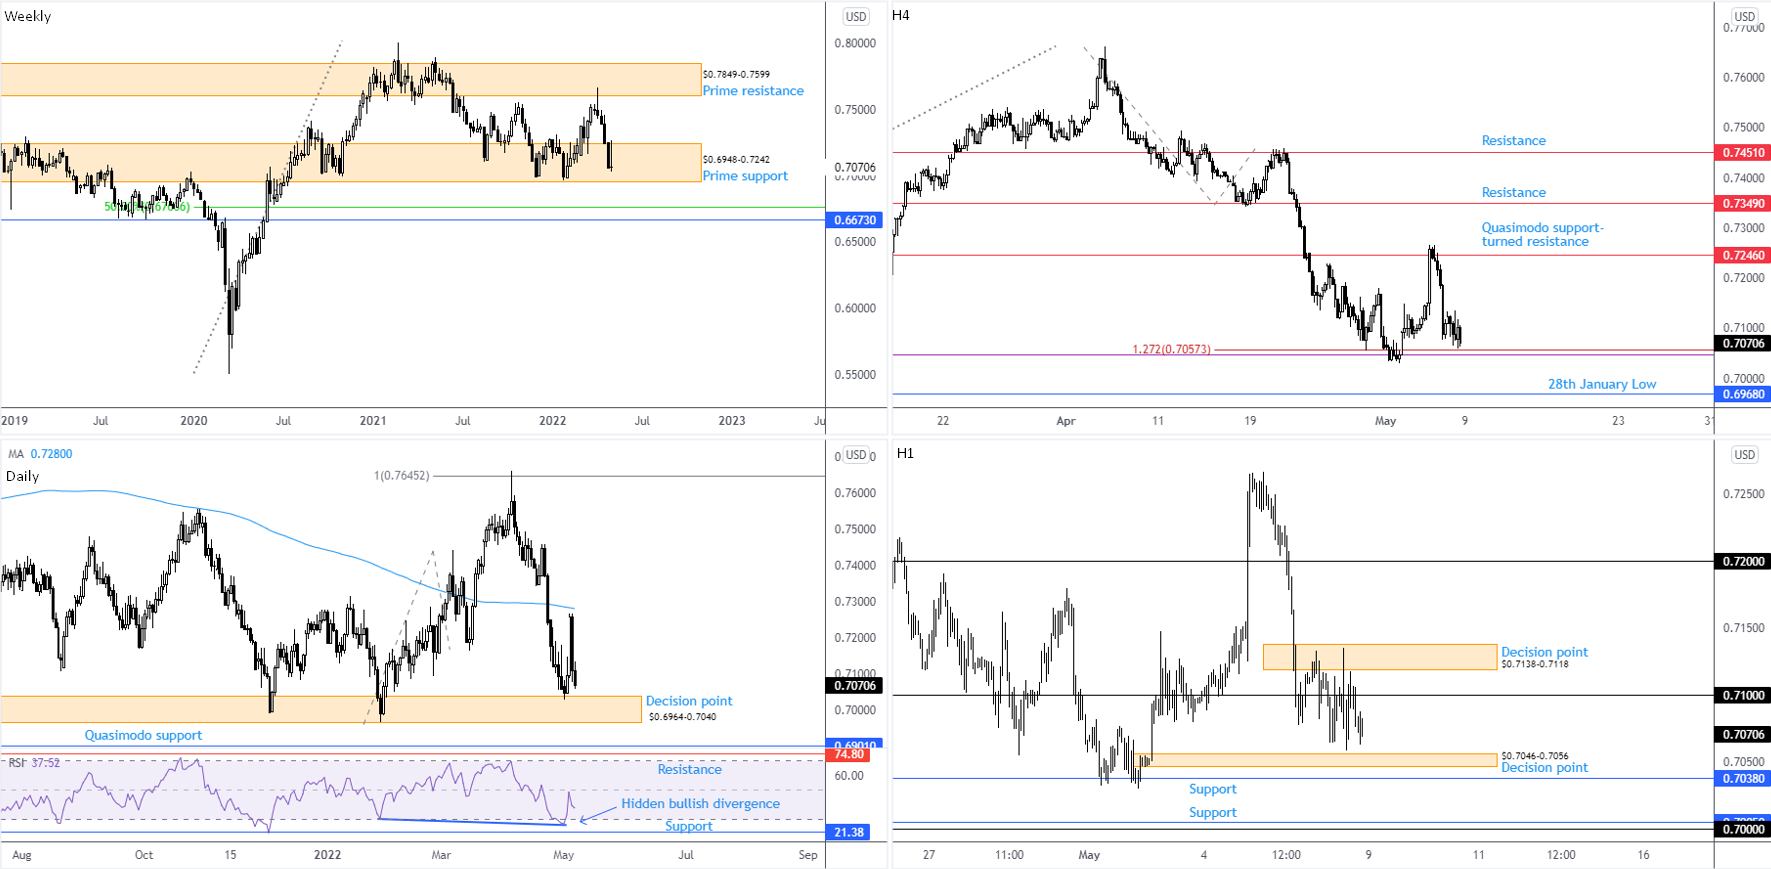
Wrapping up off best levels, the week ended at session lows. This follows April’s mammoth 5.7 per cent tumble from prime resistance at $0.7849-0.7599 on the weekly scale. Undeniably, latest movement places the weekly prime support at $0.6948-0.7242 in a vulnerable location, potentially reopening the risk of a return to weekly support at $0.6673 and neighbouring 50.0% retracement at $0.6764 this week.
Supporting the possibility of further bearish pressure is long-term trend direction. The monthly timeframe has portrayed a downtrend since August 2011, indicating the rally from the pandemic low of $0.5506 (March 2020) to a high of $0.8007 (February 2021) on the weekly timeframe is likely to be viewed as a DEEP pullback, with recent downside therefore potentially seen as a move to explore lower over the coming weeks.
Labelled as the ‘last line of defence’ for the weekly timeframe’s prime support, the daily timeframe’s decision point at $0.6964-0.7040 is on the radar this week after price decisively rotated south ahead of the 200-day simple moving average at $0.7280. If a move lower transpires, Quasimodo support at $0.6901 is likely to be watched. According to the relative strength index (RSI), the indicator established hidden bullish divergence within the oversold area which led to a near-test of the 50.00 centreline at the tail end of the week. Unless the RSI pushes out a bullish failure swing or voyages above the centreline, the indicator depicts negative momentum.
Compared to Thursday’s 2 per cent fall, downside momentum slowed considerably on Friday ahead of the 1.272% H4 Fibonacci projection at $0.7057 and a deep 88.6% Fibonacci retracement from $0.7048 (purple). This followed Thursday’s one-sided rejection of Quasimodo support-turned resistance at $0.7246. Territory south of here points to the $0.6968 28th January low.
The $0.7138-0.7118 decision point area made its way into the fight on Thursday, receiving a price whipsaw above the $0.71 figure and again on Friday during US non-farm payrolls. Clearly, it was a painful end to the week for those attempting to trade $0.71. Downstream casts light on another decision point zone at $0.7046-0.7056, though seeing support nearby at $0.7038 and another layer of support at $0.7005 as well as the widely watched $0.70 figure, efforts to hold the noted decision point area may prove fruitless.
Technical Outlook:
Medium term:
Longer term, the daily timeframe’s decision point at $0.6964-0.7040 is vulnerable, with follow-through downside looking at Quasimodo support from $0.6901.
Short term:
In light of what the bigger picture demonstrates, the H1 decision point area from $0.7138-0.7118 is likely to hold ground this week. Consequently, attacks on the H1 decision point zone at $0.7046-0.7056 are expected, which could lead to eventually targeting at least the $0.70 figure.
USD/JPY:
Following March and April’s mammoth rallies (5.8 per cent and 6.7 per cent, respectively), last week concluded higher by 0.5 per cent.
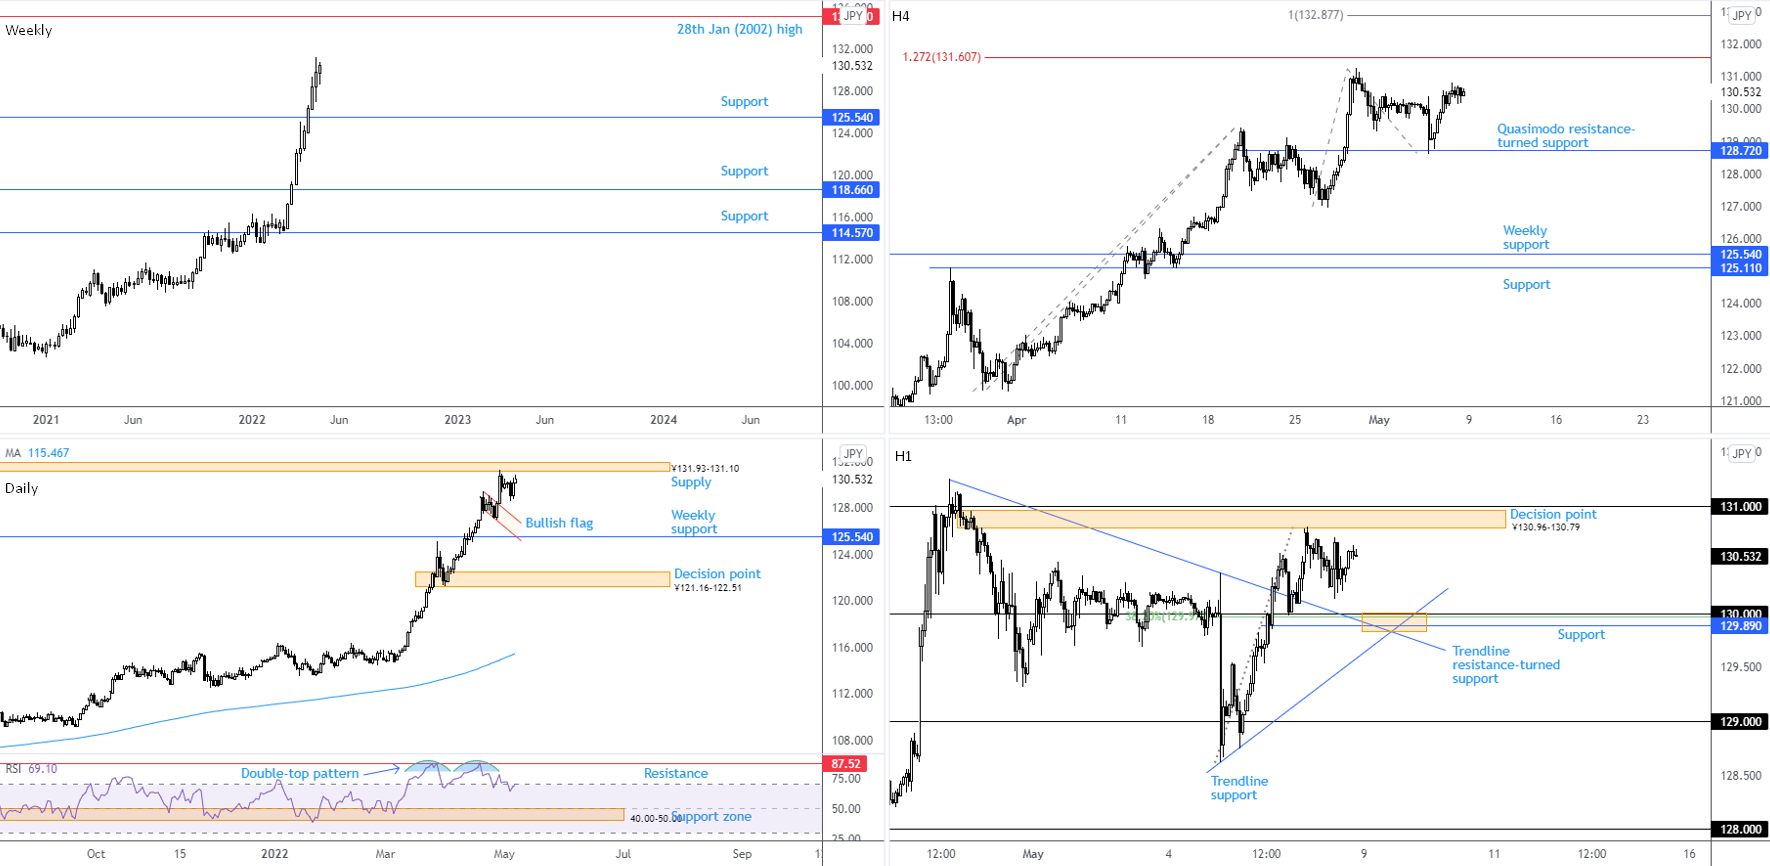
However, momentum on the weekly timeframe noticeably slowed in recent trading, despite chalking up its ninth week in the green. Weekly support remains obvious at ¥125.54 and scope for further gains to as far north as ¥135.16 is seen: 28th January high (2002). With that, traders and investors are still urged to pencil in the possibility of a retest of ¥125.54 prior to viewing a ¥135.16 attempt.
In conjunction with the weekly timeframe, alongside a heavy-handed trend since 2021, the daily timeframe reveals price action ruptured the upper boundary of a flag pattern on 28th April, drawn from a high of ¥129.41 and a low of ¥127.80. Assuming price overcomes neighbouring supply at ¥131.93-131.10, traders will be looking to a take-profit objective circa ¥136.63 (drawn by extending the pole’s distance and adding this to the breakout point). Note that this profit objective sits above the weekly timeframe’s ¥135.16 high. Also of interest, the relative strength index (RSI) has been attempting to exit overbought territory in recent weeks. It’s important to recognise that any decisive departure from the overbought area triggers a double-top pattern (neckline stationed around the 66.78 31st March low and peaks were established from indicator resistance at 87.52) and could lead the RSI to familiar support at 40.00-50.00 (a temporary oversold zone since May 2021). Yet, an important caveat to be aware of is the RSI can remain overbought for prolonged periods in uptrends and initiate a number of false bearish signals.
As evident from the H4 scale, Quasimodo resistance-turned support at ¥128.72 welcomed price and served well as a floor in the second half of the week. A 1.272% Fibonacci expansion is overhead at ¥131.61, shadowed by a 100% Fibonacci projection from ¥132.88. Based on the H1, Friday shook hands with an old decision point zone at ¥130.96-130.79 and touched a low of ¥130.14. Of technical relevance this week is ¥130, a psychological level complemented by two trendline supports, a support from ¥129.89 and a 38.2% Fibonacci retracement at ¥129.98.
Technical Outlook:
Medium term:
Both weekly and daily charts continue to echo healthy bullish vibes. The weekly timeframe reveals reach to approach ¥135.16 and the daily timeframe recently punctured the upper edge of a bullish flag pattern. Should daily candles overwhelm supply at ¥131.93-131.10, this adds (technical) weight to stimulate further bullish activity.
Short term:
From a short-term perspective, the H1 area of technical confluence between ¥129.83 and ¥130 may entice dip buyers if challenged this week. This is in line with higher timeframe direction and could see the currency pair overthrow ¥131 and reconnect with the lower side of daily supply at ¥131.10.
GBP/USD:
Sterling, once again, adopted a bearish narrative versus the US dollar last week, losing nearly 2 per cent and carving out a third back-to-back weekly bearish candle. Year to date, the pound is also down circa 9 per cent.
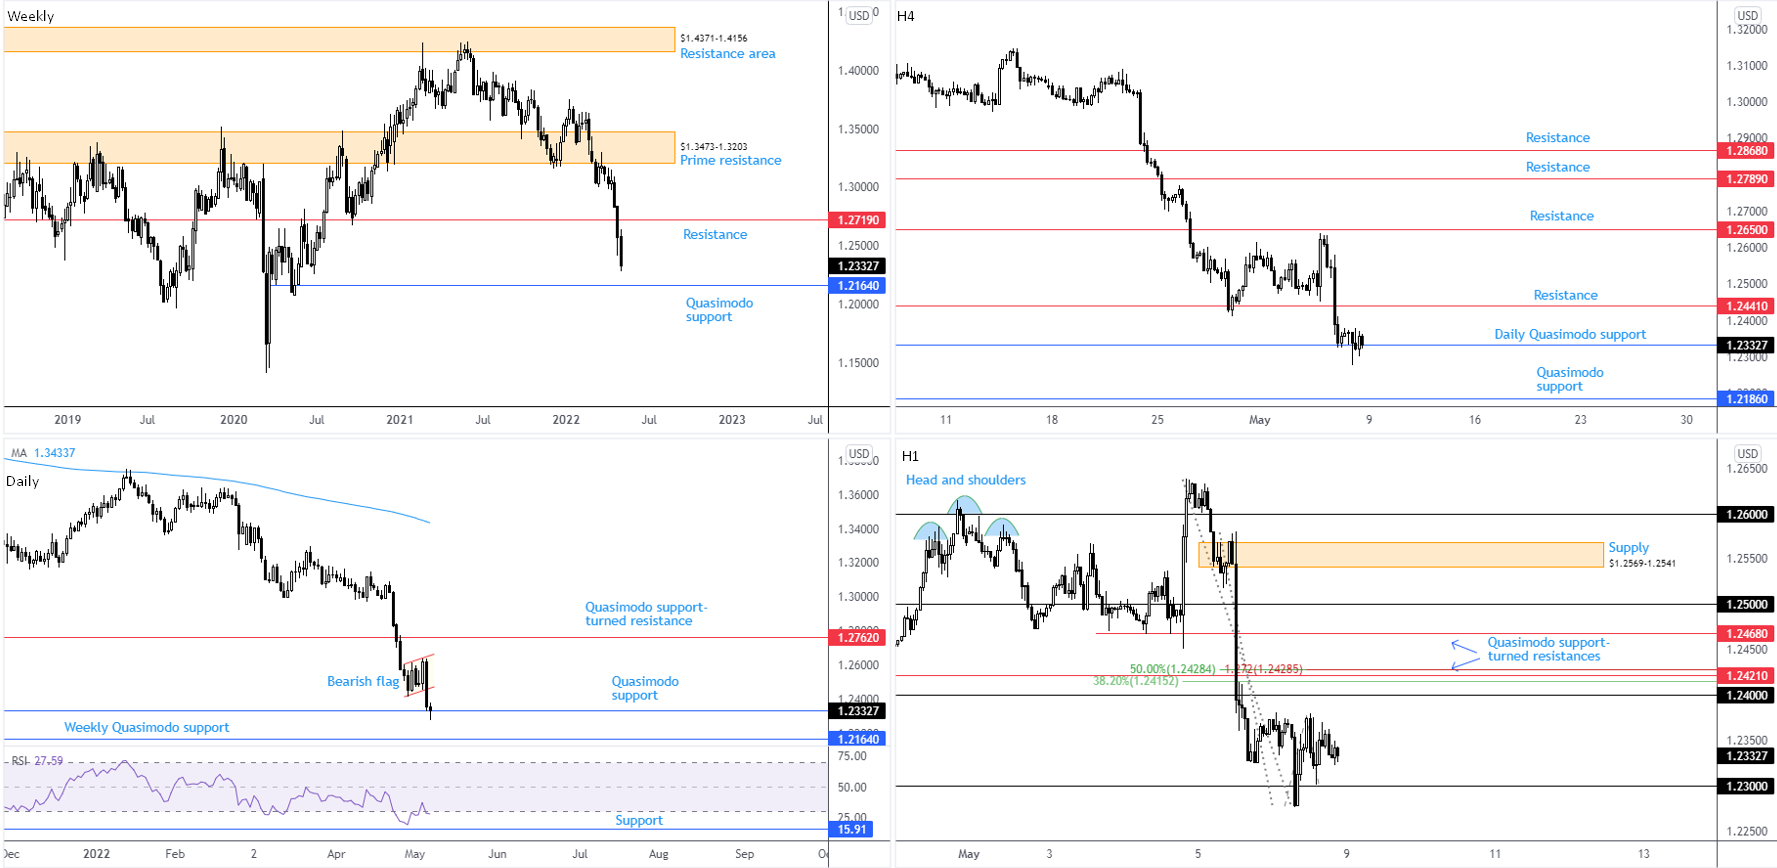
The ongoing sell-off watched weekly price elbow beneath support at $1.2719 at the end of April, a level that may subsequently forge resistance if retested. What’s technically interesting on the weekly chart is the absence of clear support until reaching a Quasimodo formation at $1.2164, in a market demonstrating a clear downside bias from February 2021 tops ($1.4241) as well as a long-term downtrend since late 2007 tops at $2.1161 (check monthly timeframe).
Technical expectations on the daily timeframe shows price action testing Quasimodo support at $1.2334, which inspired a half-hearted hammer candle Friday. This followed an earlier formation of a bearish flag pattern, made up between $1.2411 and $1.2614 (the profit objective can be plotted as far south as $1.18). Analysis of the relative strength index (RSI) has the indicator attempting to leave oversold conditions but failing to find acceptance above 37.19. Bear in mind that the RSI can register oversold signals for extended periods in a downward facing market.
Across the page on the H4 scale, the current Quasimodo support on the daily timeframe is commanding attention, in company with H4 resistance priced at $1.2441. We can see that if the opening candle on the H4 closes bearish, this might be bad news for buyers at current daily Quasimodo support; below the daily base is another Quasimodo support on the H4 at $1.2186.
The technical framework on the H1 timeframe shows the pair dropped in on $1.23 heading into London hours on Friday and maintained a floor into the close. Upstream is directed towards $1.24 and neighbouring Quasimodo support-turned resistance at $1.2421, which happens to be positioned closely with a number of Fibonacci ratios between $1.2428 and $1.2415 (note that 50.0% is not a Fibonacci ratio).
Technical Outlook:
Medium term:
Daily Quasimodo support at $1.2334 is in play and could attract a recovery move. Still, knowing the weekly timeframe exhibits capacity to tunnel lower to $1.2164, and daily price fractured the lower side of a bearish flag pattern, continuation selling to $1.2164 appears the more likely route this week, technically speaking.
Short term:
$1.24 represents an interesting level on the H1. Engaging with this level this week might have price whipsaw above the barrier to test nearby H1 resistance at $1.2421ish. This—coupled with the higher timeframes indicating sellers have the upper hand—may be interpreted as a bearish zone.
Alternatively, failure to retest $1.2421 could watch price drop under $1.23 and encourage breakout selling in the direction of $1.22 and H4 Quasimodo support at $1.2186.
DISCLAIMER:
The information contained in this material is intended for general advice only. It does not take into account your investment objectives, financial situation or particular needs. FP Markets has made every effort to ensure the accuracy of the information as at the date of publication. FP Markets does not give any warranty or representation as to the material. Examples included in this material are for illustrative purposes only. To the extent permitted by law, FP Markets and its employees shall not be liable for any loss or damage arising in any way (including by way of negligence) from or in connection with any information provided in or omitted from this material. Features of the FP Markets products including applicable fees and charges are outlined in the Product Disclosure Statements available from FP Markets website, www.fpmarkets.com and should be considered before deciding to deal in those products. Derivatives can be risky; losses can exceed your initial payment. FP Markets recommends that you seek independent advice. First Prudential Markets Pty Ltd trading as FP Markets ABN 16 112 600 281, Australian Financial Services License Number 286354.


 Access +10,000 financial
instruments
Access +10,000 financial
instruments