
US Dollar Index:
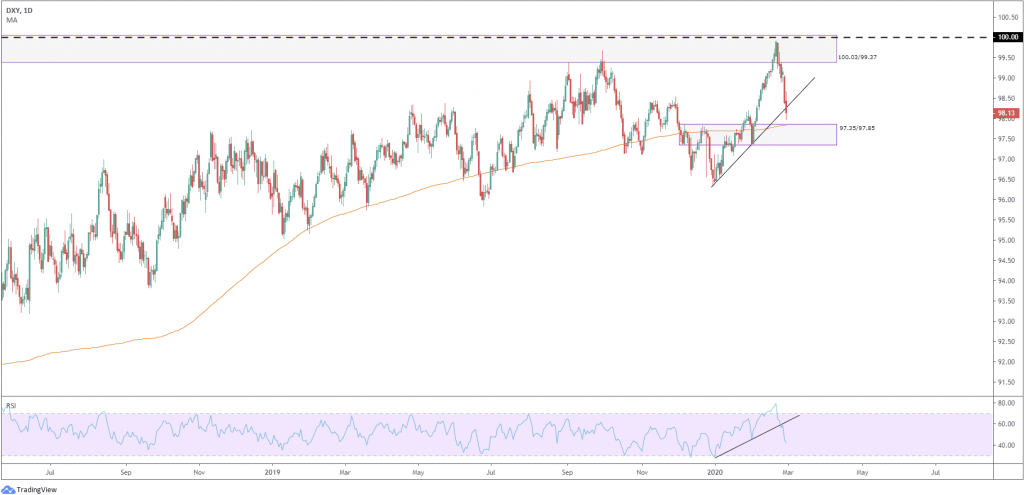
Battered and bruised, the US dollar index (DXY) wrapped up the week extending losses south of multi-year highs at 99.91, capped within long-term daily supply at 100.03/99.37.
Overthrowing 99.00 and local daily trendline support (96.36) in the later stages of the week, the 200-day SMA, currently circulating around 97.83, is in the firing range this week. Price action traders will also note the dynamic value resides around the upper boundary of daily supply-turned demand at 97.35/97.85. As a result, intraday USD selling could be on the cards, though expect 97.35/97.85 to potentially chalk up some defence this week.
With respect to the RSI, momentum breached clear trendline support last week and is seen exploring ground beneath the 50.0 mid-way value.
EUR/USD
Monthly timeframe:
(Technical change on this timeframe is often limited though serves as guidance to potential longer-term moves)
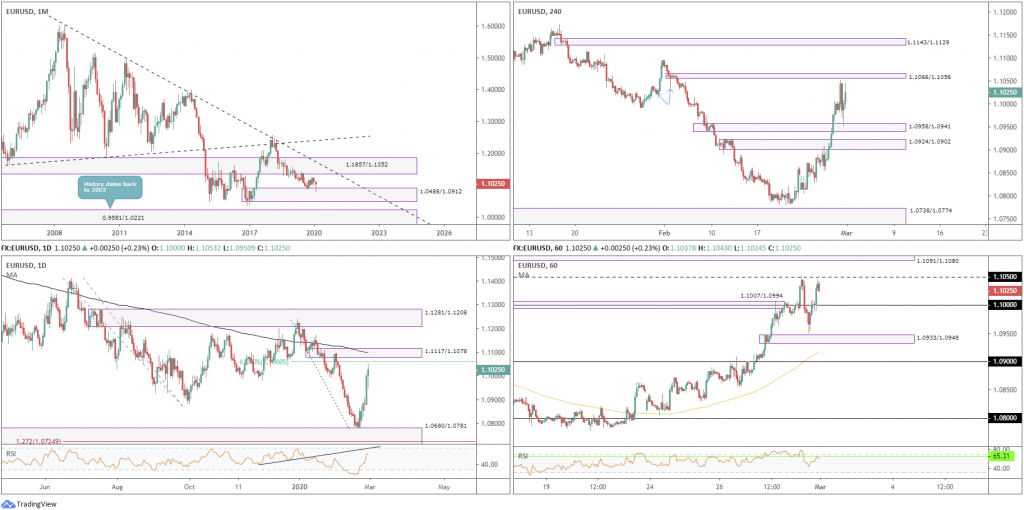
The month of February witnessed EUR/USD revisit the upper limit of demand at 1.0488/1.0912 and chalk up a reasonably appealing (bullish) hammer candlestick pattern – a noteworthy area given the momentum derived from its base. Additional upside this week is, therefore, achievable, with demand-turned supply at 1.1857/1.1352 and long-term trend-line resistance (1.6038) established as upside targets.
To the downside, however, traders looking beyond the current demand zone likely have crosshairs fixed on a reasonably ‘fresh’ demand base at 0.9581/1.0221. Note this zone boasts history dating back as far as 2003.
The primary downtrend in this market has remained lower since 2008, exhibiting clear lower peaks and troughs.
Daily timeframe:
Partially altered outlook from previous analysis.
Demand at 1.0680/1.0781, an area formed April 2017 which houses a long-term 127.2% Fibonacci ext. point within at 1.0724, elbowed its way into the spotlight in recent trade and remains a dominant fixture on this timeframe.
Last week’s 170-point gain had EUR/USD power to highs of 1.1053, though marginally softened beneath the 61.8% Fibonacci retracement at 1.1060 into the close. Neighbouring resistance can be seen in the form of supply coming in at 1.1117/1.1078 which intersects with the 200-day SMA. Should the aforementioned supply give way, traders can look forward to a possible approach forming towards supply at 1.1281/1.1208.
The RSI indicator, thanks to recent buying, is poised to test trend-line support-turned resistance, sited within overbought territory.
H4 timeframe:
Price action on the H4 timeframe found legs off supply-turned demand at 1.0958/1.0941 on Friday, after topping a few points below a small, yet interesting, supply zone at 1.1066/1.1056. This area formed after consuming bids out of demand around 1.1030 (blue arrows), therefore likely holding unfilled orders this week. A breach of the said supply this week could lead to 1.1095, the January 31st high, entering view, with a break possibly clearing the pathway to fresh supply at 1.1143/1.1129.
H1 timeframe:
Early London hours Friday observed a violation of supply at 1.1007/1.0994, with continued bidding to 1.1050. Thereafter price retreated 100 points and bottomed ahead of fresh demand at 1.0933/1.0948, consequently reclaiming 1.10+ status into the close. A break of 1.1050 today underlines supply at 1.1091/1.1080, located south of 1.11. The RSI indicator wrapped up the weak retesting resistance at 65.31, just ahead of the 70.00 overbought value.
Direction
Longer term:
Monthly price appears to have eyes for higher prices over the coming weeks, but in order to reach upside targets, daily price must overcome two supply zones at 1.1117/1.1078 and 1.1281/1.1208. As such, should we continue higher, expect road bumps along the way.
Shorter term:
H4 supply at 1.1066/1.1056 (envelopes the daily 61.8% Fibonacci retracement) is in view, positioned above 1.1050 on H1 and a touch lower beneath H1 supply at 1.1091/1.1080. A whipsaw through 1.1050, therefore, could be seen today, drawing in sellers from H4 supply and the daily Fib level, with 1.10 set as the initial take-profit target.
AUD/USD
Monthly timeframe:
(Technical change on this timeframe is often limited though serves as guidance to potential longer-term moves)
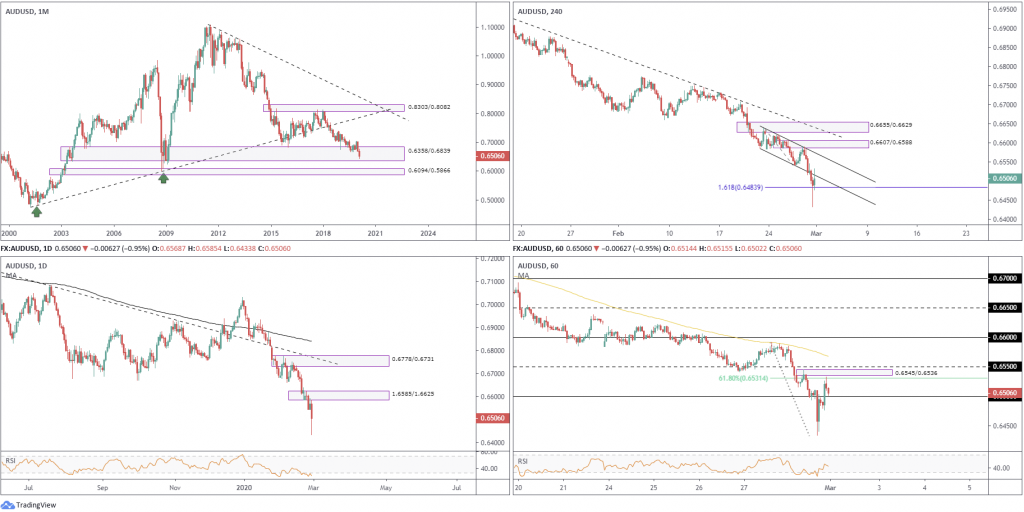
Demand at 0.6358/0.6839 remains in the fight, yet price struggles to chalk up anything meaningful to the upside. An eventual break of the said demand zone has another layer of demand close by at 0.6094/0.5866, while a recovery could lead to trend-line support-turned resistance (0.4776) making an appearance, followed by supply at 0.8303/0.8082.
The pair traded -2.80% in February.
Daily timeframe:
In light of recent downside in this market, testing multi-year lows at 0.6433, supply formed at 1.6585/1.6625. Further selling this week could approach demand at 0.6330/0.6245.
The RSI recently re-entered oversold territory, trading at 23.00.
H4 timeframe:
Supply at 0.6607/0.6588 made its debut last week, capping recovery gains off lows at 0.6542. Candlestick action pencilled in a strong bearish rotation off the said supply area, closing a touch off lows, generating follow-through selling on Friday.
Support on this timeframe falls in at the 161.8% Fibonacci ext. point at 0.6483, though a feasible ceiling is also visible off channel support-turned resistance (0.6585).
H1 timeframe:
Friday regained 0.65 on the H1 timeframe amid US hours and tested a 61.8% Fibonacci retracement at 0.6531, following aggressive session lows at 0.6434. The 61.8% Fibonacci retracement is stationed just south of supply at 0.6545/0.6536 and the 0.6550 barrier.
It might also interest traders to note that we have the 100-period SMA circulating 0.6568.
0.65 is likely to re-enter view today, yet whether it will hold as support is difficult to judge, knowing the trend in this market faces a southerly trajectory.
Direction
Longer term:
Monthly demand at 0.6358/0.6839 is rapidly deteriorating, with daily price exhibiting scope to test lower levels this week. Technical research, thus, anticipates additional selling to materialise over the coming weeks.
Shorter term:
With H4 price retesting the underside of channel support-turned resistance, a break of the 161.8% Fibonacci ext. at 0.6483 is possible, in line with the current trend. Similarly, on the H1 chart, the possibility of 0.65 holding is slim, after taking into account the overall market structure.
Traders, therefore, may seek bearish themes south of 0.65 today, targeting Friday’s low at 0.6433 as an initial base.
USD/JPY
Monthly timeframe:
(Technical change on this timeframe is often limited though serves as guidance to potential longer-term moves)
Since kicking off 2017, USD/JPY has been busy carving out a descending triangle pattern. The breakout for this configuration is common to the downside, but an upward breakout is considered more reliable and profitable. In recent movement, price elbowed a touch outside the upper boundary of the aforementioned descending triangle to 112.22, and retreated lower.
Outside of the current pattern, a supply area is visible at 126.10/122.66, while lower on the curve we have a demand area at 96.41/100.81.
The pair traded -0.26% in February.
Daily timeframe:
Erasing more than 150 points, Friday journeyed through demand at 109.52/109.99, channel support (104.44) and the 200-day SMA, before mildly recovering from demand at 107.82/108.04. The SMA as well as the recently engulfed channel support could, therefore, offer resistance this week.
Demand at 106.60/107.09 is seen as the next base in the firing range this week, as well as demand at 105.57/106.17 in the event we continue lower.
The RSI indicator also voyaged through the 50.0 value last week, down from 76.63, poised to test oversold levels this week.
H4 timeframe
Demand at 108.41/108.70 put up little fight on Friday, guiding USD/JPY to a session low of 107.51 and likely running stops south of the 107.65 January 7th low. While a retest at 108.41/108.70 is certainly not out of the question, demand at 106.94/107.30 is also a possible base worthy of attention this week.
H1 timeframe
Broad-based USD selling, weighed by soft US Treasury yields, sent USD/JPY through 108 to lows just north of 107.50, before marginally reclaiming 108 into Friday’s close. Price-action traders may also wish to note demand at 107.11/107.22, and 108.50 as possible resistance, tailed closely by supply coming in at 108.88/108.63.
Direction
Longer term:
The lower edge of daily demand at 107.82/108.04 was clipped Friday, possibly triggering sell-stop liquidity. This, along with monthly price showing space to extend losses, could see daily demand at 106.60/107.09 enter the mix this week.
Shorter term:
Intraday buyers north of 108 must contend with potential resistance off the underside of H4 demand-turned supply at 108.41/108.70, before reaching 108.50 on the H1. This is not considered a high-probability long, knowing the higher time frames suggest selling could be in store.
Despite this, should we push higher today and test 108.50, keep an eye out for H1 price to whipsaw through this level into supply at 108.88/108.63. This is considered a reasonably strong reversal zone,

GBP/USD
Monthly timeframe:
(Technical change on this timeframe is often limited though serves as guidance to potential longer-term moves)
Early February 2018 saw the pair reject 1.4520/1.3893, a 50.0% retracement and 38.2% Fibonacci retracement
combination (red). This, along with trendline resistance (2.1161), remains a well-rounded resistance area to keep
an eye on long term.
In recent months, we’ve seen a recovery form off 1.1904/1.2235, clocking highs of 1.3514 in December 2019 and
breaking the 1.3380 March 2019 high.
Currently, the pair trades at -1.88% on the month.
Daily timeframe:
Demand at 1.2823/1.2910, represents the lower edge of a multi-month range (supply at 1.3303/1.3184 caps upside), contained downside last week, staging a healthy advance to highs at 1.2981 and snapping a four-day losing streak.
Local trend-line resistance (1.3514) could make an appearance this week, as could the supply zone mentioned above at 1.3303/1.3184. Beyond the current demand, another port of demand, a touch larger than the current, resides at 1.2649/1.2799, which happens to house the 200-day SMA (1.2688).
In terms of the RSI indicator, since the beginning of the year we have been compressing within a descending channel (black lines), with the value currently rejecting its channel support.
H4 timeframe:
Friday witnessed sterling soften through an area of demand at 1.2806/1.2833, recording fresh YTD lows at 1.2725, and rebounding from 1.2718/1.2751, an area comprised of 161.8% Fibonacci ext. studies. This area is also housed within current daily demand.
1.2806/1.2833 may offer the market a platform of resistance this week, having seen its history as an area of support. In the absence of this, follow-through buying to relatively dominant supply at 1.2868/1.2894 is possible.
H1 timeframe:
Uncertainty surrounding Brexit developments weighed on sentiment Friday; the EU laid out its trade mandate followed by UK PM Johnson setting his stall and the two sides remaining divided on key red lines. The response from 1.2718/1.2751 on the H4 timeframe, coupled with support forming off 1.2750 on H1, pulled GBP/USD north of 1.28 and back into a descending channel formation (1.3008/1.2860). Technically, 1.2850 offers a particularly attractive area of resistance, bolstered by nearby channel resistance (1.3008), a trend-line support-turned resistance (1.2849), a 61.8% Fibonacci retracement at 1.2861 and a 50.0% retracement at 1.2870.
Direction
Longer term:
Daily demand at 1.2649/1.2799 could hold price higher this week, reinforced by the 200-day SMA.
Shorter term:
While longer term we are trading from demand, should a retest at the underside of 1.2870/1.2850 on the H1 occur, particularly around the yellow zone, intraday shorting opportunities could be present, with 1.28 resting as the initial target. Before 1.2870/1.2850 makes an appearance, traders may find 1.28 is retested as support. Given we’re coming from daily demand, bullish themes of 1.28 could also be an option.


 Access +10,000 financial
instruments
Access +10,000 financial
instruments