
US Dollar Index:
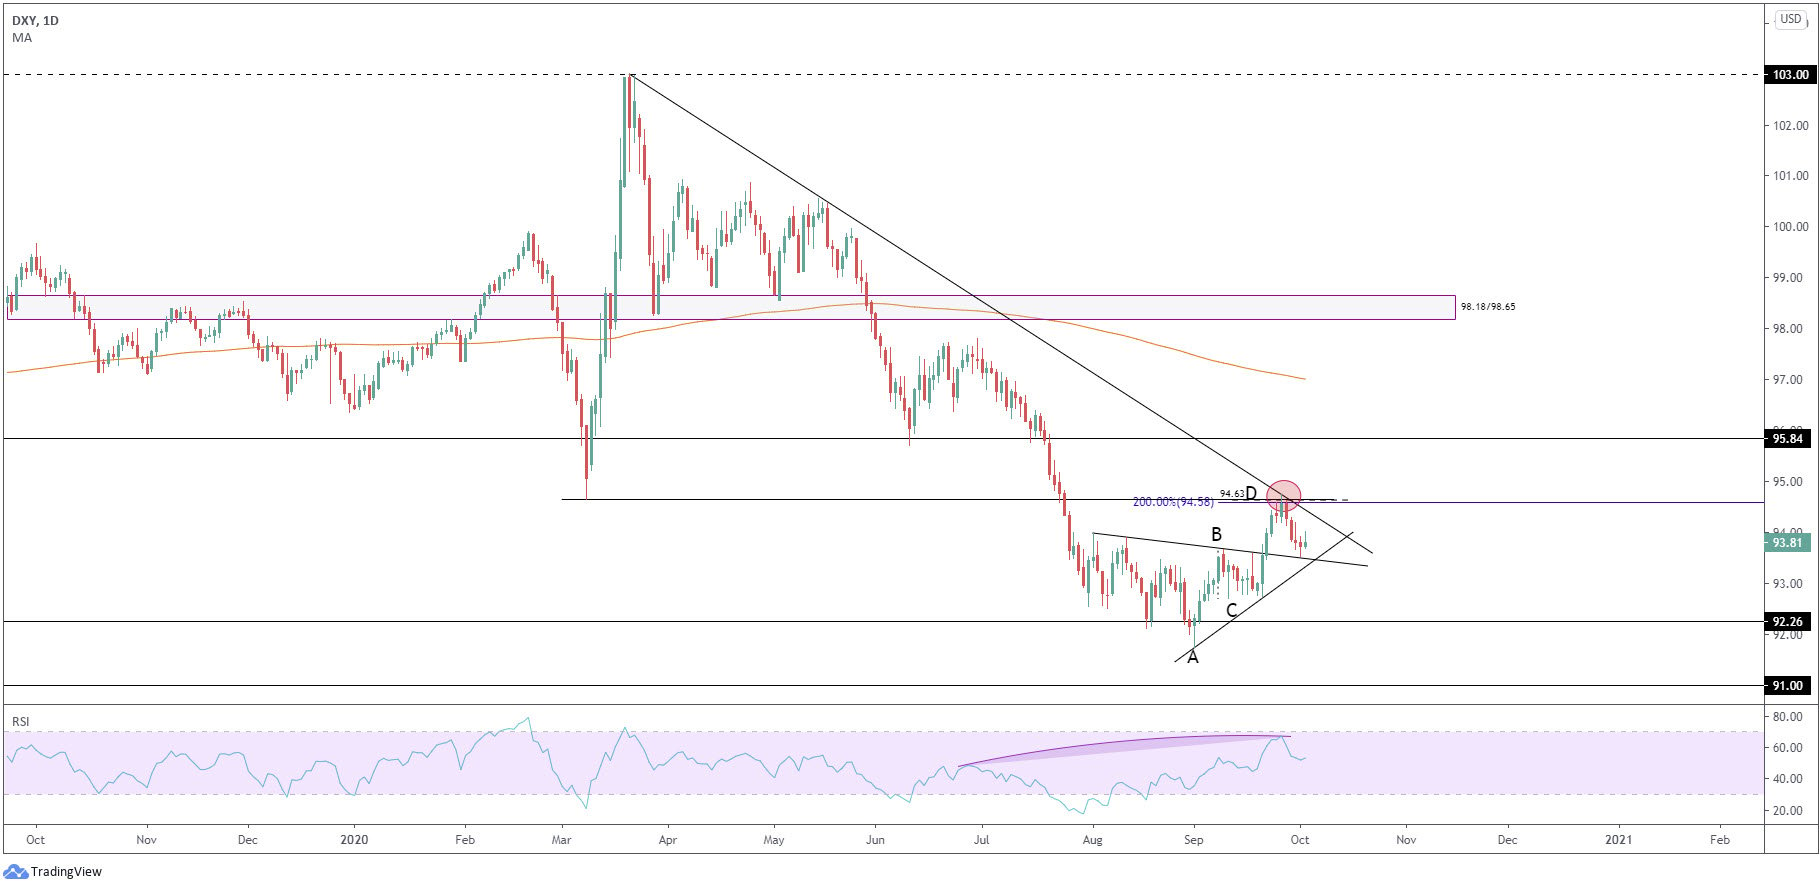
Early week, the US dollar, as measured by the dollar index (DXY), tumbled lower from an interesting combination of daily resistance, consisting of 94.65 resistance (March 9 low), a trendline resistance (102.99), an ABCD resistance at 94.63 (together with a 2.0 BC projection at 94.58) along with hidden bearish divergence out of the RSI indicator.
Erasing 0.8 percent, the DXY greeted trendline support (prior resistance – 93.99) heading into the second half of the week, conveniently tucked just ahead of another trendline support (91.75). The lack of follow-through buying observed Friday (forming a shooting star candle pattern) indicates additional selling could be in store this week, in line with the current trend, trading lower since topping in March at 102.99. Squeezing through the aforesaid trendline supports, therefore, throws light on familiar support at 92.26.
With respect to the the 200-day simple moving average, circling 97.01, the dynamic value continues to curve lower, two years after mostly drifting higher.
EUR/USD:
Monthly timeframe:
(Technical change on this timeframe is often limited though serves as guidance to potential longer-term moves)
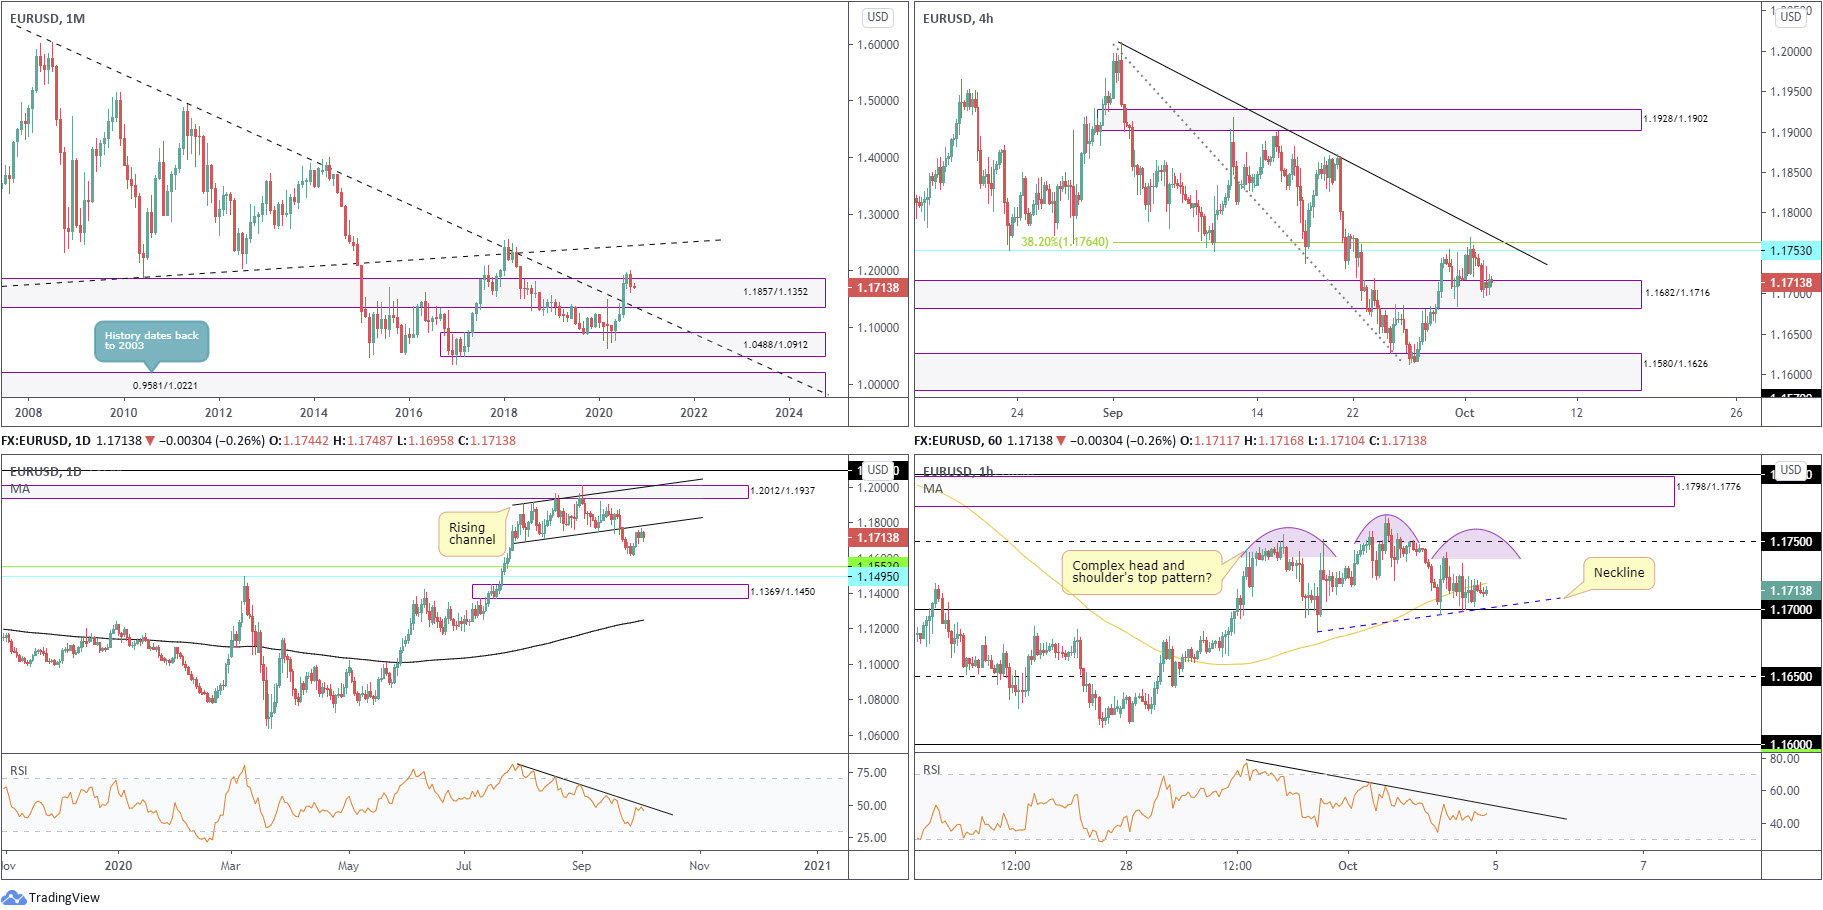
August, as you can see, toppled supply from 1.1857/1.1352 and extended space north of long-term trendline resistance (1.6038), arguing additional upside may be on the horizon, targeting trendline resistance (prior support – 1.1641).
Trading in September, however, concluded lower by 1.8 percent, snapping a four-month winning streak and establishing an outside reversal candle pattern. This refocuses attention on the recently penetrated trendline resistance (support).
The primary downtrend (since July 2008) remains intact until 1.2555 is engulfed (Feb 1 high [2018]).
Daily timeframe:
The currency pair’s technical position on the daily chart reveals stationary movement ahead of channel resistance (prior support – 1.1695).
Support at 1.1553 and also at 1.1495 remain obvious floors on this timeframe, located ahead of demand at 1.1369/1.1450.
The RSI oscillator, after spinning higher just north of oversold levels at the beginning of last week, remains on track to grapple with the 50.00 region and trendline resistance.
H4 timeframe:
Going into the second half of the week, price action addressed 1.1753 resistance, together with a 38.2% Fib level at 1.1764. Buyers also actively defended demand close by at 1.1682/1.1716. Although technical analysts determine consolidations using different methods, the fact price tested the aforesaid areas twice suggests a ranging phase.
Seeking ground above 1.1764 must also dethrone trendline resistance (1.2011), while eliminating 1.1682/1.1716 this week shines light on demand at 1.1580/1.1626.
H1 timeframe:
Partially modified from previous analysis –
Since price welcomed 1.1750 resistance (set just below supply at 1.1798/1.1776 and aligns closely with H4 resistance at 1.1753), a potential complex head and shoulder’s top pattern is developing, with a neckline taken from the low 1.1684 (September 30).
With the RSI oscillator also displaying a nearby trendline formation, a dip under 1.17 this week (and the H&S neckline) is likely to have sellers hone in on 1.1650 support.
Structures of Interest:
Long term:
Despite testing above monthly supply at 1.1857/1.1352, September’s depreciation echoes the possibility of further declines to retest the recently penetrated monthly trendline. Daily price also reveals a nearby channel resistance, a line that merges closely with daily RSI trendline resistance.
Short term:
The complex head and shoulder’s top pattern forming on the H1, in conjunction with a lack of enthusiasm seen out of H4 demand at 1.1682/1.1716, as well as the higher timeframe picture, suggests sellers may take on 1.17 this week to reach at least 1.1650.
AUD/USD:
Monthly timeframe:
(Technical change on this timeframe is often limited though serves as guidance to potential longer-term moves)
The month of September (lower by 2.9 percent) snapped a five-month winning streak and tested the upper border of demand at 0.7029/0.6664 (prior supply). From here, buyers appear free to explore as far north as 0.8303/0.8082 in the coming months, a supply zone aligning closely with trendline resistance (prior support – 0.4776).
In terms of trend, though, traders might want to take into account the primary downtrend (since mid-2011) remains south until breaking 0.8135 (January high [2018]).
Daily timeframe:
Partially modified from previous analysis –
Arranged by way of four successive daily bullish candles out of demand at 0.6964/0.7042, supply at 0.7131/0.7192 (prior demand) made an entrance last week. Despite modestly testing stops above its border on Thursday, Friday twisted lower and snapped the four-day run.
The technical landscape above the aforesaid supply reveals scope to test peaks around 0.7345 and supply coming in from 0.7453/0.7384.
The trend, according to the daily timeframe, has emphasised a positive tone since bottoming in late March. Traders may also recognise the RSI recently recovered from oversold turf and is within a stone’s throw from retesting 53.00 S/R.
H4 timeframe:
Supply from 0.7234/0.7199 (intersects with a 61.8% Fib level at 0.7214 and is located just above daily supply at 0.7131/0.7192) greeted price action Thursday, with Friday rolling lower and shedding light on demand at 0.7100/0.7117, together with a nearby support at 0.7080.
A lack of selling interest this week will have market participants consider the possibility of further buying to trendline resistance (prior support – 0.7076) and supply coming in from 0.7234/0.7286.
H1 timeframe:
Early trading on Friday, following Thursday’s 0.72 rejection, bumped through trendline support (0.7005) and demand at 0.7178/0.7163, consequently taking on 0.7150 support. Although volatility diminished heading into European trade, the pair retested the penetrated areas and formed mild resistance.
The 100-period simple moving average circles just beneath current price, a line that may offer traders support this week. Toppling the SMA value, nevertheless, implies further losses to the 0.71 level.
With reference to the RSI oscillator, we can see two trendline resistances positioned around 62.00 this week.
Structures of Interest:
Long term:
Monthly price testing 0.7029/0.6664 as demand prompts a bullish theme, enough to perhaps force daily price beyond supply from 0.7131/0.7192 this week. Though do bear in mind that movement to the upside trades against the primary downtrend.
Short term:
A short-term dip from H1 supply at 0.7178/0.7163 could unwind to 0.71, which marks an interesting level of possible support this week. 0.71 forms the lower edge of H4 demand and has additional back-up from H4 support at 0.7080. We also have monthly demand suggesting a nudge higher, albeit against the primary trend.

USD/JPY:
Monthly timeframe:
(Technical change on this timeframe is often limited though serves as guidance to potential longer-term moves)
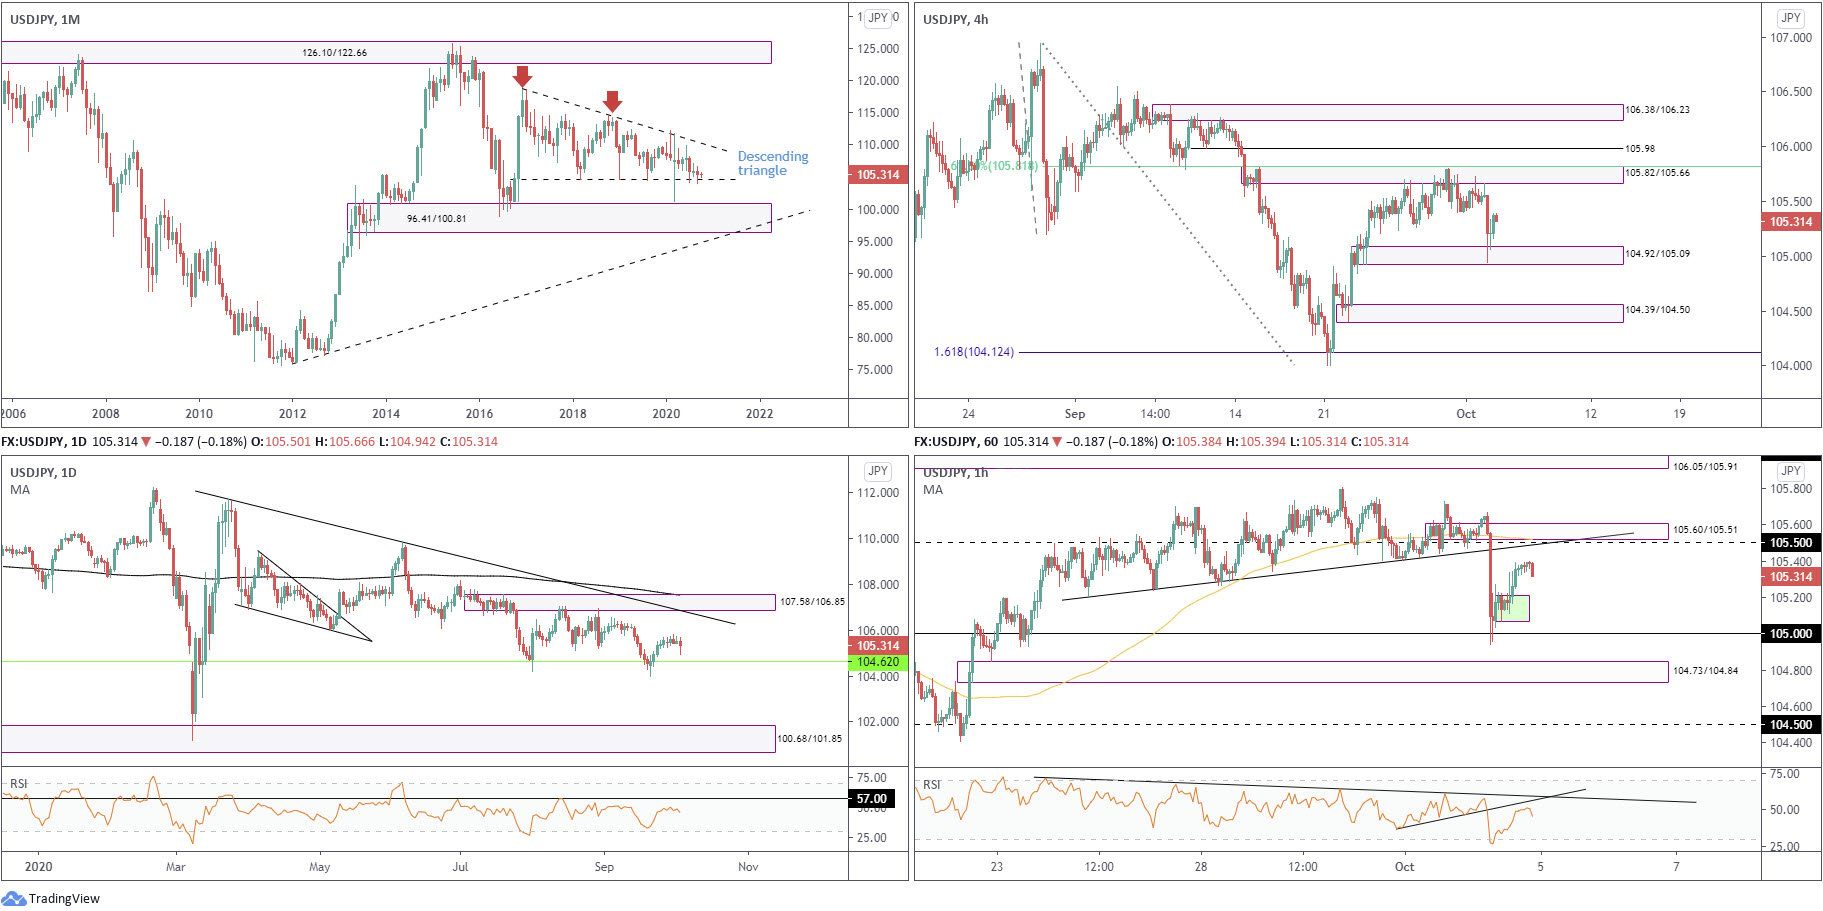
Since kicking off 2017, USD/JPY has been carving out a descending triangle pattern between 118.66/104.62.
September, as you can see, tested the lower boundary of the aforesaid pattern and ended the month modestly off worst levels.
Areas of interest outside of the triangle can be seen at supply from 126.10/122.66 and demand coming in at 96.41/100.81.
Daily timeframe:
Brought forward from previous analysis –
Recovery gains off monthly support at 104.62 (the lower boundary of the monthly descending triangle), despite price stalling around the 105.50 neighbourhood in recent trading, invites the prospect of additional bullish sentiment this week towards trendline resistance (111.71) and nearby supply at 107.58/106.85 (joined by the 200-day simple moving average at 107.52).
The RSI, for those who follow momentum oscillators, recently bottomed ahead of oversold levels and is on course to retest resistance around 57.00.
H4 timeframe:
On news US President Donald Trump had tested positive for coronavirus, USD/JPY nosedived south of supply at 105.82/105.66 (stores a 61.8% Fib level within its upper boundary at 105.81) early Friday with enough force to test demand at 104.92/105.09.
Additional areas of interest on the H4 chart for the week ahead can be seen at resistance from 105.98, supply from 106.38/106.23 and demand at 104.39/104.50.
H1 timeframe:
Friday’s sell-off amid news Trump had tested positive for coronavirus directed intraday action through trendline support (105.20) to test the 105 level (located just ahead of demand at 104.73/104.84). Price, as you can see though, rebounded into Europe and only saw a mild pullback form in the last hour of the US session.
Overhead, trendline resistance (105.20) is an obvious watch this week, as is 105.50 resistance and supply at 105.60/105.51. The RSI also deserves a mention here, having seen the value chalk up two nearby trendline resistances to work with around 58.00.
Structures of Interest:
Long term:
Monthly support at 104.62 (lower base of the monthly descending triangle) holding price higher in September, along with the daily chart exhibiting room to approach trendline resistance and supply coming in from 107.58/106.85, signals buyers still have a reasonably strong hand in this fight.
Short term:
H4, alongside the higher timeframes, also demonstrates room to probe higher this week until supply at 105.82/105.66. With this being the case, local H1 demand (green) around 105.06/105.21 could be an area traders seek to locate intraday buying opportunities, with H1 supply at 105.60/105.51 targeted (arranged just beneath H4 supply at 105.82/105.66). However, do keep in mind that a whipsaw through 105.06/105.21 to test 105 is possible before buyers make a show.
GBP/USD:
Monthly timeframe:
(Technical change on this timeframe is often limited though serves as guidance to potential longer-term moves)
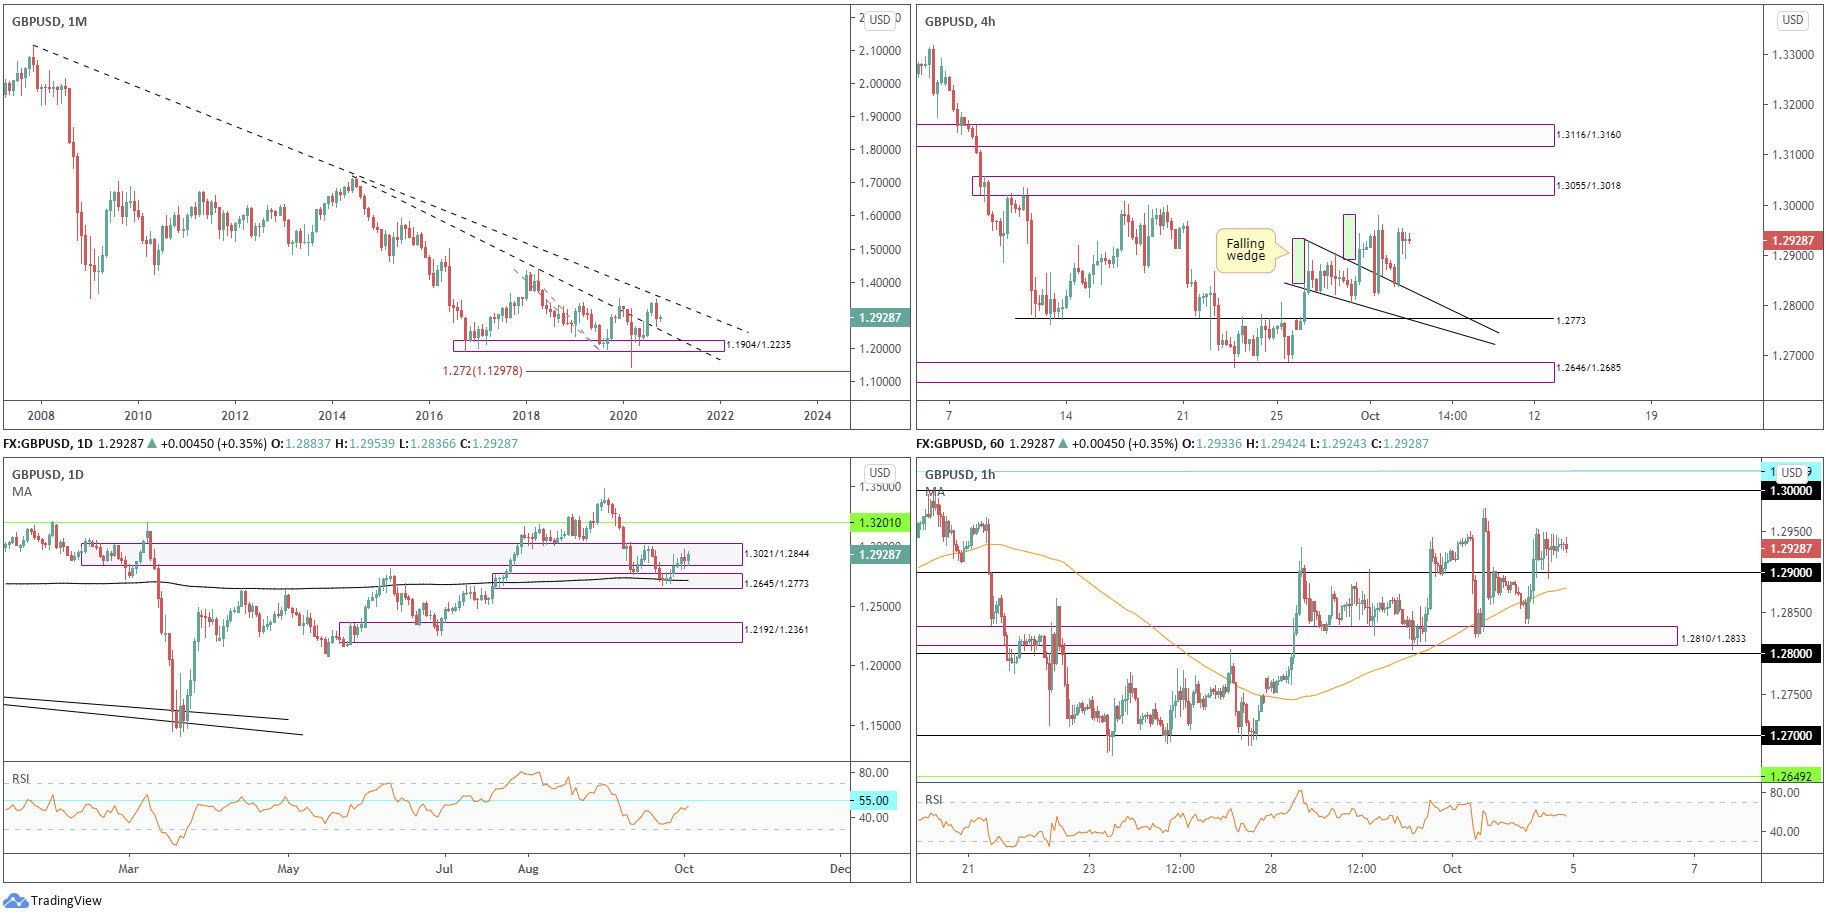
Leaving trendline resistance taken from 2.1161 unopposed, September sunk 3.4 percent by way of a bearish outside reversal candle, on track to perhaps retest trendline support (prior resistance – 1.7191). Interestingly, the primary trend has faced lower since early 2008, unbroken (as of current price) until 1.4376 gives way – April 2 high 2018.
Daily timeframe:
Partially modified from previous analysis –
Supply at 1.3021/1.2844 entertained the majority of price movement last week, following the prior week’s rebound out of demand at 1.2645/1.2773 (and 200-day simple moving average at 1.2715). A continuation to the upside this week shifts interest to resistance at 1.3201.
The RSI indicator recently formed a double-bottom ahead of oversold space, and currently hovers within touching distance of resistance at 55.00.
H4 timeframe:
The falling wedge pattern between 1.2929/1.2828 was the primary focus on the H4 chart last week. Mid-week observed a breakout to the upside, which was shortly after followed up with a retest and a subsequent run to the pattern’s take-profit target around the 1.2980 region (green). Interestingly, Friday retested the pattern’s upper border for a second time and rallied to a high of 1.2953.
Finding acceptance above 1.2980 this week highlights supply at 1.3055/1.3018, with a break unearthing the possibility of supply at 1.3116/1.3160 (prior demand) making a show.
H1 timeframe:
Friday settled a few pips above the 1.29 level, following a retest heading into the US session.
Technically, there’s not much stopping buyers from hauling the currency pair to the widely watched 1.30 level this week, sheltered just under resistance at 1.3022 (located within H4 supply at 1.3055/1.3018). Beyond 1.29, nevertheless, it is still worth noting the 100-period simple moving average around 1.2880 and demand at 1.2810/1.2833.
Structures of Interest:
Long term:
Monthly price shows space to extend September’s losses until testing trendline support (prior resistance). In conjunction with the monthly timeframe, daily price is seen exploring supply at 1.3021/1.2844, though sellers have yet to commit here.
Longer term, therefore, points to possible downside.
Short term:
From an intraday perspective, H4 rebounding from upper edge of the falling wedge pattern (support) a second time reveals H4 supply at 1.3055/1.3018 could make its way into the show sometime this week. On top of this, we can see buyers on the H1 timeframe holding 1.29 with room to approach 1.30.
Shorter term, therefore, reveals buyers could push for 1.30 before higher timeframe sellers make an entrance.
DISCLAIMER:
The information contained in this material is intended for general advice only. It does not take into account your investment objectives, financial situation or particular needs. FP Markets has made every effort to ensure the accuracy of the information as at the date of publication. FP Markets does not give any warranty or representation as to the material. Examples included in this material are for illustrative purposes only. To the extent permitted by law, FP Markets and its employees shall not be liable for any loss or damage arising in any way (including by way of negligence) from or in connection with any information provided in or omitted from this material. Features of the FP Markets products including applicable fees and charges are outlined in the Product Disclosure Statements available from FP Markets website, www.fpmarkets.com and should be considered before deciding to deal in those products. Derivatives can be risky; losses can exceed your initial payment. FP Markets recommends that you seek independent advice. First Prudential Markets Pty Ltd trading as FP Markets ABN 16 112 600 281, Australian Financial Services License Number 286354.


 Access +10,000 financial
instruments
Access +10,000 financial
instruments