
US Dollar Index:
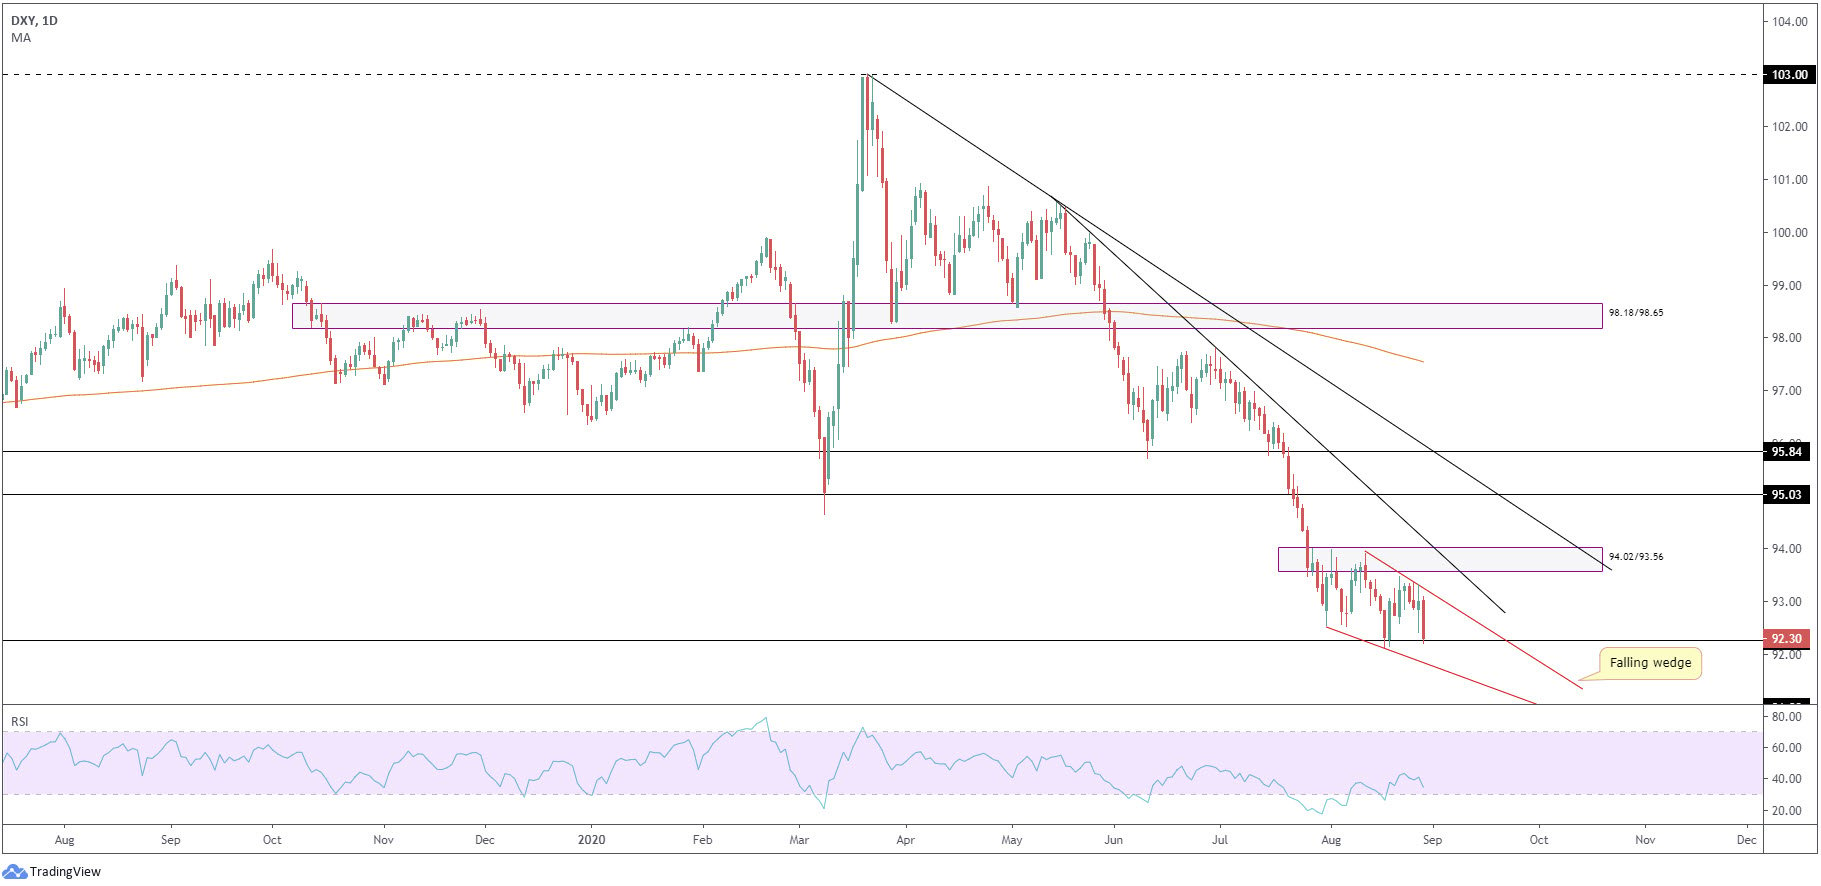
The response from daily support at 92.26 (August 19), an active S/R level since late 2017, was, as you can see, short-lived, topping ahead of daily supply at 94.02/93.56 (August 21). Down 1 percent on the week, the aforesaid support re-entered the frame Friday, approached by way of a dominant, almost full-bodied, bearish candle.
Technically, the immediate trend has faced a southerly course since the 102.99 peak (March 20), with price movement recently taking out the 94.65 low (March 9) in late July. Removing 92.26 support this week brings light to the 91.00 level. Also technically appealing is the potential daily falling wedge pattern (93.91/92.55).
Traders with a focus on momentum-based indicators will also acknowledge the RSI oscillator recently exited oversold space and is currently trending north. Concerning the 200-day simple moving average, circling 97.54, the dynamic value continues to curve lower, two years after mostly drifting higher.
Looking ahead, USD buyers may step aside this week and fill more of the noted falling wedge configuration, perhaps generating enough force to cross paths with the 91.00 level.
EUR/USD:
Monthly timeframe:
(Technical change on this timeframe is often limited though serves as guidance to potential longer-term moves)
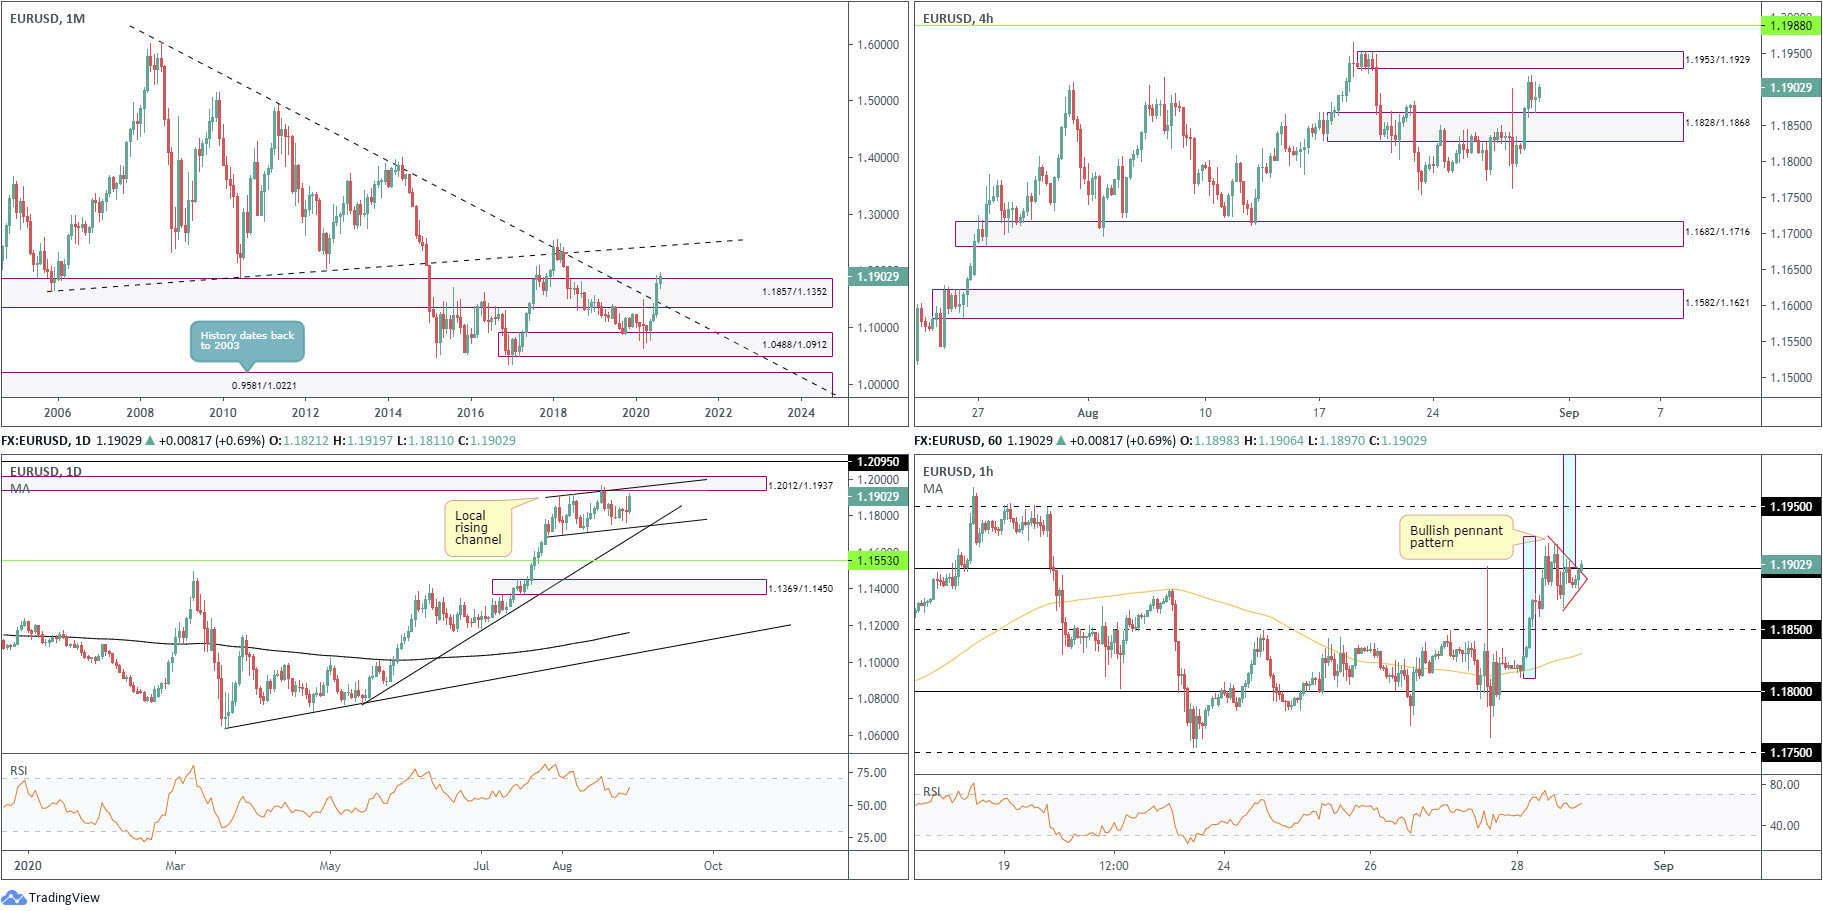
The euro nudged to a third successive monthly gain against the US dollar in July, adding nearly 5 percent. The move toppled long-term trendline resistance (1.6038) and made contact with the upper border of supply from 1.1857/1.1352.
This, alongside August heading for a relatively positive close on the month, argues further moves to the upside may be on the horizon, with trendline resistance (prior support – 1.1641) on the radar as the next target. Also worth taking into consideration, though, is the primary downtrend (since July 2008) still remains intact, at least until 1.2555 is engulfed (Feb 1 high [2018]).
Daily timeframe:
Efforts to extend July’s advance have so far been contained within a rising channel pattern (1.1695/1.1909), in addition to supply at 1.2012/1.1937 also recently making an entrance (August 18), extended from May 2018. Trend traders will also note the immediate trend has advanced since late March.
Interestingly, a trendline support (1.0774) currently intersects with the aforesaid channel support, potentially reinforcing the area in the event of a test this week. On the other hand, immersing current supply favours moves to resistance at 1.2095.
The RSI indicator, since the beginning of August, has drifted lower and exited overbought space, currently circling the 65.00 neighbourhood.
H4 timeframe:
Supply at 1.1828/1.1868 stomached an energetic spike to highs at 1.1901 last Thursday, enough to clear out the majority of sell orders. This, together with additional fuel from the DXY declining 0.7% on Friday, directed EUR/USD higher into the week’s end, taking the said supply.
1.1828/1.1868, as you can see, was retested as demand Friday, shining light on supply coming in from 1.1953/1.1929, as well as resistance from 1.1988.
H1 timeframe:
Heading into US trading Friday fashioned a bullish pennant pattern between 1.1918/1.1868.
Interestingly, the closing stages of the session saw price address, and mildly surpass, not only the upper boundary of the aforesaid pennant pattern but also 1.19 resistance.
Considered a continuation pattern, the bullish pennant take-profit target, measured by gauging the preceding move and adding the value to the breakout point (blue), can be found a few pips north of the widely watched 1.20 figure. However, traders will also take into account the 1.1950 resistance.
Structures of Interest:
Long term:
The monthly timeframe threatens further buying above supply at 1.1857/1.1352, leaning towards the 1.24 region. On the daily timeframe, we are contained within a rising channel between 1.1695/1.1909, though somewhat hampered by supply at 1.2012/1.1937.
Overall, buyers appear to have the advantage this week.
Short term:
After retesting 1.1828/1.1868 on the H4 timeframe, this may see buyers welcome moves to supply at 1.1953/1.1929. In conjunction with this, H1 also exhibits bullish signals: crossing above 1.19 and taking out the bullish pennant’s upper boundary (1.1918).
The higher timeframe’s landscape, coupled with lower timeframes also suggesting higher moves, could have buyers zone in on H1 structure in early trading this week.
AUD/USD:
Monthly timeframe:
(Technical change on this timeframe is often limited though serves as guidance to potential longer-term moves)
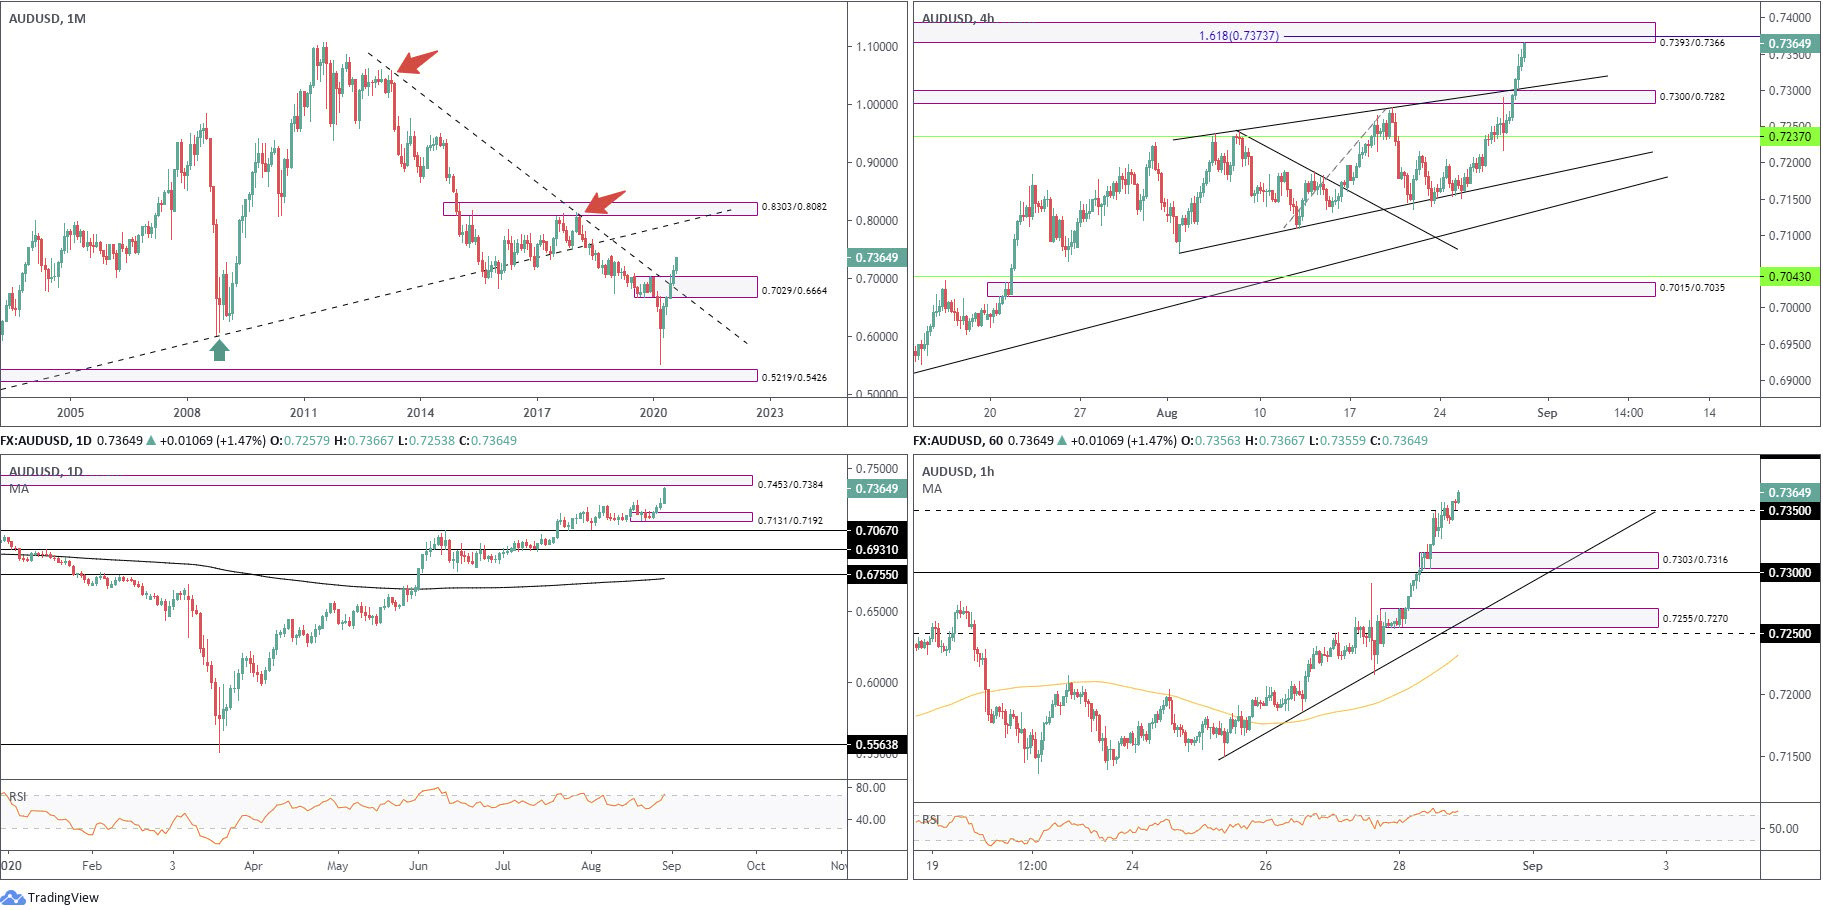
May’s extension, together with June, July and August’s follow-through, has witnessed supply at 0.7029/0.6664 and intersecting long-term trendline resistance (1.0582) abandon its position.
Technically, buyers now appear free to explore as far north as 0.8303/0.8082 in the coming months, a supply zone aligning closely with trendline resistance (prior support – 0.4776).
Although price has removed trendline resistance and a notable supply, the market’s primary trend (since mid-2011) remains south until breaking 0.8135 (January high [2018]).
Daily timeframe:
Aside from Monday closing off best levels, the remainder of the week took on a bullish theme with Friday settling at session highs ahead of supply from 0.7453/0.7384. The recent advance also established a drop-base-rally demand area at 0.7131/0.7192, and pulled the RSI indicator to within overbought territory.
The trend, according to the daily timeframe, has been higher since bottoming in late March.
H4 timeframe:
Resistance at 0.7237 put up little fight Thursday, with the pair ultimately drawing in supply at 0.7300/0.7282.
0.7237 served well as support, with Friday toppling the aforesaid supply as well as trendline resistance (0.7241). As you can see, this led to end-of-week trade crossing paths with supply at 0.7393/0.7366, a mild rally-base-drop supply that shares the same space with a 161.8% Fib ext. level at 0.7373.
H1 timeframe:
Friday’s upside momentum left little room for sellers, making quick work of the 0.73 level. Heading into the US session, although momentum somewhat petered off, we also overrun 0.7350 resistance and consequently threw light on 0.74 resistance as well as pulling the RSI value into overbought space.
Also worth noting is the rally-base-rally demand areas formed during Friday’s advance at 0.7255/0.7270 and 0.7303/0.7316.
Structures of Interest:
Long term:
Monthly action suggests higher moves after taking supply at 0.7029/0.6664, though the primary trend is still down.
Daily candles suggest supply at 0.7453/0.7384 could hinder buying this week, with a pullback targeting demand at 0.7131/0.7192.
Buying, based on the above, could be seen in early trade, though sellers will likely try and make an entrance off daily supply.
Short term:
Room is seen for further upside on the H1 timeframe to 0.74 as buyers establish a position above 0.7350. However, H4 action is on the doorstep of supply from 0.7393/0.7366.
On account of the above analysis, monthly, daily and the H1 timeframes indicate there is some scope to press higher, therefore, highlighting possible intraday bullish activity in early trading. This will, of course, see H4 supply at 0.7393/0.7366 come under pressure.
USD/JPY:
Monthly timeframe:
(Technical change on this timeframe is often limited though serves as guidance to potential longer-term moves)
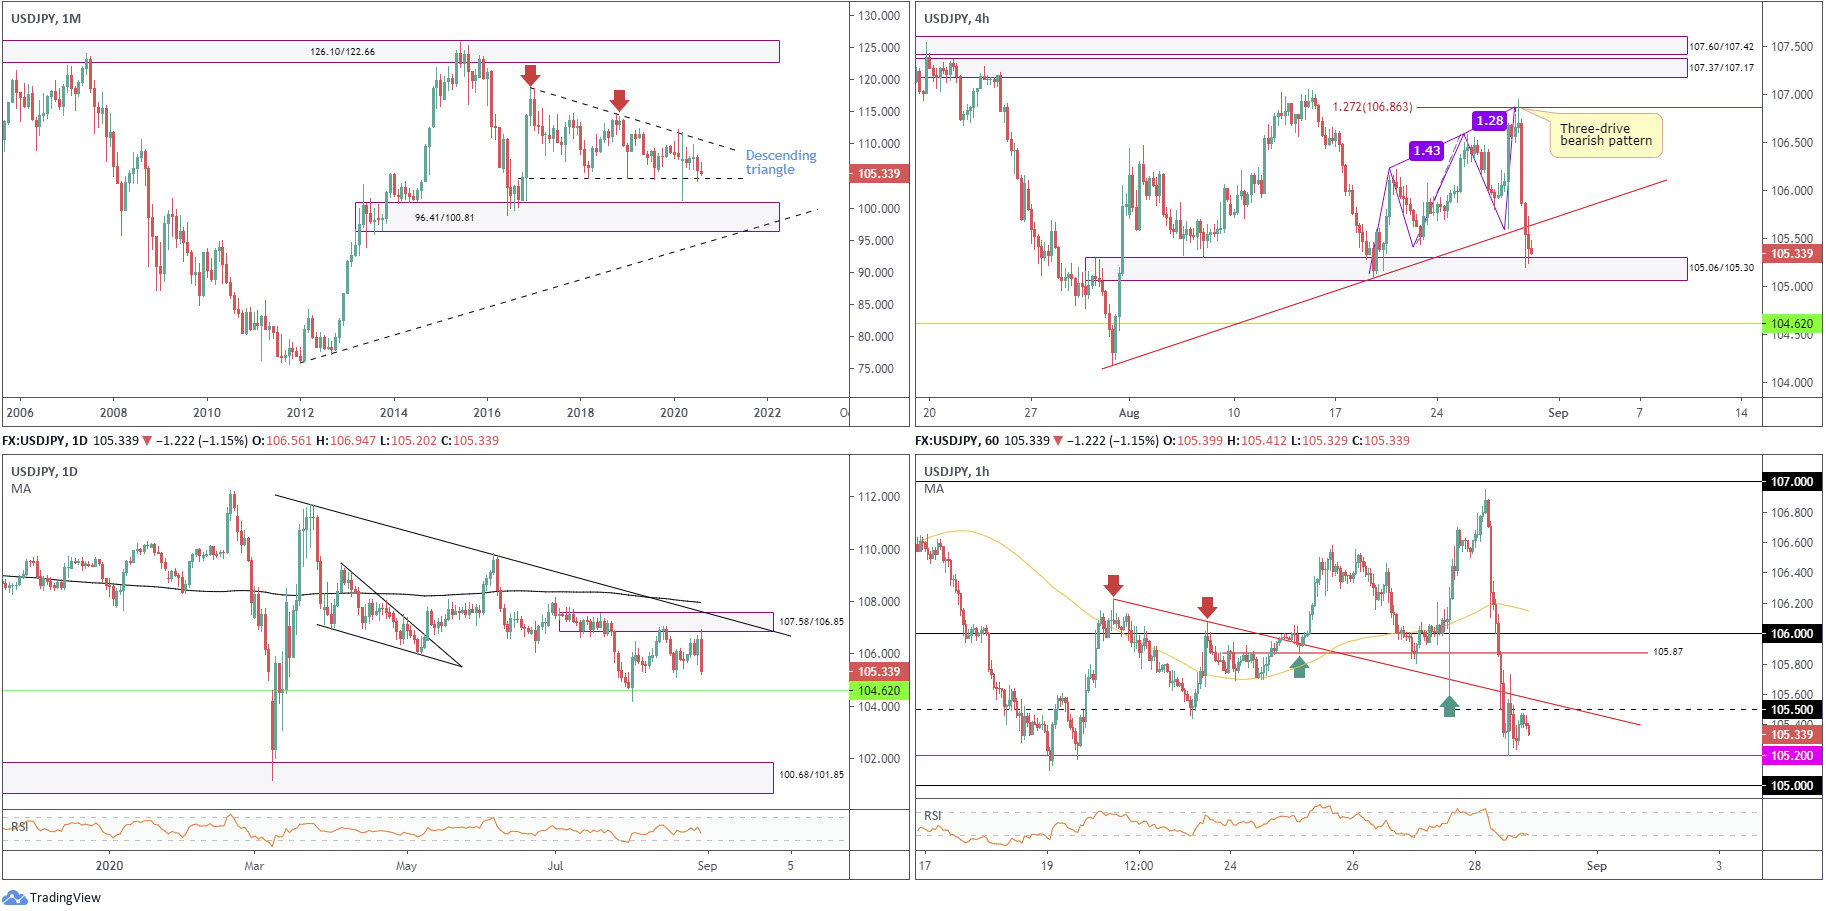
Since kicking off 2017, USD/JPY has been carving out a descending triangle pattern between 118.66/104.62.
April, May and June were pretty uneventful, with the latter wrapping up indecisively in the shape of a neutral doji candlestick pattern. July, nonetheless, sunk nearly 2 percent, testing the lower boundary of the descending triangle, while August trades off best levels.
Areas outside of the noted triangle can be seen at supply from 126.10/122.66 and demand coming in at 96.41/100.81.
Daily timeframe:
After recovering from monthly support at 104.62 in early August, supply from 107.58/106.85 has proven a tough nut to crack (an area sharing space with trendline resistance from 111.71 and also located just under the 200-day simple moving average at 107.96), with Friday coming forward and chalking up a healthy bearish outside day reversal.
Trading to the downside this week, a move that takes on 104.62, shifts interest to demand at 100.68/101.85, drawn from 2016.
H4 timeframe:
Following the completion of a three-drive bearish formation at the 127.2% Fib ext. level from 106.86, candlestick movement formed a shooting star pattern, considered a bearish signal at peaks, and declined considerably. The move took out trendline support (104.18) and tested demand at 105.06/105.30.
Giving up current demand this week swerves things back towards monthly support at 104.62.
H1 timeframe:
Leaving 107 unopposed on Friday, USD/JPY run through a number of technical supports on the H1 timeframe, testing support at 105.20 to-the-pip, a level located just ahead of the 105 hurdle. Upside attempts have so far been capped by 105.50 resistance and a trendline resistance from 106.21.
With respect to the RSI indicator, we entered oversold territory yet marginally exited the space heading into the closing hours.
Structures of Interest:
Long term:
The fact daily supply at 107.58/106.85 has capped upside attempts unearths the possibility the monthly descending triangle support at 104.62 could be consumed this week.
Short term:
The reaction from H4 demand at 105.06/105.30 has so far failed to deliver much of an upside move, capped by trendline resistance (104.18). By the same token, buyers off support at 105.20 face resistance from the 105.50 region on the H1 timeframe.
Taking into account that short-term action is finding it difficult to press higher, along with the higher timeframes pointing to a move towards monthly support at 104.62, this may have traders attempt to secure bearish strategies off 105.50 in early trading this week.
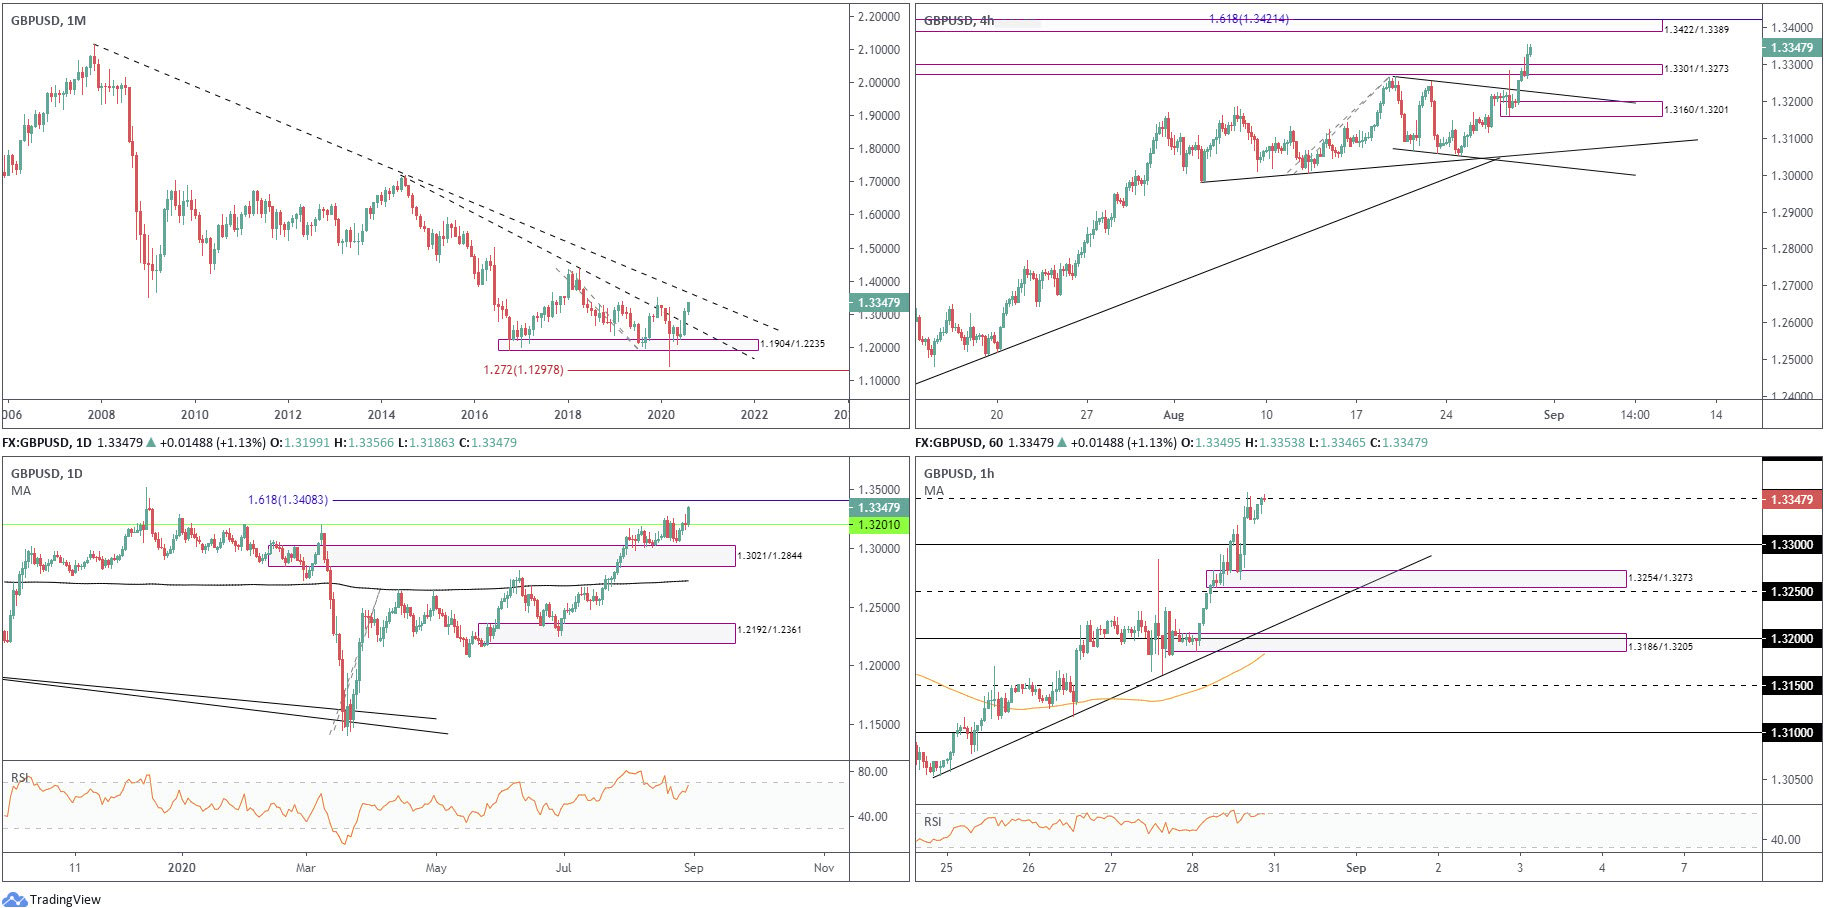
GBP/USD:
Monthly timeframe:
(Technical change on this timeframe is often limited though serves as guidance to potential longer-term moves)
GBP/USD finished higher by 5.5 percent in July, leading to long-term trendline resistance (1.7191) vacating its position.
Despite the primary trend facing lower since early 2008 (unbroken until 1.4376 gives way – April 2 high [2018]), the break of current trendline resistance has August pushing for a 2 percent gain, with September likely targeting trendline resistance (2.1161).
Daily timeframe:
Buyers eventually mustered enough strength to overtake resistance at 1.3201 last week, in line with the immediate trend on the daily timeframe. This places a 161.8% Fib ext. level at 1.3408 in the mix this week as potential resistance.
1.3021/1.2844 remains stationed as demand, with a violation uncovering the 200-day simple moving average at 1.2724.
H4 timeframe:
Following Thursday’s rejection from supply at 1.3301/1.3273, a drop-base-rally demand area formed at 1.3160/1.3201. Channel resistance (1.3263), as well as supply at 1.3301/1.3273, taken from December 2019, were both taken out in the second half of the week, potentially establishing a basis for further buying to supply at 1.3422/1.3389, and a 161.8% Fib ext. level at 1.3421.
H1 timeframe:
Demand at 1.3254/1.3273 received price action heading into the US session on Friday, after running stops above 1.33. Price went forward and reclaimed 1.33 and crossed into 1.3350 resistance by the close. While pulling the RSI indicator into overbought territory, traders will also note that a 1.3350 break perhaps underlines an approach to 1.34.
Structures of Interest:
Long term:
Longer-term price movement signals buyers remain in the driving seat heading into the new week, at least until we engage the 161.8% Fib ext. level on the daily timeframe at 1.3408.
Short term:
H4 trades in tune with the higher timeframes, showing room to reach for supply at 1.3422/1.3389. This reveals 1.3350 resistance on the H1 timeframe is unlikely to deliver much to write home about, with bullish signals perhaps forming above 1.3350 in early trading, taking aim at 1.3389 (the lower edge of H4 supply) and then the 1.34 level on the H1 which also aligns closely with the 161.8% Fib ext. level on the daily timeframe at 1.3408.
DISCLAIMER:
The information contained in this material is intended for general advice only. It does not take into account your investment objectives, financial situation or particular needs. FP Markets has made every effort to ensure the accuracy of the information as at the date of publication. FP Markets does not give any warranty or representation as to the material. Examples included in this material are for illustrative purposes only. To the extent permitted by law, FP Markets and its employees shall not be liable for any loss or damage arising in any way (including by way of negligence) from or in connection with any information provided in or omitted from this material. Features of the FP Markets products including applicable fees and charges are outlined in the Product Disclosure Statements available from FP Markets website, www.fpmarkets.com and should be considered before deciding to deal in those products. Derivatives can be risky; losses can exceed your initial payment. FP Markets recommends that you seek independent advice. First Prudential Markets Pty Ltd trading as FP Markets ABN 16 112 600 281, Australian Financial Services License Number 286354.


 Access +10,000 financial
instruments
Access +10,000 financial
instruments