
Note – Charts provided by Trading View
US Dollar Index:
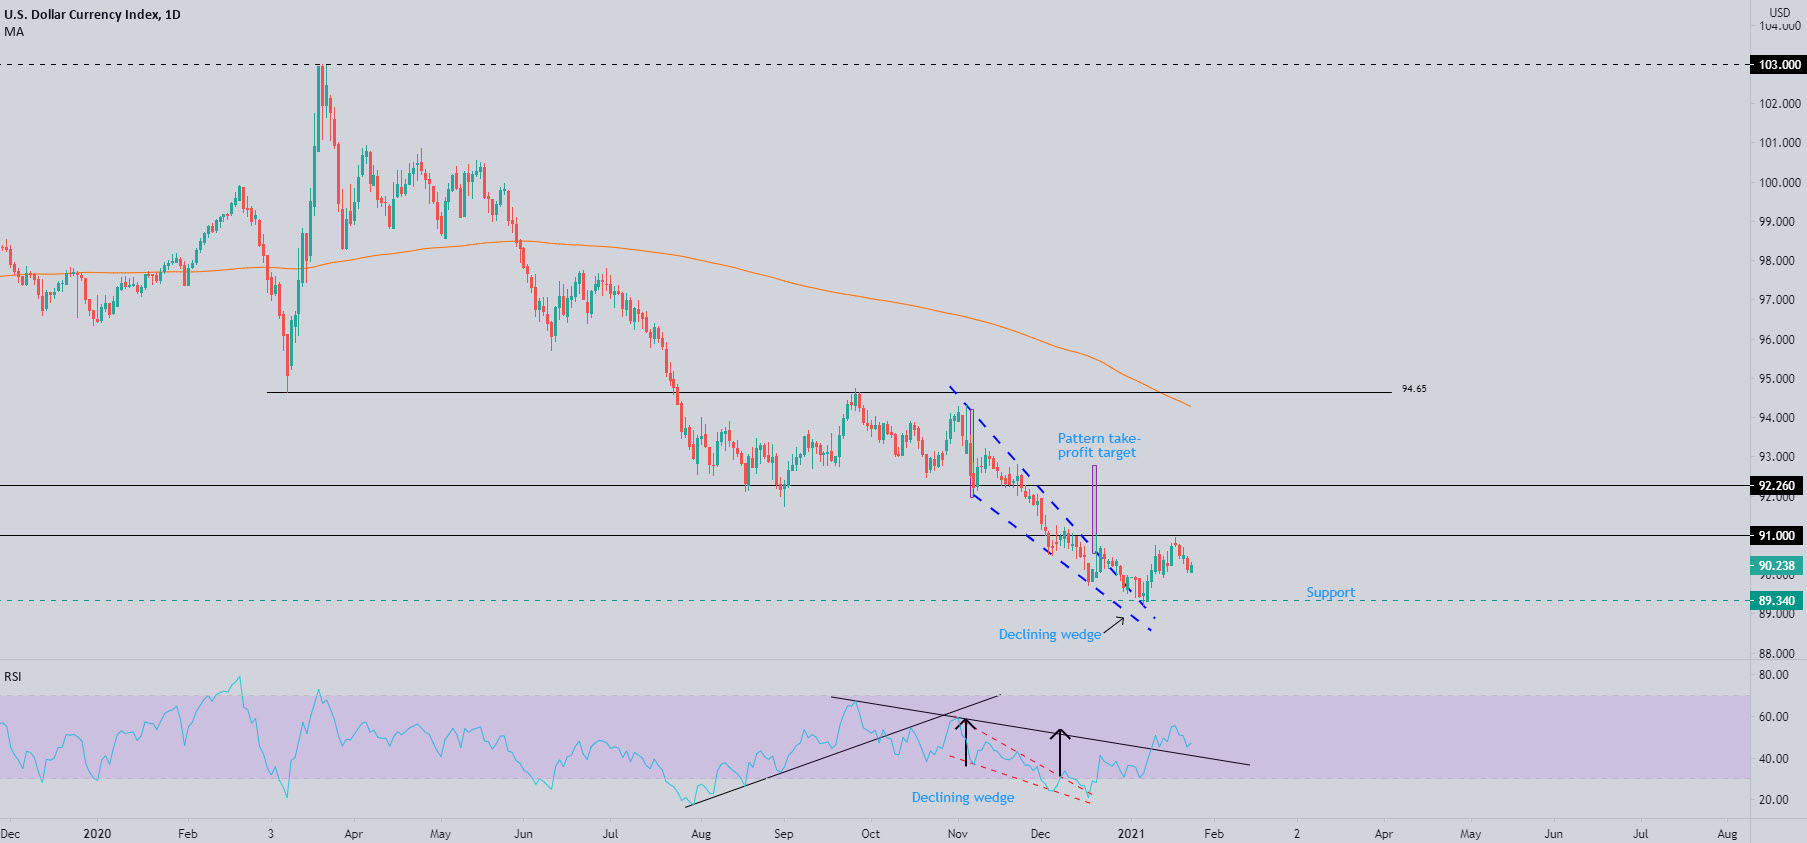
The US dollar index, or more commonly referred to as the DXY, found itself lower by 0.5 percent last week. Within a stone’s throw from the 91.00 level, the DXY snapped a two-week winning streak and introduced the possibility of reconnecting with daily support at 89.34 this week.
Above 91.00, technical studies cast light on daily resistance at 92.26, accompanied by a daily descending wedge (between 94.30 and 92.18) take-profit objective at 92.76 (vertical green boxes).
Organised as a series of lower lows and highs in 2020, the US dollar has been entrenched within a clear downtrend (seen on both weekly and daily charts). Submerging the 88.25 February 16 low (2018) may help further validate the current bearish narrative.
What’s also technically relevant is the daily RSI indicator came into contact with its descending wedge target (black arrows) in early trading last week. Momentum, as you can see, has since contracted, consequently moving trendline support (previous resistance) in the crosshairs this week.
EUR/USD:
Monthly timeframe:
(Technical change on this timeframe is often limited though serves as guidance to potential longer-term moves)
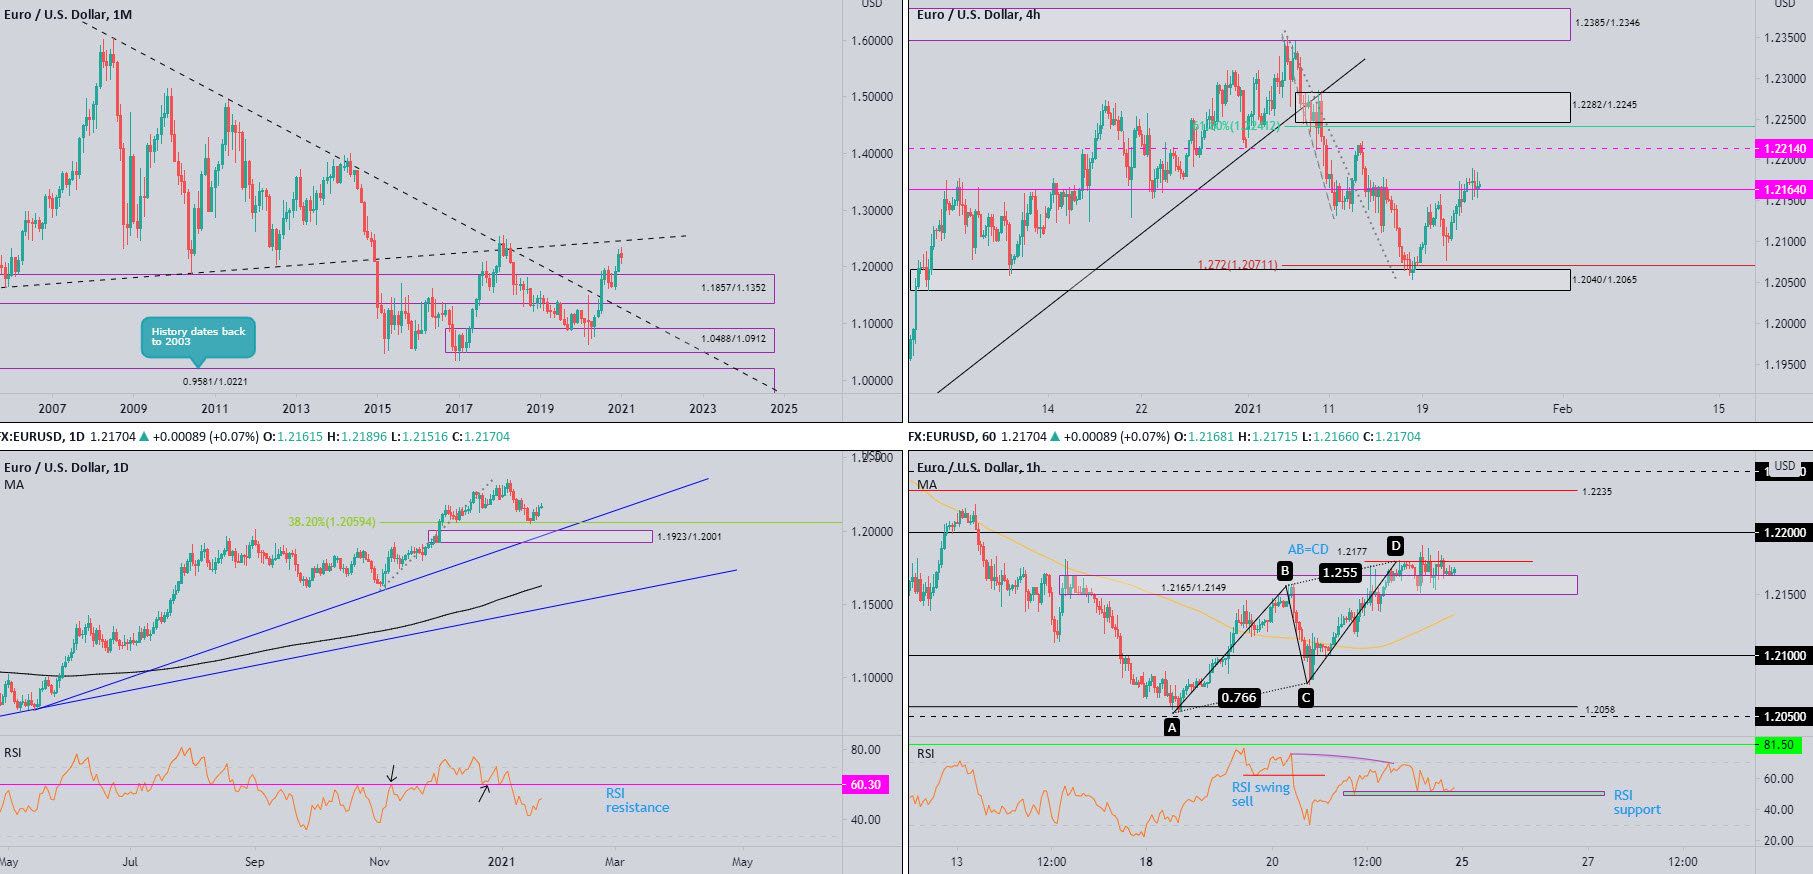
Following the break of long-term trendline resistance (1.6038) in July, and subsequent break of supply at 1.1857/1.1352 in August, EUR/USD, by way of two back-to-back bullish candles, welcomed 2021 in good health.
This—despite January’s modest 0.4 percent slide—reasons additional upside towards ascending resistance (prior support – 1.1641) may eventually be on the horizon.
The primary uptrend has been in play since price broke the 1.1714 high (Aug 2015) in July 2017.
Daily timeframe:
Seated ahead of demand at 1.1923/1.2001 (an area complemented by trendline support [1.0774]), price action warmed to a 38.2% Fib level at 1.2059 last week, aided by a broadly softer USD.
Sustained buying invites the possibility of retesting 2021 tops at 1.2349 this week.
Interestingly, the RSI value also ended marginally above the 50.00 centreline on Friday and shifted focus towards resistance at 60.30.
H4 timeframe:
Resistance at 1.2164 failed to perform heading into the latter part of last week, with the level serving as support on Friday.
Resistance from 1.2214 is lying in wait above 1.2164 this week, sheltered under supply coming in from 1.2282/1.2245. Fib fans will also note the 61.8% Fib level inhabits territory just under the aforesaid supply at 1.2241.
Demand at 1.2040/1.2065 (accompanied by a 127.2% Fib projection at 1.2071) also deserves a shout out, given the area holds the 38.2% Fib level at 1.2059 on the daily timeframe.
H1 timeframe:
As you can see from the H1 chart, volatility diminished considerably on Friday, limited by AB=CD resistance at 1.2177 and demand at 1.2165/1.2149 (prior supply). External levels to be mindful of early this week are the 100-period simple moving average and the 1.22 level.
Also of technical relevance is RSI support around the 50.00 centreline.
Observed levels:
Longer term:
Monthly price calling for higher levels, in a market trending north since 2020, implies daily buyers could extend recovery gains this week.
If sellers should make a show, daily demand at 1.1923/1.2001 and trendline support (1.0774) could occupy the headlines.
Shorter term:
H4 support at 1.2164 taking ownership on Friday calls attention to 1.2214 H4 resistance. This, of course, places a question mark on H1 AB=CD resistance at 1.2177, and shines light on 1.22.
1.2214/1.22, therefore, may be an area short-term buyers target in early trading this week, with a break unmasking H1 resistance at 1.2235.
AUD/USD:
Monthly timeframe:
(Technical change on this timeframe is often limited though serves as guidance to potential longer-term moves)
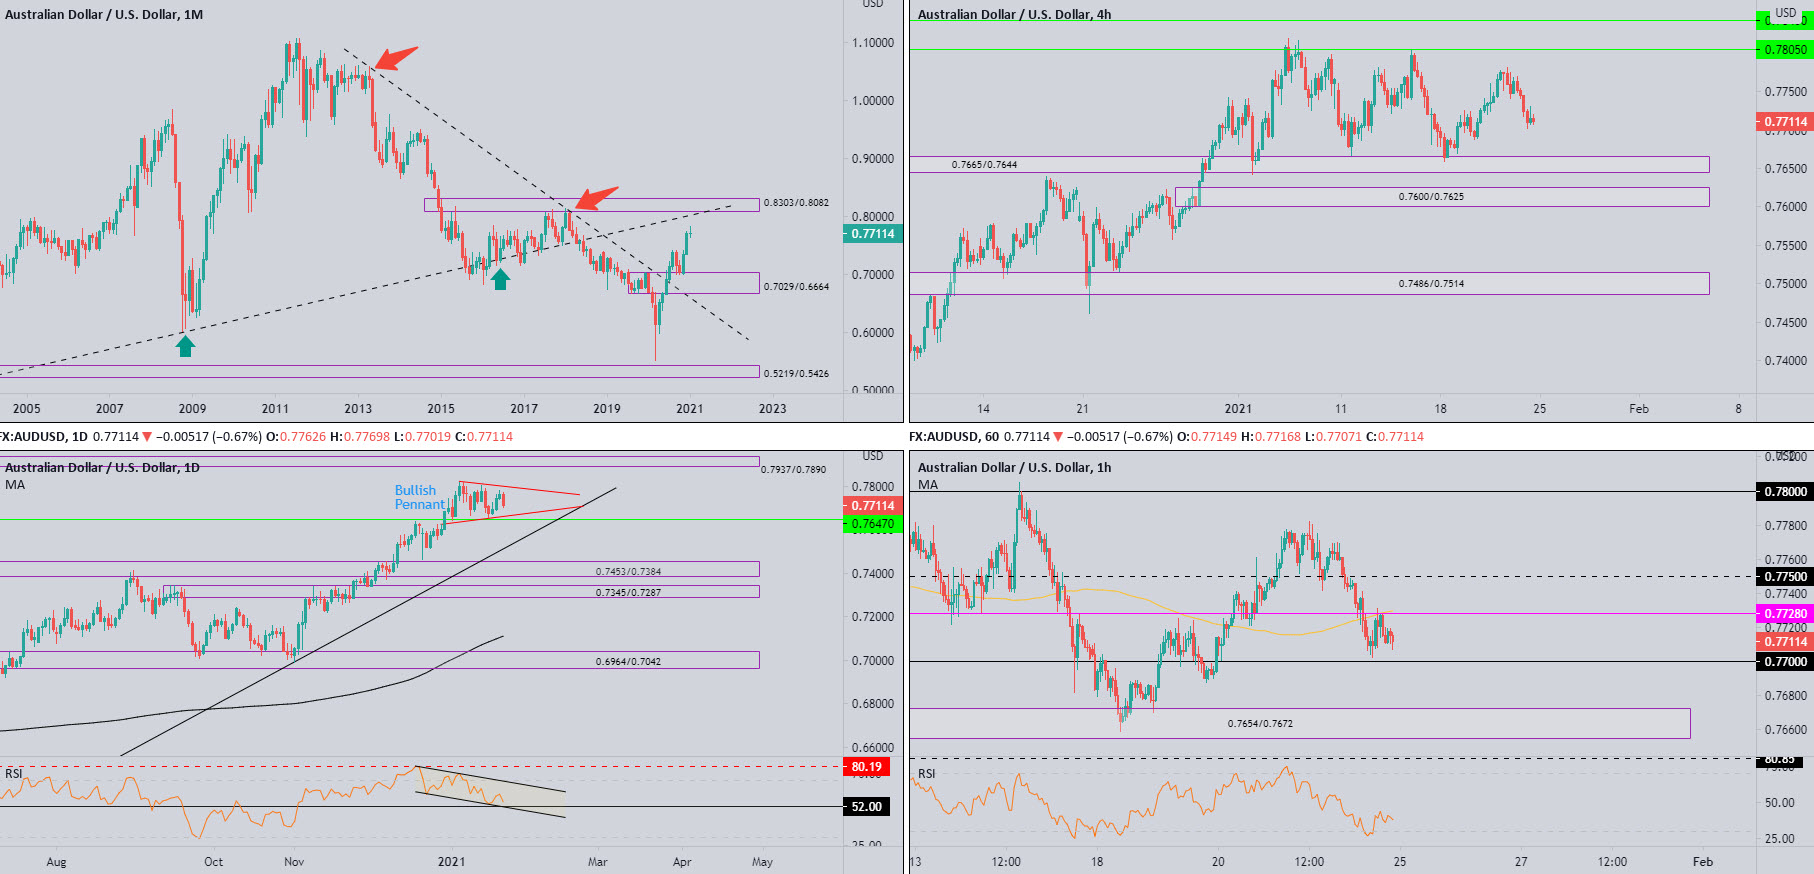
Following two spirited months of gains off demand at 0.7029/0.6664 (prior supply), early 2021, despite fading session peaks, shines light on a possible continuation higher to 0.8303/0.8082—a supply zone aligning closely with trendline resistance (prior support – 0.4776).
In terms of trend, the primary downtrend (since mid-2011) remains south until breaking 0.8135 (January high [2018]).
Daily timeframe:
Partly modified from previous analysis –
Recent developments show a bullish pennant pattern establishing a foothold, formed between the 2021 high at 0.7820 and January 4 low at 0.7642.
Technicians will also note the aforesaid pattern balances off support at 0.7647, with supply at 0.7937/0.7890 to perhaps make an arrival in the event a breakout higher develops.
Out of the RSI indicator, the value remains entrenched within a descending channel. Support is seen at 52.00, while resistance is set around 80.19.
H4 timeframe:
The daily timeframe’s bullish pennant pattern, according to the H4 chart’s technical framework, is forming between demand at 0.7665/0.7644 (prior supply) and resistance at 0.7805.
Outside areas to be conscious of this week are resistance at 0.7843 and demand at 0.7600/0.7625—an area of particular importance due to it being within this zone a decision was made to breach 0.7639 (December 17 high).
H1 timeframe:
Stimulated by a modestly healthy USD and risk sentiment taking a hit, Friday watched AUD/USD snap a three-day winning streak and retest resistance at 0.7728, a level accompanied by the 100-period simple moving average.
0.77 represents immediate support, yet rupturing the psychological level elbows demand at 0.7654/0.7672 in view (fastened to the upper side of H4 demand at 0.7665/0.7644).
With reference to the RSI indicator, the line recovered from oversold space Friday and finished the week slightly correcting ahead of 50.00 to 35.00.
Observed levels:
Longer term:
From monthly and daily charts, traders are, according to the technical drawings presented here, gifted with a bullish outlook. The monthly timeframe displays scope to climb, while the daily timeframe forms a well-known bullish pattern.
Shorter term:
In attempt to remain aligned with a higher timeframe perspective, the 0.77 level and demand at 0.7654/0.7672 are areas buyers could be drawn to this week on the H1 chart.
H4 demand at 0.7665/0.7644 may also be included on the watchlist, blending with daily support at 0.7647.
USD/JPY:
Monthly timeframe:
(Technical change on this timeframe is often limited though serves as guidance to potential longer-term moves)
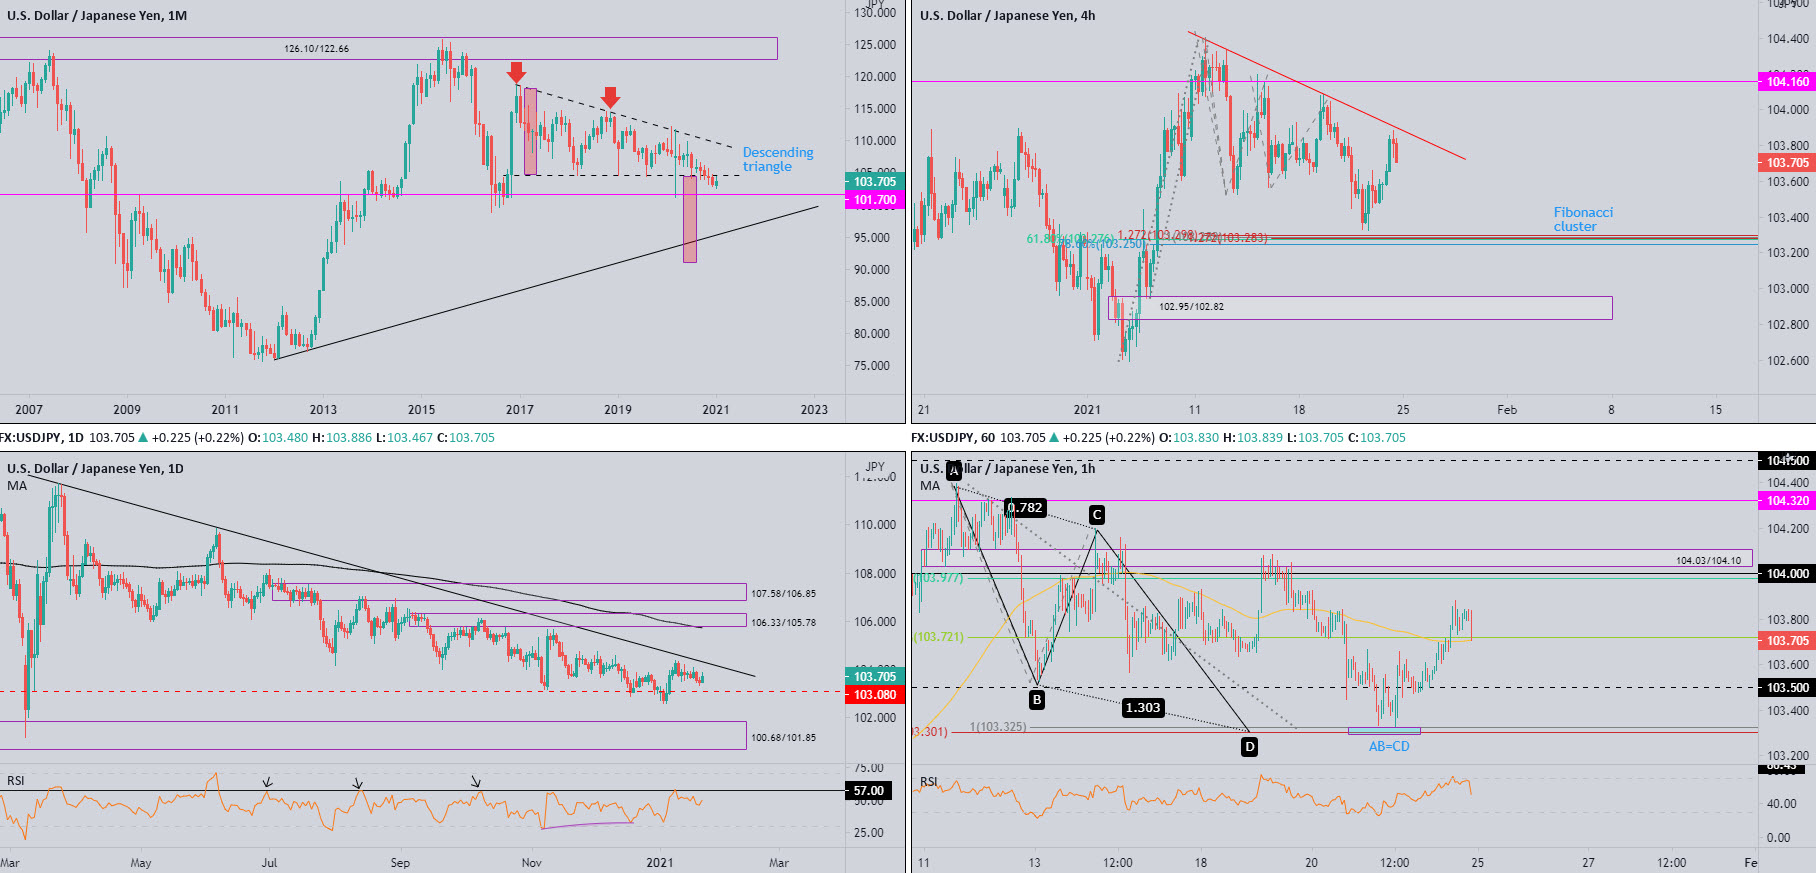
Over the span of four years, USD/JPY carved out a descending triangle pattern between 118.66/104.62.
Although December pursued terrain south of 104.62, January has so far attempted a comeback and is within relatively close range of retesting 104.62.
104.62 ceding ground throws light on support from 101.70, with a break here uncovering trendline support (76.15) and the descending triangle’s take-profit objective at 91.04 (red).
Daily timeframe:
Partly modified from previous analysis –
Overall, buyers and sellers remain squaring off between trendline resistance (111.71) and 103.08 support.
Beyond the aforesaid areas, demand at 100.68/101.85 is visible (encases monthly support at 101.70) and supply can be found at 106.33/105.78 (the 200-day simple moving average circles the lower side of the supply).
Also prominent is the RSI indicator crossing paths with resistance at 57.00, a level hindering upside since July 2020.
H4 timeframe:
Overhead, a local trendline resistance (104.39) is seen on the H4 chart, while downstream Fib enthusiasts will note a Fib cluster around 103.28 (this simply represents a collection of Fibonacci levels formed around a specific price level).
Clearance of 103.28 unlocks the risk of further declines, targeting daily support at 103.08, followed by H4 demand at 102.95/102.82 (prior supply).
H1 timeframe:
Following an early 103.50 retest on Friday, short-term price action made its way above the 38.2% Fib level at 103.72 and 100-period simple moving average. The 38.2% Fib is commonly recognised as an initial take-profit objective out of AB=CD patterns, which we saw form last Thursday around 103.32.
The mild end-of-day correction, however, ended with price movement retesting the 100-period simple moving average and 38.2% Fib combination. Holding here promotes the possibility of reaching the 61.8% Fib level at 103.97 (considered the second take-profit objective out of the AB=CD pattern), alongside the 104 level and supply taken at 104.03/104.10.
With respect to the RSI indicator, the value fell sharply from overbought status Friday, leaning on the 50.00 centreline going into the close.
Observed levels:
Longer term:
104.62 resistance on the monthly timeframe may be watched this week (the lower side of the descending triangle pattern).
The daily support at 103.08 and nearby daily trendline resistance are also likely on the radar for many traders going forward.
Shorter term:
The H1 timeframe displays interesting supply at 104.03/104.10, blending with the 104 level and a 61.8% Fib level at 103.97. Though to reach this area, H4 trendline resistance must be conquered.
The H4 Fib cluster around 103.28 is perhaps appealing to Fib fans this week, yet to reach here price must pierce the H1 AB=CD support at 103.32.
GBP/USD:
Monthly timeframe:
(Technical change on this timeframe is often limited though serves as guidance to potential longer-term moves)
December’s 2.5 percent extension elevated GBP/USD and stirred trendline resistance (2.1161).
January, as you can see, currently trades off session lows and recorded fresh 2021 highs (up by 0.1 percent).
In terms of trend, the primary trend has faced lower since early 2008, unbroken (as of current price) until 1.4376 gives way – April high, 2018. In effect, the aforesaid high represents the next upside objective on the monthly chart.
Daily timeframe:
Partly modified from previous analysis –
Buyers stepped back Friday after Thursday refreshed 2021 tops at 1.3745, trimming a three-day winning streak ahead of resistance at 1.3755.
GBP/USD has favoured an upside bias since early 2020, therefore breaching 1.3755 is possibly on the cards this week, with supply at 1.3996/1.3918 targeted.
The RSI indicator has revealed a rangebound environment since November, limited by support around 47.00 and resistance at the 66.00 region.
H4 timeframe:
Demand at 1.3618/1.3637 resurfaced on Friday, after failing to find grip above resistance at 1.3711 (positioned beneath another resistance at 1.3763 and nearby supply at 1.3837/1.3800).
In light of last Wednesday’s 1.3618/1.3637 test perhaps consuming the majority of buyers, Friday’s recovery may fail to attract bullish flow in early movement this week. Demand at 1.3502/1.3536, therefore, could be worth making a note of.
H1 timeframe:
The 100-period simple moving average made a stand on Friday around 1.3650 and waved in modest buying.
The 1.37 level remains unopposed, with price sculpting a shooting star candle ahead of the level going into the close. Stripping the 100-period SMA this week brings light to a possible 1.36 test, seated just under H4 demand at 1.3618/1.3637.
Also of technical interest is the RSI indicator forming a descending wedge. The value currently stands just under the 50.00 centreline, at 44.32.
Observed levels:
Longer term:
Although the monthly timeframe shows buyers have room to move higher, the daily timeframe’s resistance at 1.3755 may dampen bullish commitment this week.
Shorter term:
The 100-period simple moving average on the H1 offers immediate support. A break points to 1.36 support—plotted under H4 demand at 1.3618/1.3637.
H1 price taking on 1.37, on the other hand, places buyers in a good position to attempt to overrun H4 resistance again at 1.3711.

DISCLAIMER: The information contained in this material is intended for general advice only. It does not take into account your investment objectives, financial situation or particular needs. FP Markets has made every effort to ensure the accuracy of the information as at the date of publication. FP Markets does not give any warranty or representation as to the material. Examples included in this material are for illustrative purposes only. To the extent permitted by law, FP Markets and its employees shall not be liable for any loss or damage arising in any way (including by way of negligence) from or in connection with any information provided in or omitted from this material. Features of the FP Markets products including applicable fees and charges are outlined in the Product Disclosure Statements available from FP Markets website, www.fpmarkets.com and should be considered before deciding to deal in those products. Derivatives can be risky; losses can exceed your initial payment. FP Markets recommends that you seek independent advice. First Prudential Markets Pty Ltd trading as FP Markets ABN 16 112 600 281, Australian Financial Services License Number 286354.


 Access +10,000 financial
instruments
Access +10,000 financial
instruments