
US Dollar Index:
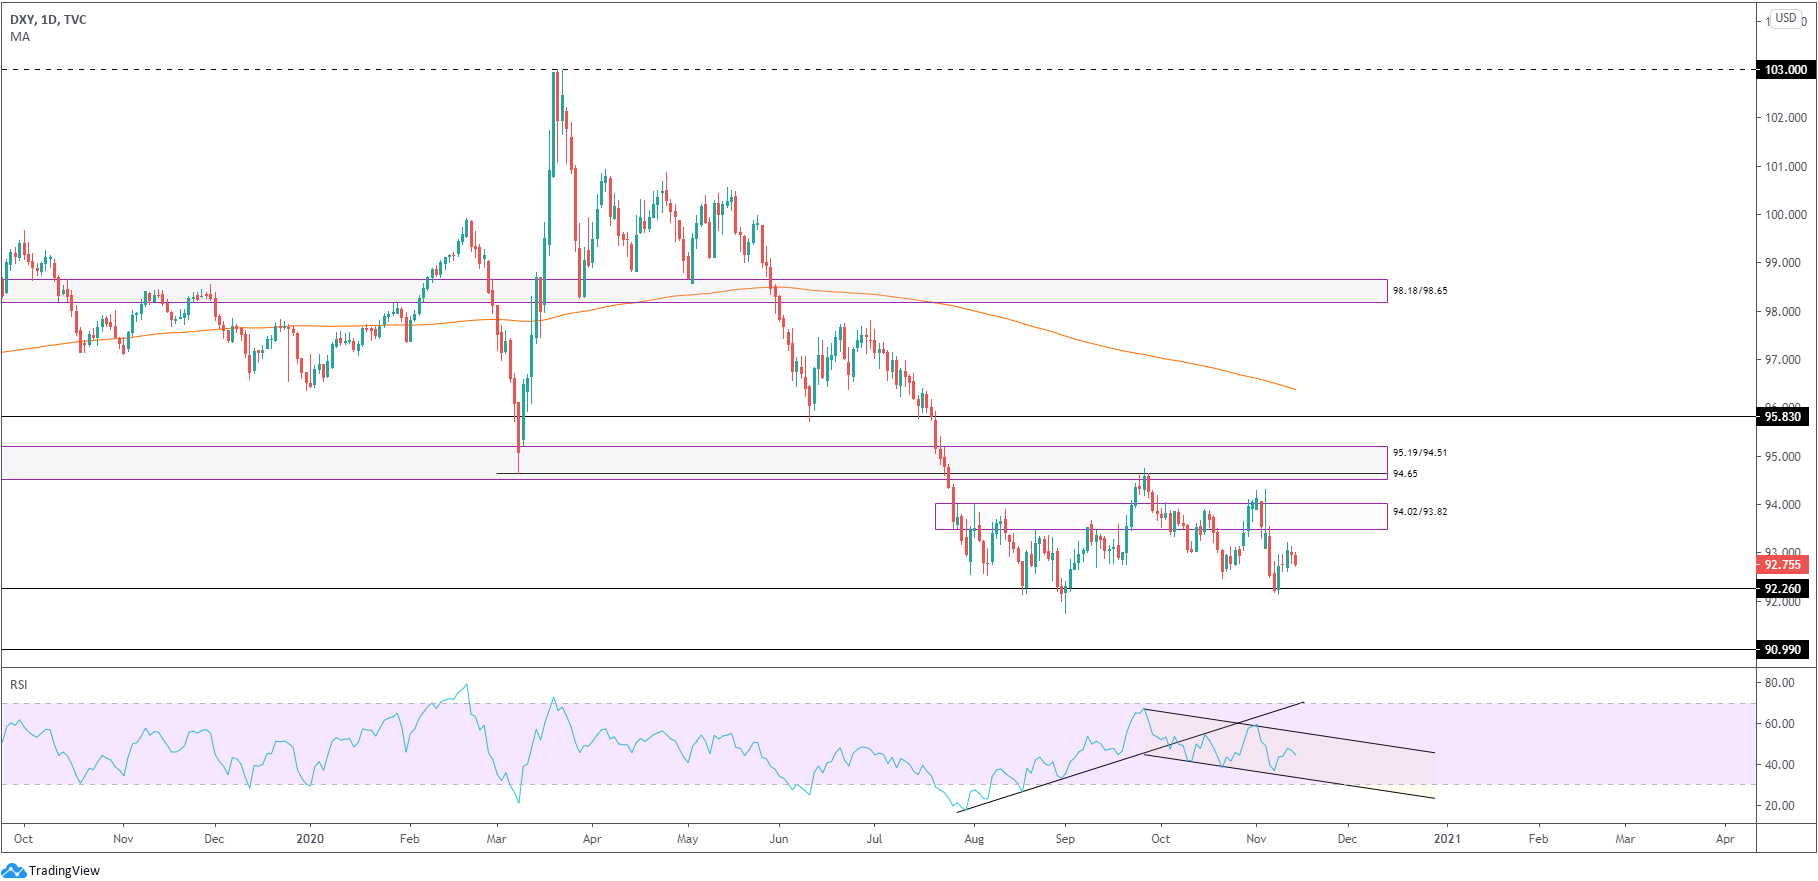
Dollar bulls, according to the US dollar index (DXY), mounted a modest comeback over the course of last week and added 0.6 percent. Although reclaiming a portion of the previous week’s 2 percent slump, the broader picture reveals November remains on the backfoot, down by 1.4 percent.
Daily support at 92.26, as you can see, aided buyers in the early stages of the week. Momentum, however, somewhat soured into the latter half of the session, assembling a daily bearish harami that unleashed sellers Friday. Although suggesting a 92.26 revisit could be on the cards, daily supply forged between 94.02/93.82 is also in the spotlight this week, together with bordering daily supply found at 95.19/94.51 and 94.65 resistance.
The primary trend on the monthly timeframe, since March 2008, has been entrenched within a large-scale pullback, though since 2017 has found resistance off 103. Additionally, the daily timeframe (off highs at 102.99) has moulded a series of lower highs and lower lows from March 2020. We also recognise price crossed under the 200-day simple moving average, currently circling 96.37, heading into June of this year.
Traders with a focus on momentum-based indicators will also note the daily RSI oscillator penetrated trendline support at the beginning of October and is establishing a descending channel. The value also finished last week marginally under 50.00.
EUR/USD:
Monthly timeframe:
(Technical change on this timeframe is often limited though serves as guidance to potential longer-term moves)
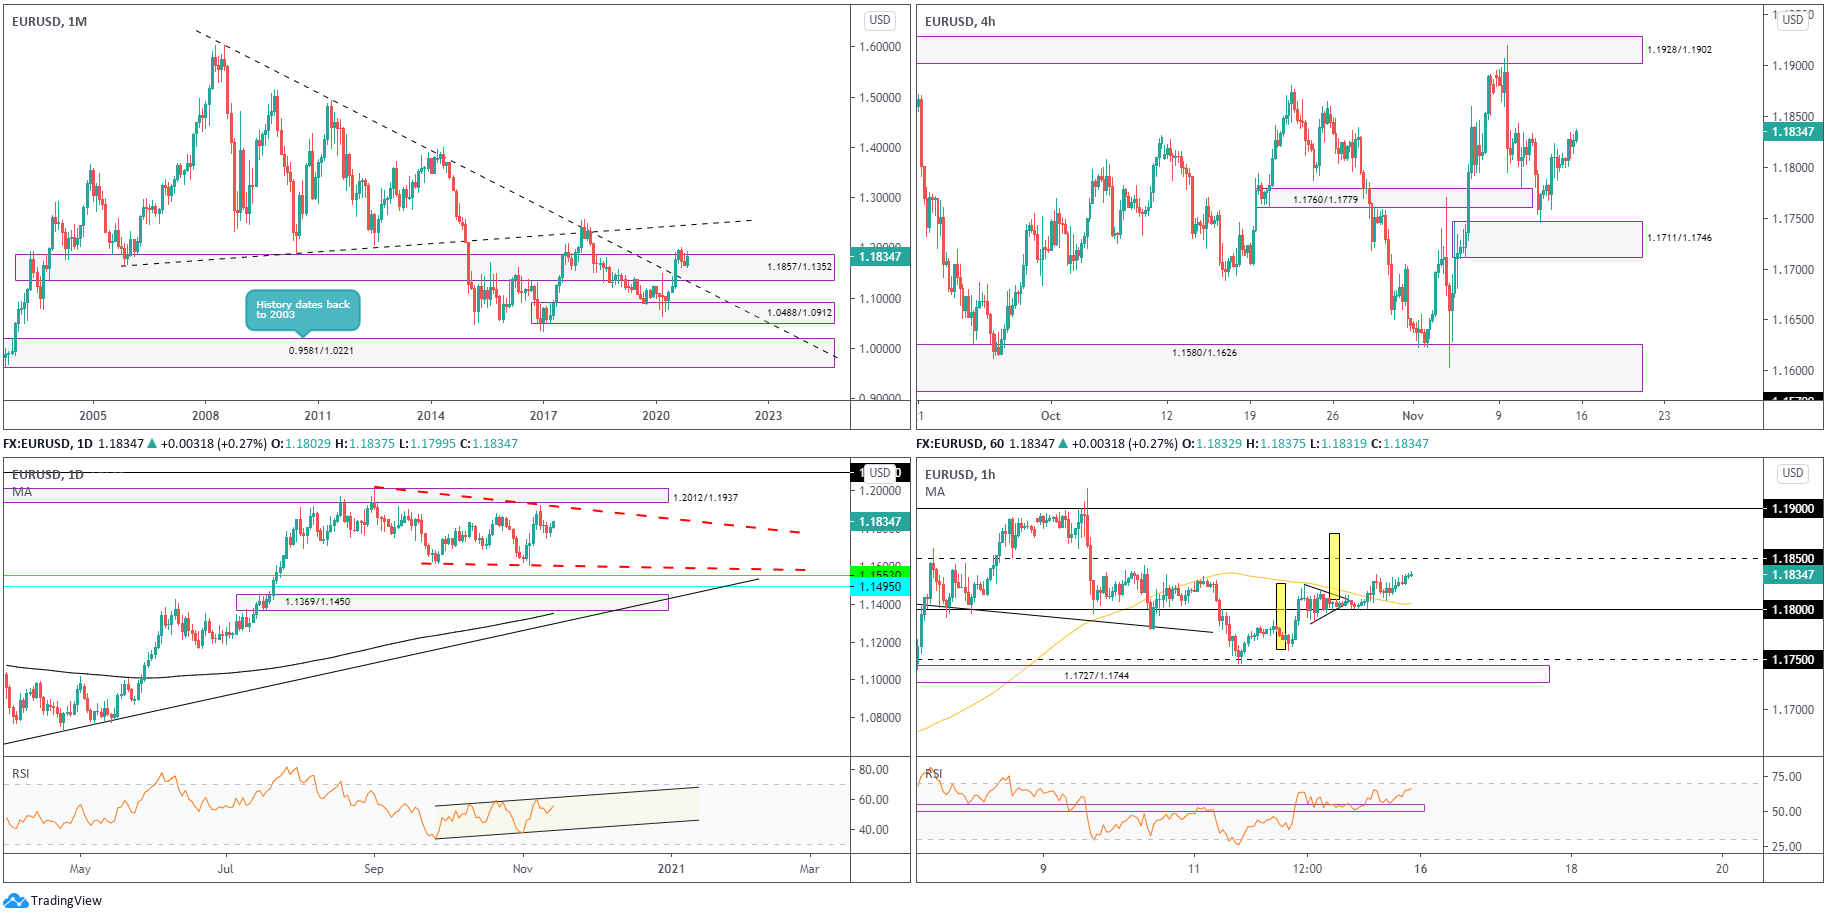
Following the break of long-term trendline resistance (1.6038) in July, buyers and sellers have since squared off around the upper section of supply from 1.1857/1.1352. Though this argues additional upside may be on the horizon, targeting ascending resistance (prior support – 1.1641), a dip to retest the recently penetrated trendline resistance (support) is also still on the table.
The primary downtrend (since July 2008) remains intact until 1.4940 is engulfed (May 2 high [2011]).
Daily timeframe:
Supply at 1.2012/1.1937 remains a key zone to be mindful of on the daily chart, active since May 2018. Another interesting feature to be aware of is a possible falling wedge pattern between 1.2011 and 1.1612. Yet, do be aware that some traders could also interpret this arrangement as a descending triangle pattern.
In terms of support beyond the aforesaid pattern, 1.1553 and 1.1495 offer prominent levels.
RSI fans will also note the value modestly rotated higher above 50.00 by the week’s end, and remains entrenched within an ascending channel.
H4 timeframe:
Mid-week trading, as you can see, welcomed demand at 1.1711/1.1746 into the fight, inspiring a reasonably motivated recovery in the second half of the week.
Although there’s some wood to chop through around the 1.1830 region, buyers long this market likely have their eye on supply from 1.1928/1.1902 (prior demand).
H1 timeframe:
Thursday, specifically the US session, witnessed a drop in volatility, establishing a tight bullish pennant pattern off 1.18 support. RSI enthusiasts may also recall the value was, at the time, retesting a support area between 50.92/55.21.
Heading into the early hours of Friday’s session, traders will note a push out of the bullish pennant pattern materialised and subsequently toppled (and retested) the nearby 100-period simple moving average at 1.1805. Buyers long the pennant breakout perhaps have 1.1850 resistance on the watchlist this week, with follow-through buying to shine light on the pennant pattern’s take-profit area at 1.1875.
Observed levels:
Long term:
Monthly price could spin either way, following the breach of supply at 1.1857/1.1352.
Daily price is in the process of chalking up what appears to be a rather large falling wedge pattern, on a timeframe that’s mostly trended higher since early 2020.
Short term:
The H1 bullish pennant pattern breakout, in addition to H4 price poised to perhaps climb higher this week, could see buyers reach 1.1850 resistance on the H1 and ultimately complete the H1 pennant formation. However, there is also a chance intraday buying may continue until crossing paths with the 1.19 level on the H1, a round number that aligns with the lower side of H4 supply at 1.1928/1.1902 (prior demand).
AUD/USD:
Monthly timeframe:
(Technical change on this timeframe is often limited though serves as guidance to potential longer-term moves)
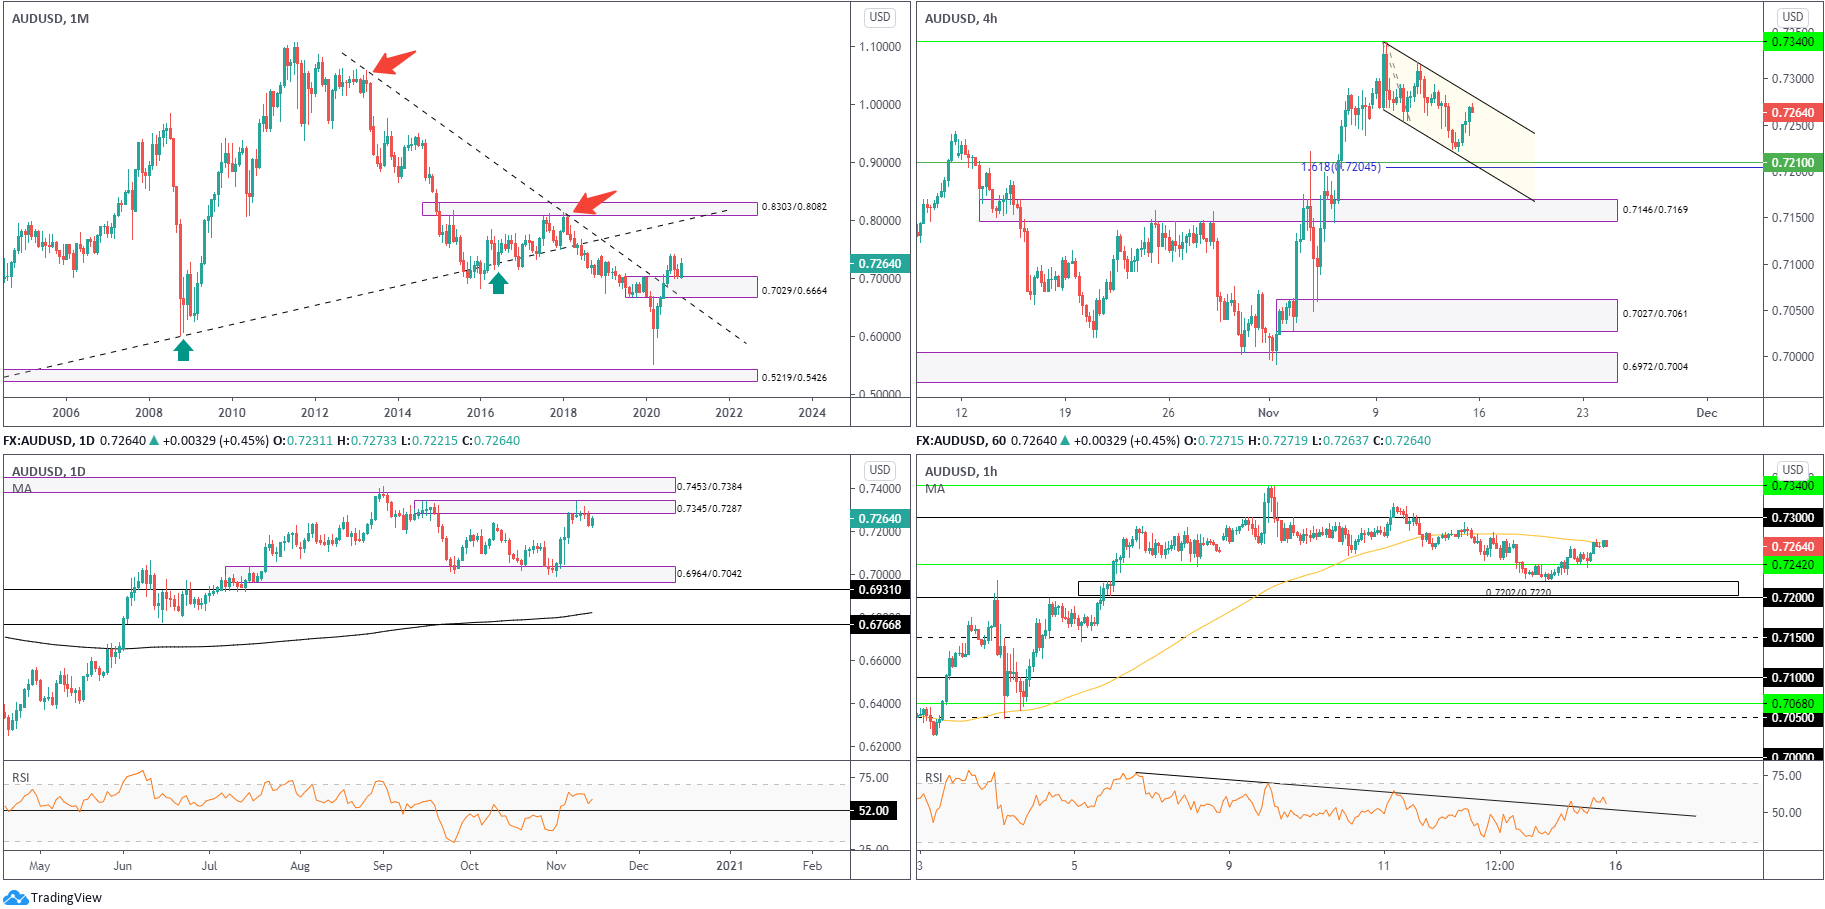
The months of September and October, as you can see, developed a mild correction and addressed the upper border of demand at 0.7029/0.6664 (prior supply). Buyers have so far responded well from the demand (up by 3.4 percent in November), free to explore as far north as 0.8303/0.8082 in the coming months, a supply zone aligning closely with trendline resistance (prior support – 0.4776).
In terms of trend, though, the primary downtrend (since mid-2011) remains south until breaking 0.8135 (January high [2018]).
Daily timeframe:
Sellers attempted to re-establish some control out of supply at 0.7345/0.7287 (a rally-base-drop formation) on Thursday, yet was short-lived as Friday sealed a near-0.5 percent advance. Supply at 0.7453/0.7384, extended from August 2018, therefore could be thrown in the mix this week assuming buyers remain at the helm.
Demand fixed from 0.6964/0.7042 also still represents a reasonable target if sellers make an entrance.
The RSI indicator is also seen correcting ahead of overbought levels, poised to retest 52.00 support.
H4 timeframe:
Forged within a descending channel pattern (0.7340/0.7252) off 0.7340 resistance, last week established a bearish presence.
This unmasks support at 0.7210 and a 161.8% Fib projection level at 0.7204. Subsequent selling may also bring light to demand at 0.7146/0.7169.
H1 timeframe:
Early trading Friday delivered a bottom ahead of demand at 0.7202/0.7220, seated a few pips north of the 0.72 level. Consequently, buyers voyaged above resistance at 0.7242 and retested the latter by way of support heading into the US session, ending the day challenging the 100-period simple moving average around 0.7268.
Additional interest to the upside this week manoeuvres the 0.73 level into the light, with a break unearthing H4 resistance at 0.7340.
It might also interest some readers to note the RSI oscillator penetrated trendline resistance, with follow-through momentum to perhaps draw towards overbought space.
Observed levels:
Long term:
Sellers from daily supply at 0.7345/0.7287 continue to protest against monthly price rebounding from demand at 0.7029/0.6664. Though it will take some effort from sellers to reach the next downside target on the daily timeframe: demand at 0.6964/0.7042, an area glued to the upper edge of the aforesaid monthly demand.
Short term:
A breakout above the H4 channel formation this week may help confirm bullish interest from the monthly timeframe, and suggest a break of daily supply at 0.7345/0.7287. A H4 channel break, therefore, may stir buyers.
The H1 is currently engaging with its 100-period simple moving average. If a break comes to pass, this may indicate we’re heading for the 0.73 level, which happens to be located above H4 channel resistance.
USD/JPY:
Monthly timeframe:
(Technical change on this timeframe is often limited though serves as guidance to potential longer-term moves)
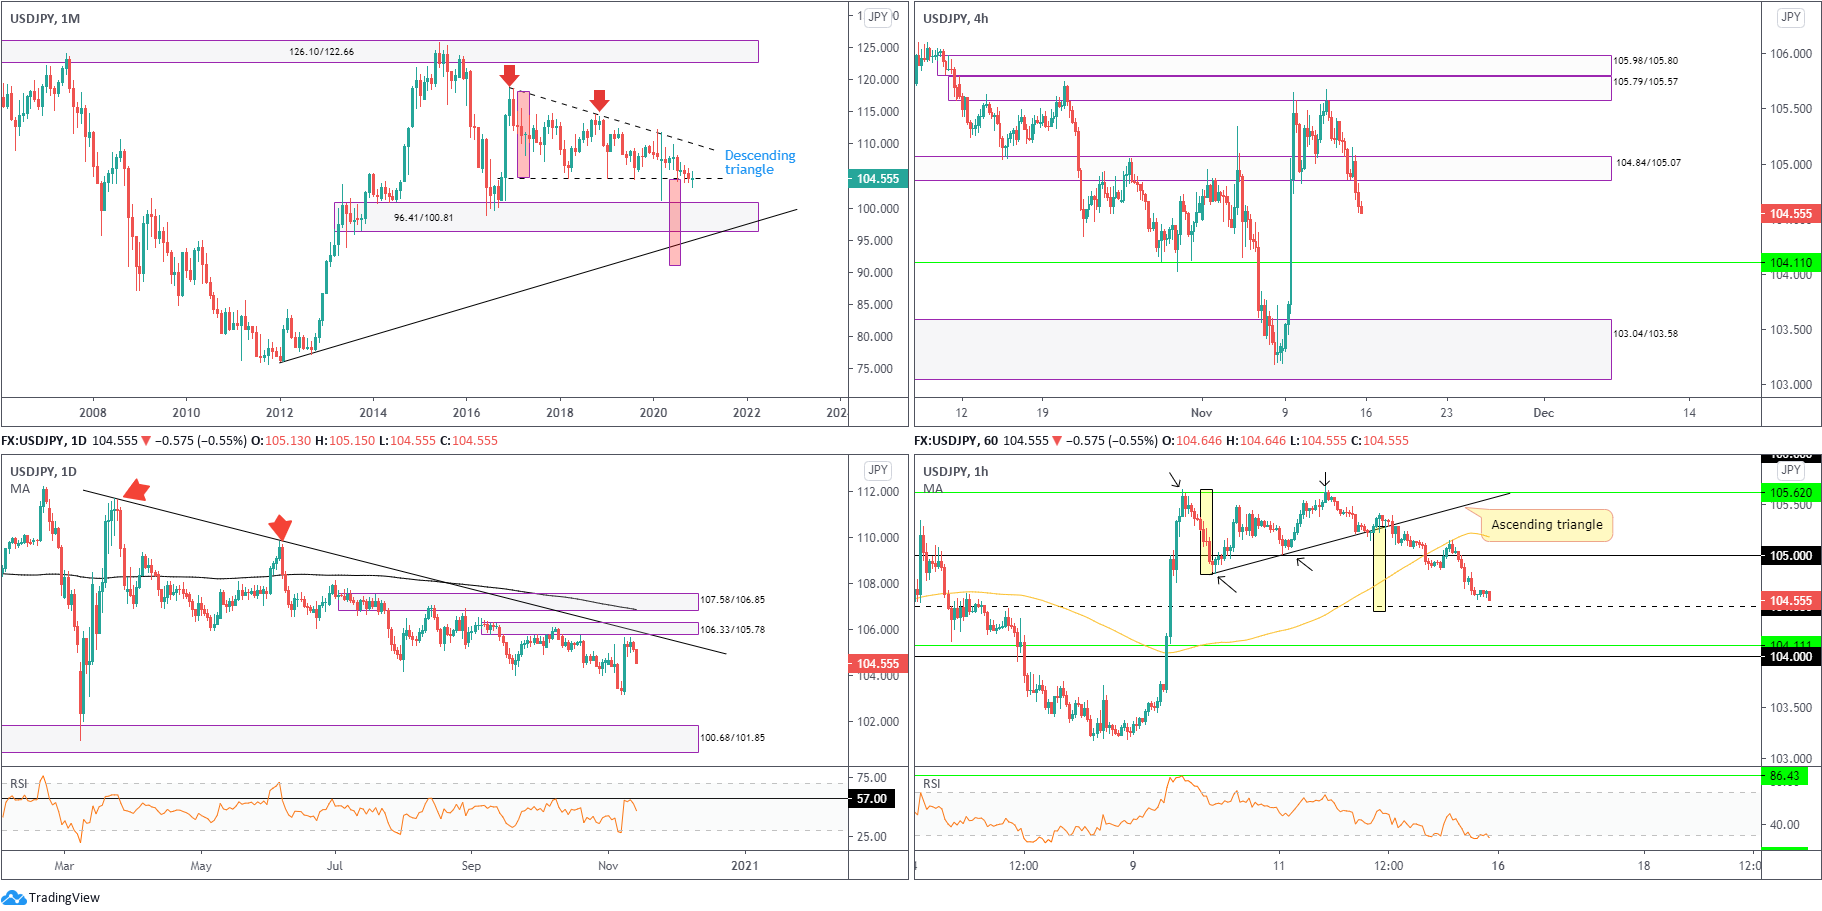
Since kicking off 2017, USD/JPY has been carving out a descending triangle pattern between 118.66/104.62.
November, albeit unmoved (indecisive) at current price, is seen hugging the lower edge of the aforesaid pattern.
104.62 ceding ground shines light on demand from 96.41/100.81, followed by trendline support (76.15) and the descending triangle’s take-profit level at 91.04 (red).
Daily timeframe:
Leaving behind supply from 106.33/105.78, and intersecting trendline resistance (111.68), as well as RSI resistance at 57.00, sellers made a strong show heading into the final stages of the week, finishing at session lows Friday.
Downside risk remains this week, according to the daily chart, throwing light on 103.17 lows (November 6), with a break uncovering demand at 100.68/101.85, drawn from September 2016.
H4 timeframe:
Demand at 104.84/105.07 succumbed to Friday’s bearish impulse, absorbing enough bids to perhaps clear room for an approach to support at 104.11 and maybe even familiar demand (taken from March 2020) at 103.04/103.58.
H1 timeframe:
Partly modified from previous analysis –
Since last week kicked off, the arrangement of price action on the H1 shaped an ascending triangle pattern (105.64/104.82). According to some, this formation is considered a continuation pattern; others, however, have noted resistance can sometimes prove too strong and form a reversal pattern. In this case, it appears the ascending triangle fashioned a reversal signal, with a target set around 104.50 support (yellow) which was nearly met Friday after removing 105 support.
H4 support beyond 105 is seen at 104.11, positioned ahead of the 104 level.
In addition to the above, the RSI oscillator continues to cling to oversold levels.
Observed levels:
Long term:
Price action, based on the monthly timeframe, remains around descending triangle support at 104.62. However, given the lacklustre effort from buyers, due to daily price shifting lower south of supply at 106.33/105.78, and intersecting trendline resistance (111.68), sellers could take control this week.
Short term:
Sellers short the break of the H1 ascending triangle likely target 104.50, with some maybe also lasering in on H4 support at 104.11 and the 104 level on the H1. An intraday bearish scene sub 104.50 (H1), therefore, could also form with 104.11/104 targeted.
GBP/USD:
Monthly timeframe:
(Technical change on this timeframe is often limited though serves as guidance to potential longer-term moves)
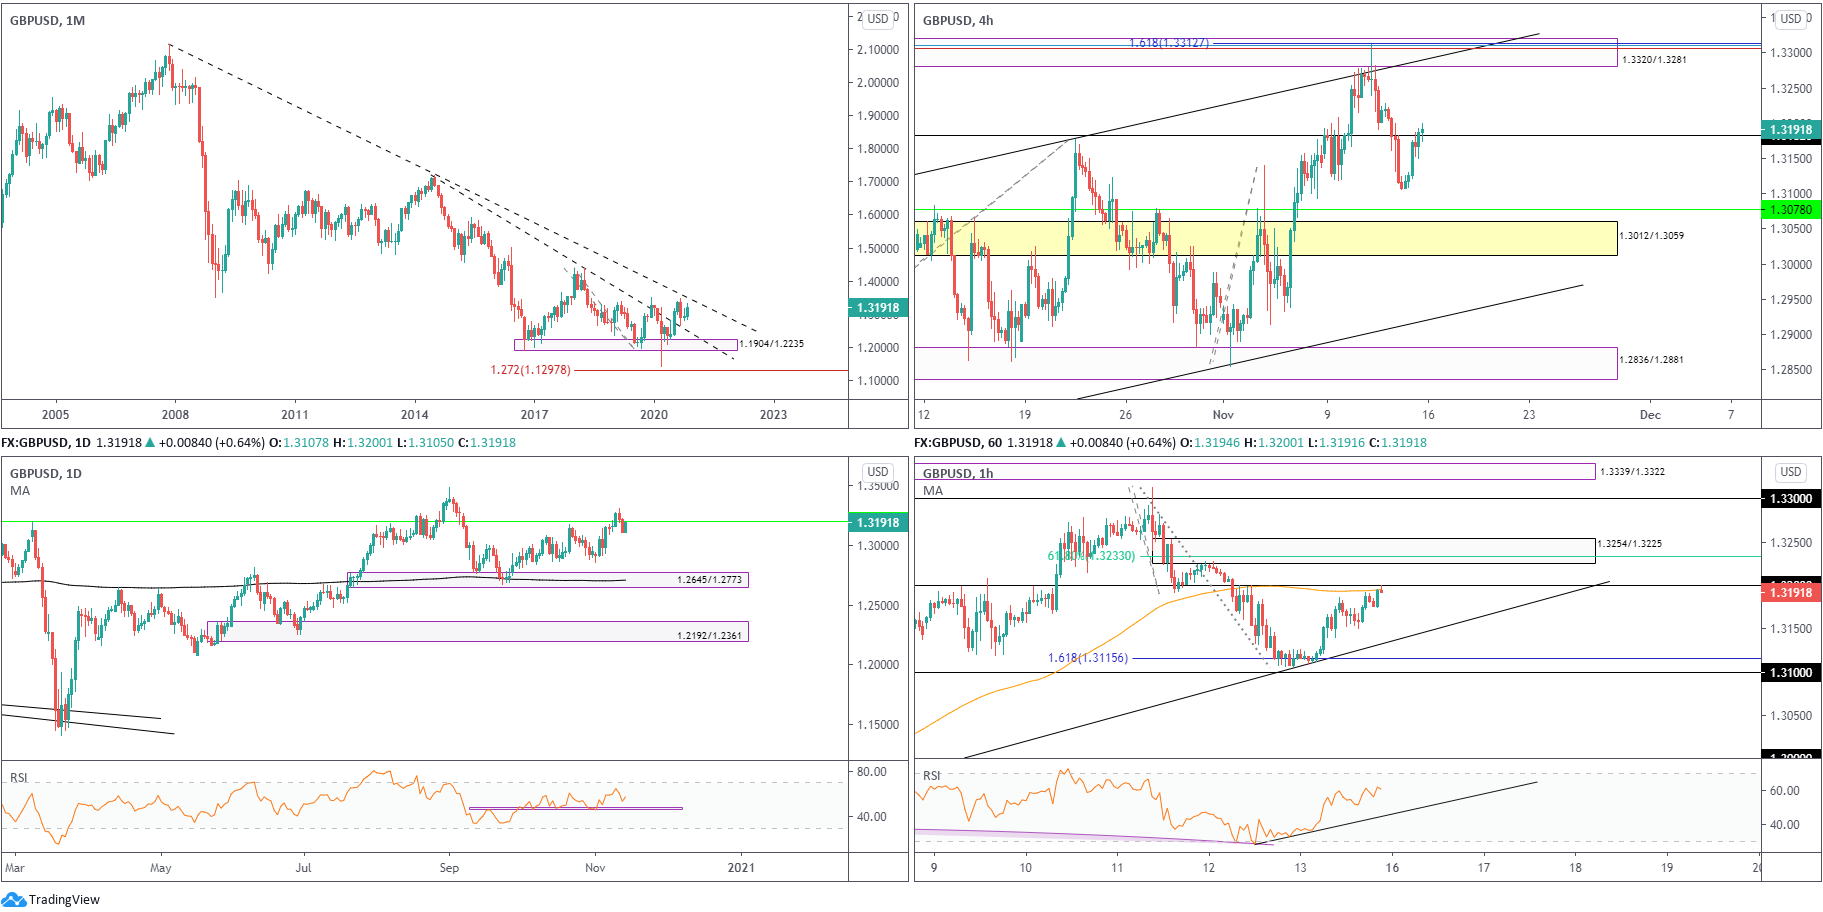
Leaving trendline resistance (2.1161) unopposed, the month of September fell 3.4 percent by way of a bearish outside reversal candle and snapped a three-month winning streak. This, despite November trading higher by 1.9 percent at the moment, advertises a possible dip to retest trendline support (prior resistance – 1.7191).
In terms of trend, the primary trend has faced lower since early 2008, unbroken (as of current price) until 1.4376 gives way – April 2 high 2018.
Daily timeframe:
Although the daily chart observed a deep fakeout above resistance at 1.3201 last week, half-hearted bearish follow-through movement indicates the run above 1.3201 was to collect stops to perhaps step higher and target the 1.3483 September high.
In case sellers make a show, however, marking 1.2860 bottoms and demand at 1.2645/1.2773 could be an idea.
The RSI oscillator has also turned over ahead of overbought space and appears set to retest support around 48.00.
H4 timeframe:
Failing to address support at 1.3078 (secured just ahead of demand at 1.3012/1.3059), GBP/USD bulls staged a healthy recovery Friday, with enough force to reclaim 1.3182 resistance.
Clearing (and retesting) 1.3182 on Friday may unleash additional buying this week, with channel resistance (1.3176) targeted, intersecting with supply at 1.3320/1.3281 (and a collection of Fib studies around 1.3307).
H1 timeframe:
Wrapping up Thursday’s session witnessed intraday candles greet trendline support (1.2854). Confirmed by RSI hidden bullish divergence, and also aided by additional support from a 161.8% Fib projection level at 1.3115, Friday concluded a few pips off the underside of 1.32 and nearby 100-period simple moving average at 1.3195.
1.3254/1.3225 supply also lies directly above 1.32 and holds a 61.8% Fib level from 1.3233.
With reference to the RSI indicator, the value circled 60.00 on Friday, threatening to cross into overbought conditions.
Observed levels:
Long term:
Lacklustre selling around daily resistance at 1.3201, together with room to run higher on the monthly timeframe, communicates a possible bullish vibe this week, with the 1.3483 September high targeted on the daily chart.
Short term:
Although buyers have made a show above H4 resistance from 1.3182, the fact the 1.32 level on the H1 is active and joined by the 100-period simple moving average, and also daily resistance at 1.3201, could spark bearish interest in early trading this week. With this being said, though, a whipsaw into H1 supply at 1.3254/1.3225 to collect stops above 1.32 could be seen before sellers make a stand.
However, let’s also remember higher timeframe dynamics suggest buyers hold the upper hand. Thus, 1.32 selling (or a sell from H1 supply) could actually be short-lived.
Therefore, overall, we have a bit of a mixed bag in terms of technical elements in this market right now.
DISCLAIMER: The information contained in this material is intended for general advice only. It does not take into account your investment objectives, financial situation or particular needs. FP Markets has made every effort to ensure the accuracy of the information as at the date of publication. FP Markets does not give any warranty or representation as to the material. Examples included in this material are for illustrative purposes only. To the extent permitted by law, FP Markets and its employees shall not be liable for any loss or damage arising in any way (including by way of negligence) from or in connection with any information provided in or omitted from this material. Features of the FP Markets products including applicable fees and charges are outlined in the Product Disclosure Statements available from FP Markets website, www.fpmarkets.com and should be considered before deciding to deal in those products. Derivatives can be risky; losses can exceed your initial payment. FP Markets recommends that you seek independent advice. First Prudential Markets Pty Ltd trading as FP Markets ABN 16 112 600 281, Australian Financial Services License Number 286354.


 Access +10,000 financial
instruments
Access +10,000 financial
instruments