
Charts: TradingView
It was all about US inflation last week, released at 1:30 pm GMT on Thursday.
Softer-than-expected US inflation data unleashed a turbulent trading session. I noted the following shortly after the release (italics):
Consumer prices, measured by the Consumer Prices Index (CPI), increased less than anticipated. According to the Bureau of Labour Statistics (BLS), consumer prices increased 7.7% on a year-over-year basis, following September’s 8.2% increase, representing a fourth decline since topping at 9.1% in June (its largest increase since the early 1980s). Interestingly, this is the first time since February this year that headline year-on-year inflation has been south of the 8.0% mark.
Core annual inflation for October—excluding volatile food and energy prices—rose 6.3%, from 6.6% recorded in September. In terms of the month-over-month data, CPI rose 0.4% in October, identical to September’s reading. Core monthly inflation, however, rose 0.3%, following September’s rise of 0.6%.
In response to the inflation data, major US equity indices staged an impressive rally; the Nasdaq 100, for example, pencilled in a 7.5% run higher, followed by the S&P 500 rallying 5.5%. Procyclical currencies also benefitted. The Australian dollar (see below for the AUD/USD technical outlook) jumped nearly 3.0%, alongside the New Zealand dollar popping 2.4% and the Canadian dollar ending the day 1.6% higher. Haven currencies, as you would expect, experienced a violent sell-off; the US Dollar Index (technical view can be found below) dropped 2.3% and followed through with a further 1.4% fall on Friday.
While it is certainly early days, the tone of the markets suggest that the soft US inflation print may eventually lead to a ‘Fed pivot’. I also noted the following in recent analysis (italics):
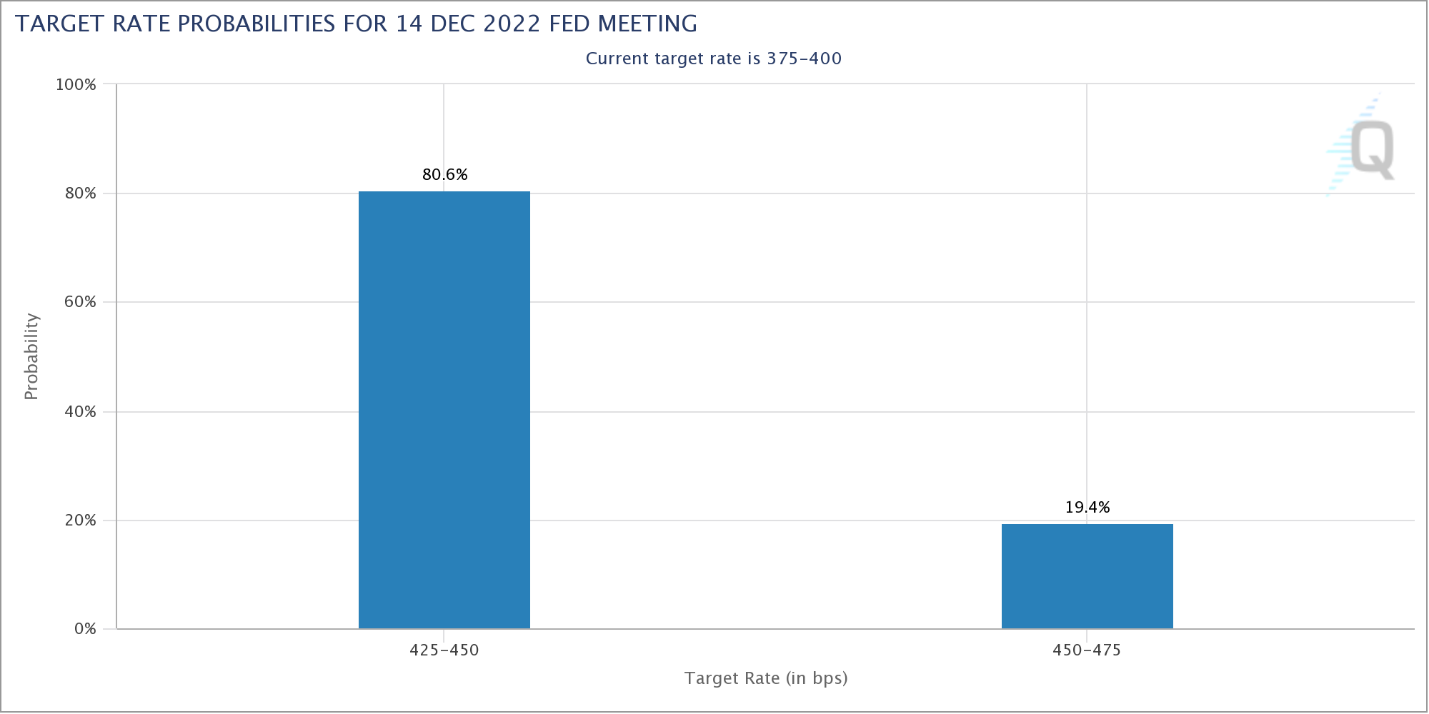
This [inflation release] comes after the central bank delivered a fourth consecutive super-sized 75 basis-point hike on 2nd November. Fed Funds Futures, according to the CME’s FedWatch Tool (below), shows that the target rate probability for a 50 basis-point hike at the mid-December meeting has risen to 80.6%, with a 19.4% chance of a 75 basis-point increase.
It would, of course, be remiss not to mention the cryptocurrency market’s recent events, pressured southbound on the back of the FTX fallout. Understandably, the week ended in a sea of red. Versus the US dollar, bitcoin (technical view below), Ethereum, Litecoin and Ripple shed more than 20%. The timeline of key events for cryptocurrencies below does a superb job of demonstrating bitcoin’s demise over the course of this year (source Reuters).

Week Ahead
Out of the US, attention is on PPI (Producer Price Index) inflation, retail sales, the Philadelphia Fed survey as well as Fed speakers. Their response to the weak US inflation figures delivered last week will be monitored closely and their comments, therefore, could further rattle financial markets.
From Europe, the German ZEW release is in view, while in the UK, several key macroeconomic data points are scheduled. UK chancellor Jeremy Hunt’s Autumn Statement on Thursday is certainly one to keep an eye on, with employment data on Tuesday being another, along with inflation figures on Wednesday and finally retail sales on Friday. Consequently, domestic UK markets will be interesting to monitor this week.
Technical View for the Week Ahead
Charts: TradingView
US Dollar Index: Dollar Down 4.0%
Daily timeframe.
The US dollar, measured by the US Dollar Index (a geometric-average calculation of the USD weighted against six international currencies), shed 4.0% last week, its largest one-week decline since 2009. The tail end of the week sent price action gliding through an accelerating trendline support, extended from the low 95.17 and support from 109.31-110.24 (which is now a marked resistance zone).
Fibonacci enthusiasts may acknowledge a Fibonacci cluster (50% retracement is not a Fibonacci ratio) entered the frame on Friday between 105.82 and 106.47. This, together with a neighbouring Quasimodo formation coming in from 105.05 and the nearby 200-day simple moving average (104.78), indicates a potential floor emerging from this area this week. The relative strength index (RSI) clocked its lowest levels since April 2021, threatening oversold conditions which coincides with channel support, drawn from the low of 47.90.
In terms of the greenback’s trend direction, we have now witnessed several lower lows/highs take shape since the Dollar Index peaked at 114.78 in late September. This indicates a downtrend, though given the uptrend was in play since June 2021 it is still too early to estimate.
Therefore, overall technical studies shine the spotlight on support between 105.05 and 106.47 this week, which shares a close connection with the 200-day simple moving average. Movement beyond the noted structures, of course, will add weight to the early downside bias recently seen.
 Bitcoin Against the US Dollar – BTC/USD
Daily timeframe.
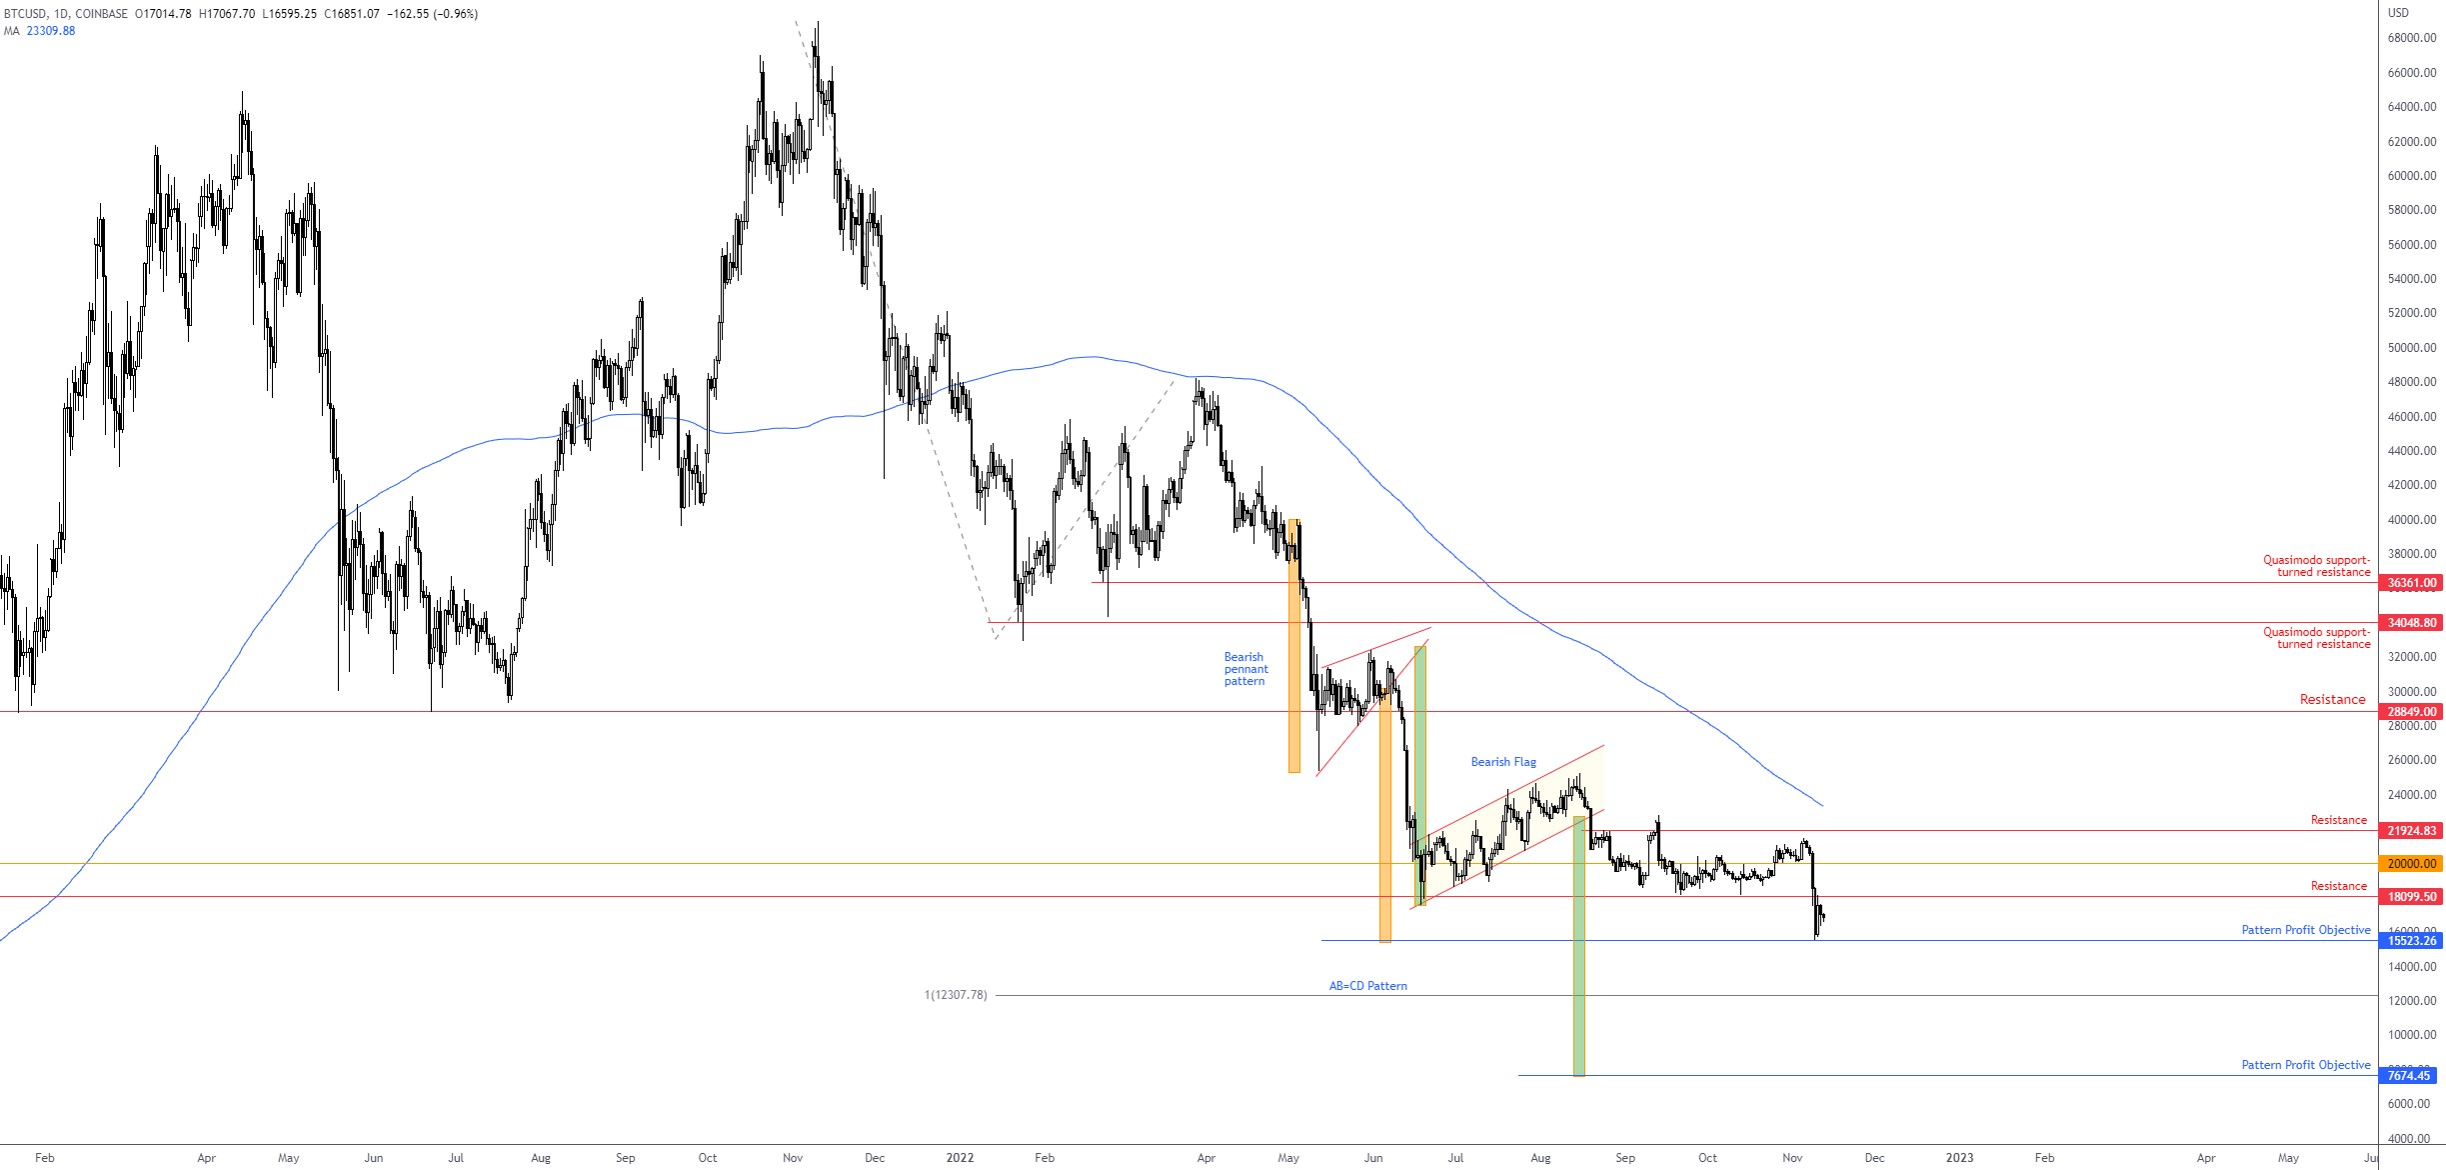
Major cryptocurrencies were a hot topic last week, squeezed lower on the FTX fallout. BTC/USD finished the week lower by around 20%, recording its largest one-week fall since mid-June and clocking lows of $15,512 (levels not seen since November 2020). It would be hard pressed to find any investor disagreeing that the major cryptocurrency is entrenched in a dominant downtrend. BTC/USD pencilled in an all-time high at $69,000 in November 2021 and subsequently shaped a series of lower lows/highs, reflecting a monstruous 75% decline.
Further corroborating the downside bias is price holding south of resistance coming in at $18,099 and trading comfortably under its 200-day simple moving average at $23,414 since the beginning of this year. As we can see, the bearish pennant ([formed in May] drawn from between $25,338 and $31,418) pattern’s profit objective (orange) entered the fight on Wednesday at $15,523. Consequently, the fight is between this level and the noted resistance base at $18,099 this week.
Dropping through $15,523, as the downtrend suggests, may see the unit embrace a 100% projection at $12,307: an AB=CD bullish formation. Interestingly, between mid-June and mid-August, we also welcomed a bearish flag pattern (extended from between $17.567 and $21,711), which identifies a pattern profit objective (green) as far south as $7,674.
Given the clear-cut downtrend, it should not surprise to see $15,523 cleared and perhaps a test of $12,307.
 EUR/USD: Trend Reversal?
Europe’s single currency outperformed against its US counterpart last week, rising 4% and recording its bulkiest one-week gain since March 2020. Could this be early signs of a trend reversal to the upside? Price action on the weekly timeframe has been rooted in an unmistakable bear trend since pencilling in a top in early 2021, with the recent pullback of 8.4% standing as the only notable upside correction since the said trend emerged. Also of technical relevance on the weekly scale is the break of resistance at $1.0298 (now marked support), indicating scope to approach Quasimodo support-turned resistance at $1.0778.
Meanwhile on the daily timeframe, a trendline resistance breach (extended from the high $1.1495) unfolded in late October. Following a subsequent retest of the breached trendline resistance, additional outperformance witnessed a break of resistance from $1.0090 (now potential support). Resistance at $1.0377 is now on the table this week, taking refuge just beneath the 200-day simple moving average ($1.0438). Of course, clearance of the said moving average would, according to some technical analysts, be considered a bullish trend reversal signal and theoretically expose resistance at $1.0602. The daily chart’s relative strength index (RSI) is also closing in on overbought space and channel resistance, etched from the high 55.09.
From a shorter-term perspective, the H1 timeframe concluded the week shaking hands with resistance at $1.0360. Moving beyond here directs attention to the $1.04 figure and a neighbouring 1.272% Fibonacci projection (or ‘alternate’ AB=CD bearish pattern) at $1.0401. To the downside, attention is drawn back to $1.03 and nearby support from $1.0277.
Considering weekly price ventured above $1.0298 and daily price has yet to cross swords with resistance at $1.0377 (and the 200-day simple moving average), selling pressure from the H1 resistance at $1.0360 this week is likely to be thin. As a result, a breakout to the upside, according to overall chart studies, is favoured, with short-term breakout buyers likely to target the $1.04 region on the H1 (an area sellers might try and make a show).
 AUD/USD: Inbound Head and Shoulders
Daily timeframe.
The Australian dollar ended the week 3.6% higher versus the US dollar, its biggest one-week gain since mid-2020.
For those who read my recent post on the AUD/USD, you may recall that I underlined the inverted head and shoulders pattern ($0.6363; $0.6170; $0.6272) as a possible reversal signal.
I noted the following (italics):
Although the currency pair has emphasised a clear-cut downtrend since early 2021, price has recoiled from daily support at $0.6212 and just north of weekly demand at $0.5975-0.6166 (see weekly chart). The strength behind Thursday’s upside unleashed a decisive close above not only daily resistance at $0.6536, but also beyond the inverted head and shoulders pattern neckline, pencilled in from the high $0.6547. With the aforementioned resistance cleared, daily resistance calls for attention at $0.6678.
As we can see, the second half of the week favoured buyers, powering through not only resistance at $0.6536 but also the $0.6678 resistance (both of which are now marked support levels). Interestingly, though, what the recent upside movement has accomplished is unearthing supply at $0.6857-0.6776, closely followed by the pattern’s profit objective set at $0.6875.
Heading into the week, therefore, buyers are expected to remain in command this week, zeroing in on supply from $0.6857-0.6776 and perhaps the noted pattern’s profit objective at $0.6875.
 XAU/USD: Gold: Beyond $1,807?
Daily timeframe.
Spot gold, in $ terms, rallied 5.4% last week and wrapped up at session highs: its largest percentage gain this year. However, although price has breached trendline resistance (etched from the high $2,070), I would want to see the unit close beyond 10th August high at $1,807 to validate a trend reversal in terms of price action.
Technical structure shows a resistance zone between $1,789 and $1,778 could welcome price action early this week (composed of two Fibonacci ratios and a Quasimodo resistance at $1,788). Demanding attention north of the aforesaid resistance zone is the 200-day simple moving average ($1,803). Note that the yellow metal has traded beneath this dynamic average since June of this year. A rejection from the noted resistance turns the radar to support at $1,725, accompanied by a decision point at $1,701-1,722.
Out of the relative strength index (RSI), the indicator’s value, after running through resistance at 60.00, registered overbought conditions at the end of the week. Within the overbought range is a channel resistance, taken from the high 59.51, with support now noted below at 60.00 in the event of a turn lower.
In view of RSI resistance, along with price resistance between $1,789 and $1,778 and the 200-day simple moving average, a rejection of the said structure may be seen this week. At that point, assuming sellers hold their ground, a scenario whereby dip-buyers attempt to make a show from the decision point at $1,701-1,722 could also develop.
 DISCLAIMER:
The information contained in this material is intended for general advice only. It does not take into account your investment objectives, financial situation or particular needs. FP Markets has made every effort to ensure the accuracy of the information as at the date of publication. FP Markets does not give any warranty or representation as to the material. Examples included in this material are for illustrative purposes only. To the extent permitted by law, FP Markets and its employees shall not be liable for any loss or damage arising in any way (including by way of negligence) from or in connection with any information provided in or omitted from this material. Features of the FP Markets products including applicable fees and charges are outlined in the Product Disclosure Statements available from FP Markets website, www.fpmarkets.com and should be considered before deciding to deal in those products. Derivatives can be risky; losses can exceed your initial payment. FP Markets recommends that you seek independent advice. First Prudential Markets Pty Ltd trading as FP Markets ABN 16 112 600 281, Australian Financial Services License Number 286354.


 Access +10,000 financial
instruments
Access +10,000 financial
instruments