
In his first public appearance of 2023, US Federal Reserve Chair Jerome Powell participated in a panel discussion (Central bank independence and the mandate – evolving views) on Tuesday and reiterated the central bank’s commitment to contain inflation. Powell added that ‘restoring price stability when inflation is high can require measures that are not popular in the short term as we raise interest rates to slow the economy’. However, comments on upcoming policy were minimal.
The main highlight for the week, though, was US inflation. Consumer prices, as expected, eased for a 6th consecutive month in the 12 months to December (2022) to 6.5%, according to the US Bureau of Labour Statistics (BLS). This follows the peak set in June 2022 at 9.1%. US core annual inflation, excluding energy and food, eased to 5.7% in the 12 months to December, softening by 0.3 percentage points from November’s 6.0% reading. This led to a bid across risk assets as market participants anticipate a slowdown in the pace of policy tightening out of the US Federal Reserve (Fed). According to the CME’s FedWatch Tool, based on Fed Fund futures contract prices, the market has all but priced in a 25 basis-point increase for the next Fed meeting on 1 February, action that would lift the Federal Funds target range to 4.50%-4.75%.
In the markets, major US equity indices fought their way into another week of positive gains (S&P 500 up 2.7%) amidst upbeat US inflation numbers and the beginning of Q4 earnings on Friday, focussed largely on banking shares. JPMorgan Chase & Co beat quarterly expectations, while Wells Fargo & Co fell short. Also of note in the equity space was the widely watched FAANG index, which posted a muscular week of gains. Amazon powered 14.0% higher, followed by Netflix at 5.47%.
Notable outperformers in the (majors) currency market were EUR/USD, AUD/USD and GBP/USD, up 1.78%, 1.48% and 1.15%, respectively. Laggards on the week were the USD/JPY, down an eye-popping 3.17% and the USD/CAD, shedding 0.35%.
Week Ahead?
Liquidity is likely to be thinner than usual on Monday as not only is the economic calendar somewhat light, US banks will leave their doors closed in observance of Martin Luther King Jr. Day. However, Tuesday will undoubtedly offer a more engaging environment, kicking off with the year-over-year growth rate (GDP) for China for Q4 at 2:00 am GMT, followed by the UK Claimant Count for December at 7:00 am GMT and Germany’s ZEW Economic Sentiment Survey at 10:00 am GMT. US hours will see the latest Canadian inflation data at 1:30 pm GMT and the US New York Manufacturing Index. We also see earnings from Goldman Sachs and Morgan Stanley during pre-market hours.
Early hours Wednesday will have attention shift to the Bank of Japan’s (BoJ) interest rate decision at 3:00 am GMT. The consensus heading into the rate decision is that the central bank will maintain its ultra-low interest rate policy at -0.1%, though expectations are growing for a policy review this year. This is shortly followed by the widely anticipated annual inflation rate for the UK for December at 7:00 am GMT, expected to ease to 10.6% (median forecast), with the core annual inflation number projected to remain unchanged at 6.3%. The Bank of England (BoE) are set to meet a day after the Fed meeting on 2 February, with markets currently expecting the central bank to hike the Bank Rate by 50 basis points, a move which would lift the benchmark rate to 4.00%. Finally, Wednesday’s markets will also be drawn to US retail sales and Producer Price Index (PPI) data at 1:30 pm GMT.
Thursday welcomes Aussie employment data for December at 12:30 am GMT, followed by US housing figures (December) at 1:30 pm GMT and the usual weekly US initial jobless claims data for the week ending 13 January. Also of relevance on Thursday, Procter & Gamble (pre-market hours) and Netflix (after-market hours) release their latest quarterly earnings results.
Friday rounds off the week with a look at retail sales data from the UK for December and Canada for November at 7:00 am GMT and 1:30 pm GMT, respectively.
Technical View for Key Markets this Week
Charts: TradingView
US Dollar Index: Price Action Eyeing the Lower Limit of a Decision Point
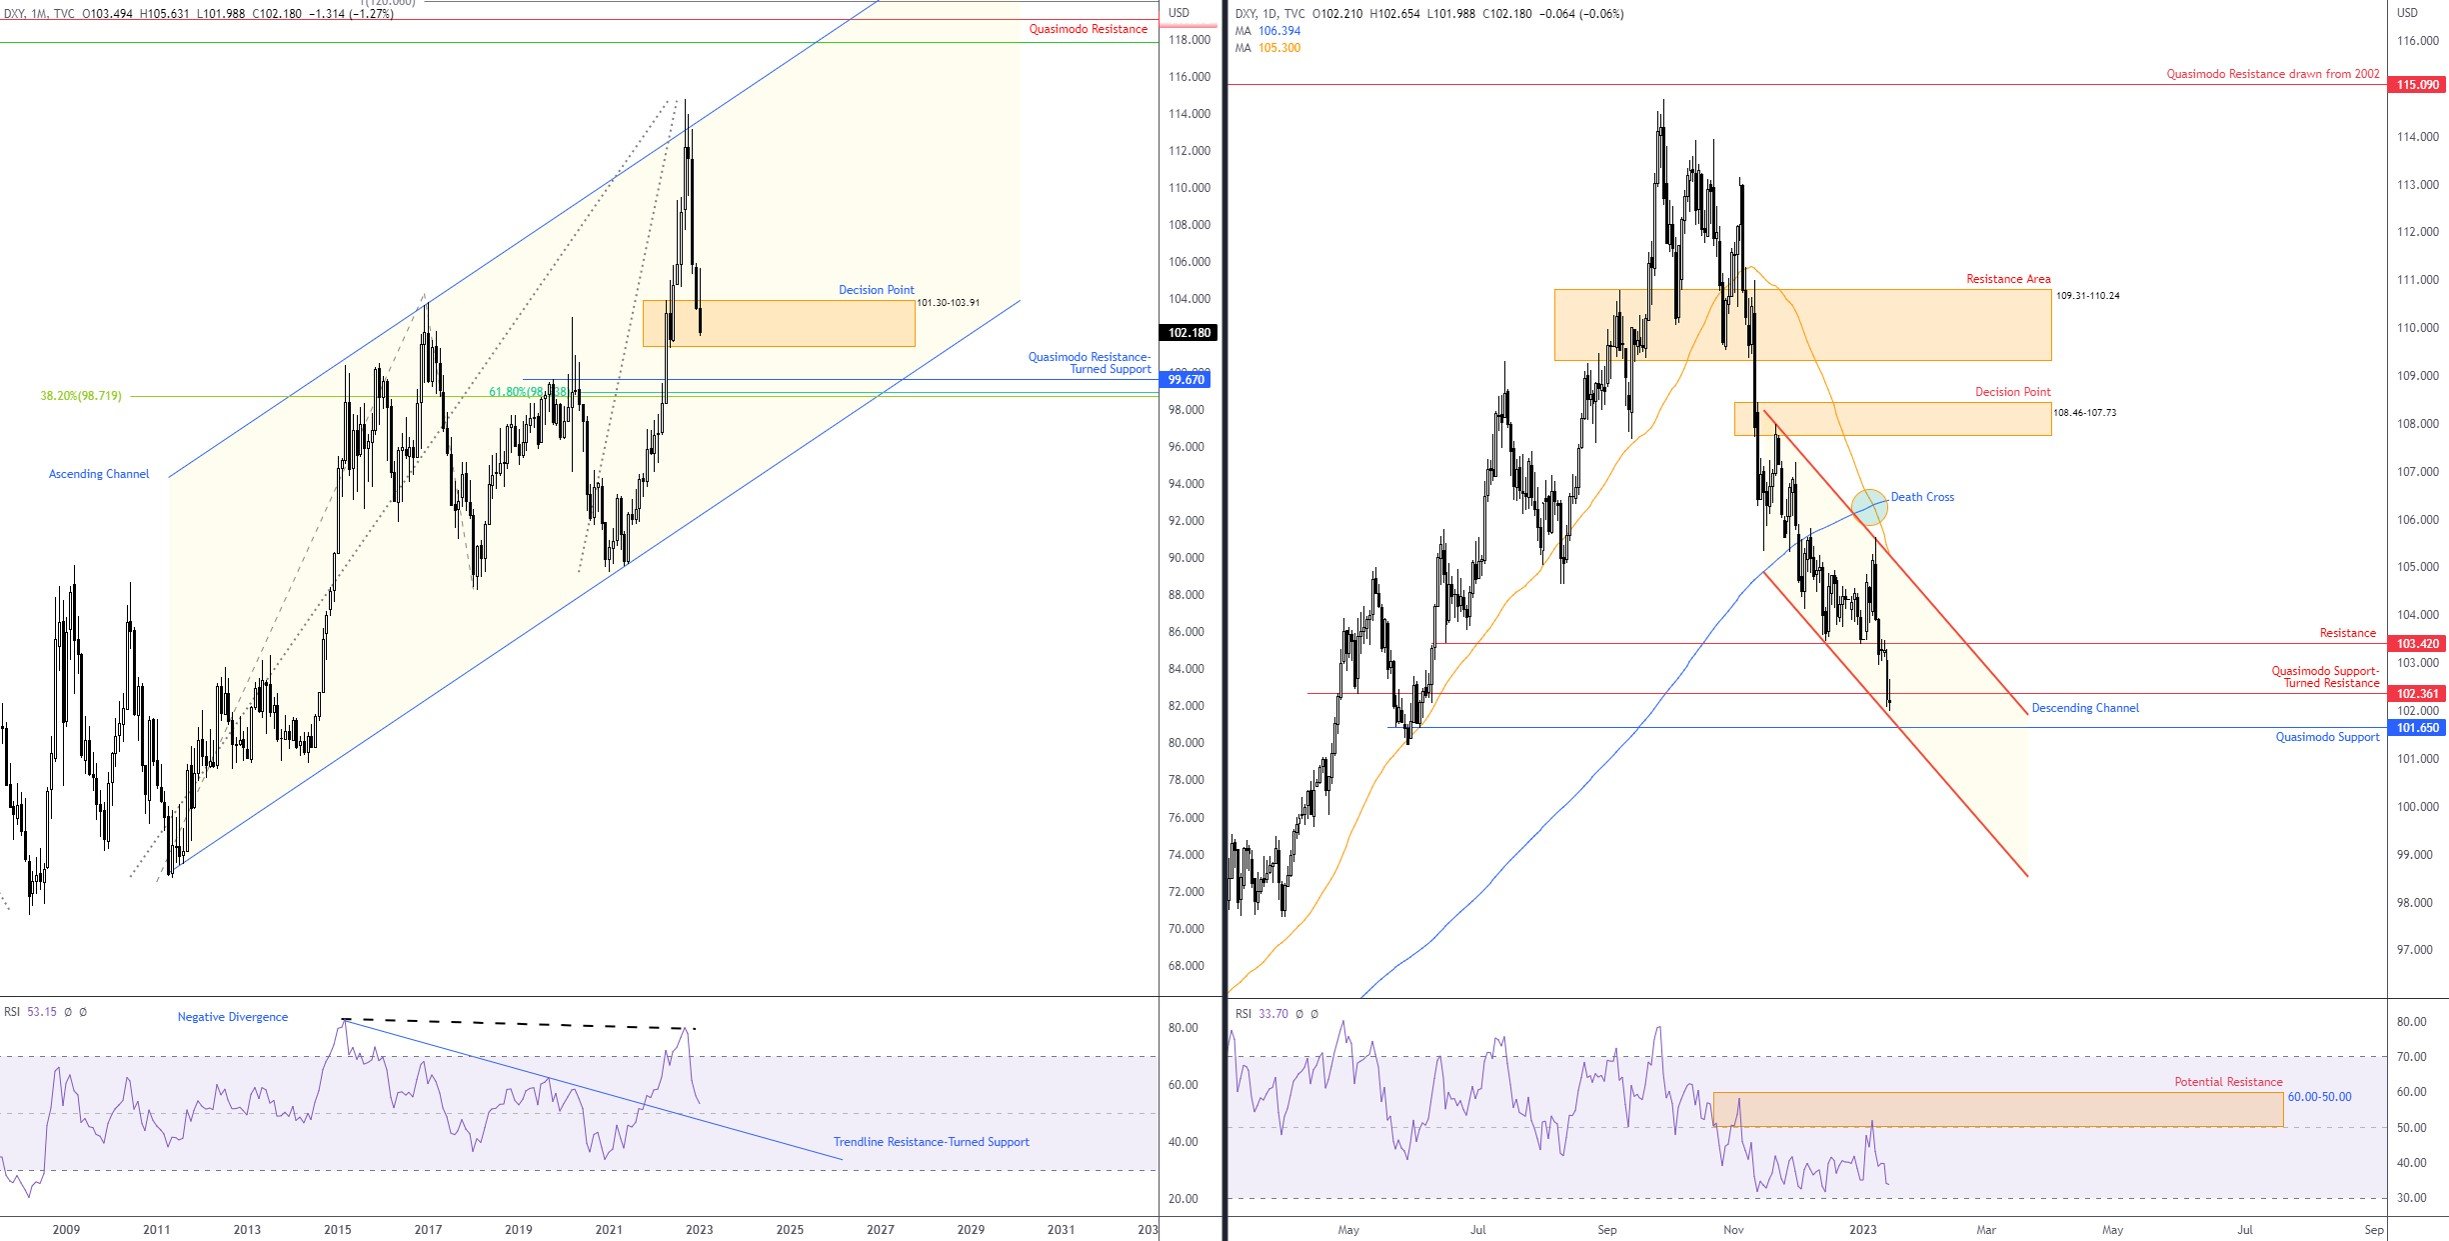
Down 1.67% last week, the US dollar is poised to challenge the lower perimeter of a notable decision point at 101.30-103.91 on the monthly timeframe. This follows a one-sided decline in Q4 of 2022 from an ascending channel resistance, extended from the high 103.82, structure that was also complemented by negative divergence out of the Relative Strength Index (RSI). Month to date, the buck is down 1.3% and is on track to pencil in a fourth consecutive monthly loss.
Clearing the aforementioned monthly decision point reopens the risk of a further decline to monthly Quasimodo resistance-turned possible support at 99.67, closely shadowed by a mild Fibonacci cluster at approximately 99.00. In terms of the RSI, we can also see scope to drop in on the 50.00 centreline, a barrier that could offer indicator support.
But, despite the above, while bears are clearly in the driving seat right now, trend direction has remained to the upside since early 2008.
Meanwhile on the daily timeframe, trend direction favours shorts. This is shown through the recent Death Cross. Fashioned through the 50-day simple moving average (105.30) crossing under the 200-day simple moving average (106.39), this signals the potential for a major trend reversal (though do bear in mind that this is a lagging indicator and reflects past price movement). In addition to this, of course, since establishing a peak (see monthly analysis), a series of lower lows and highs materialised (traditional bearish trend structure).
Technical structure shows price overthrew two key support levels on the daily timeframe last week at 103.42 and 102.36, both of which now represent possible resistances. To the downside, support is nearby at 101.65, shaped by way of a Quasimodo formation which happens to join hands with a channel support, taken from the low 103.45. Technically speaking, the aforesaid supports are essentially the last line of defence for the monthly timeframe’s decision point mentioned above at 101.30-103.91. As a result, this will be an interesting location to monitor this week in the event the levels are tested.
Finally, the daily timeframe’s RSI shows signs of a temporary overbought region between 60.00 and 50.00. This is common in strong downtrends; therefore, this could be a location to keep an eye on over the coming weeks for signs of negative divergence and bearish failure swing signals.
 EUR/USD Closing in on Weekly Resistance
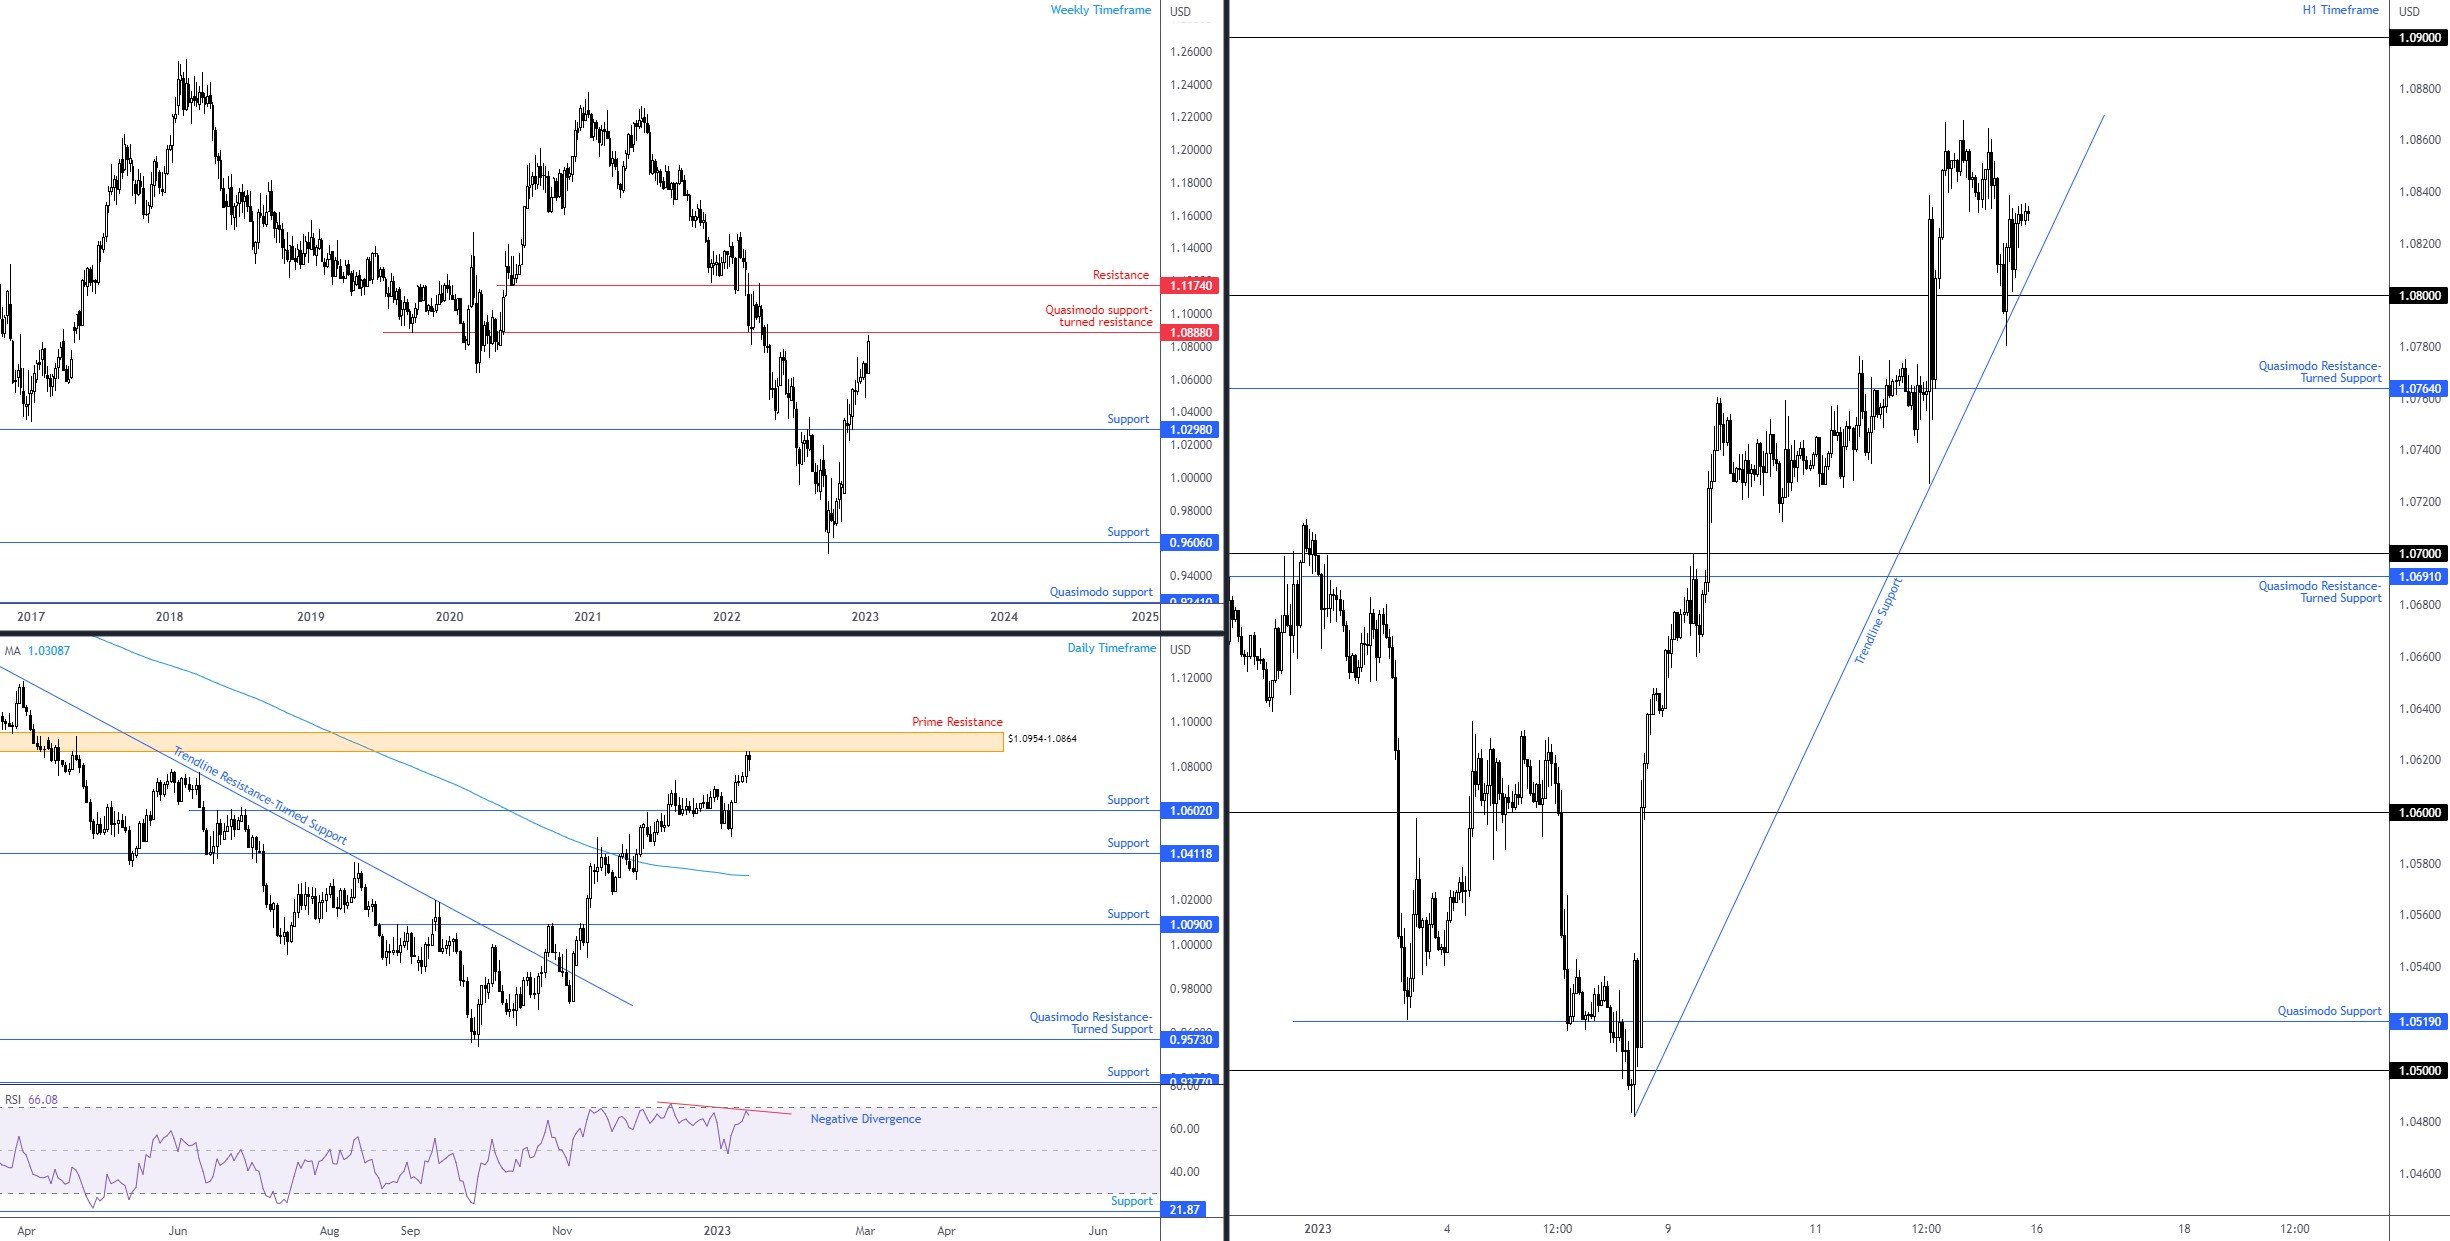
Europe’s single currency ended the week on the front foot against the US dollar, adding 1.8%. This has elevated the currency pair to within striking distance of a weekly Quasimodo support-turned potential resistance at $1.0888. As you can see from the weekly timeframe, since price chalked up a clear low in late September (2022) at $0.9536, the unit, rallying 13.5%, soared above resistance at $1.0298 which was shortly after revisited as support. Despite the rally, the EUR/USD has been in a downtrend since early 2021. What this might mean is the recent near-14% pullback may have price react from resistance noted above at $1.0888 this week as sellers attempt to sell the rally.
Addressing price action on the daily timeframe, the pair finished the week shaking hands with prime resistance from $1.0954-1.0864. While price is trading above the 200-day simple moving average (currently fluctuating at $1.0309), which signals a bullish market, buyers have a lot to contend with this week: weekly resistance at $1.0888 and daily prime resistance from $1.0954-1.0864, coupled with the Relative Strength Index (RSI) forming early negative divergence ahead of overbought territory. To the downside on the daily scale, technicians will note support at $1.0602.
On the H1 timeframe, an uptrend, seen within the recent pullback amidst the longer-term trend, is clearly visible. Short-term price action retested $1.08 heading into the US session on Friday, after a break of the level during London hours Thursday. The retest, aided by trendline support, taken from the low $1.0482, could help reinforce a move higher this week, targeting recent end-of-week peaks at $1.0867, followed by a possible continuation move to $1.09. Assuming buyers fail to find acceptance at current levels, however, a $1.08 breach opens the trapdoor to Quasimodo resistance-turned potential support from $1.0764.
Ultimately, dip-buyers from $1.08, although having to contend with possible selling from the daily prime resistance ($1.0954-1.0864), have scope to run for weekly Quasimodo support-turned possible resistance at $1.0888. Consequently, if buyers do find some grip at current levels, the $1.09 handle on the H1, given its close proximity to the weekly resistance level, could be seen as an upside target and a location active sellers may emerge from. On the other hand, should daily sellers command control, and we move under $1.08, short-term breakout sellers are likely to take aim at $1.0764.
 S&P 500 Trading at a Clear Technical Juncture
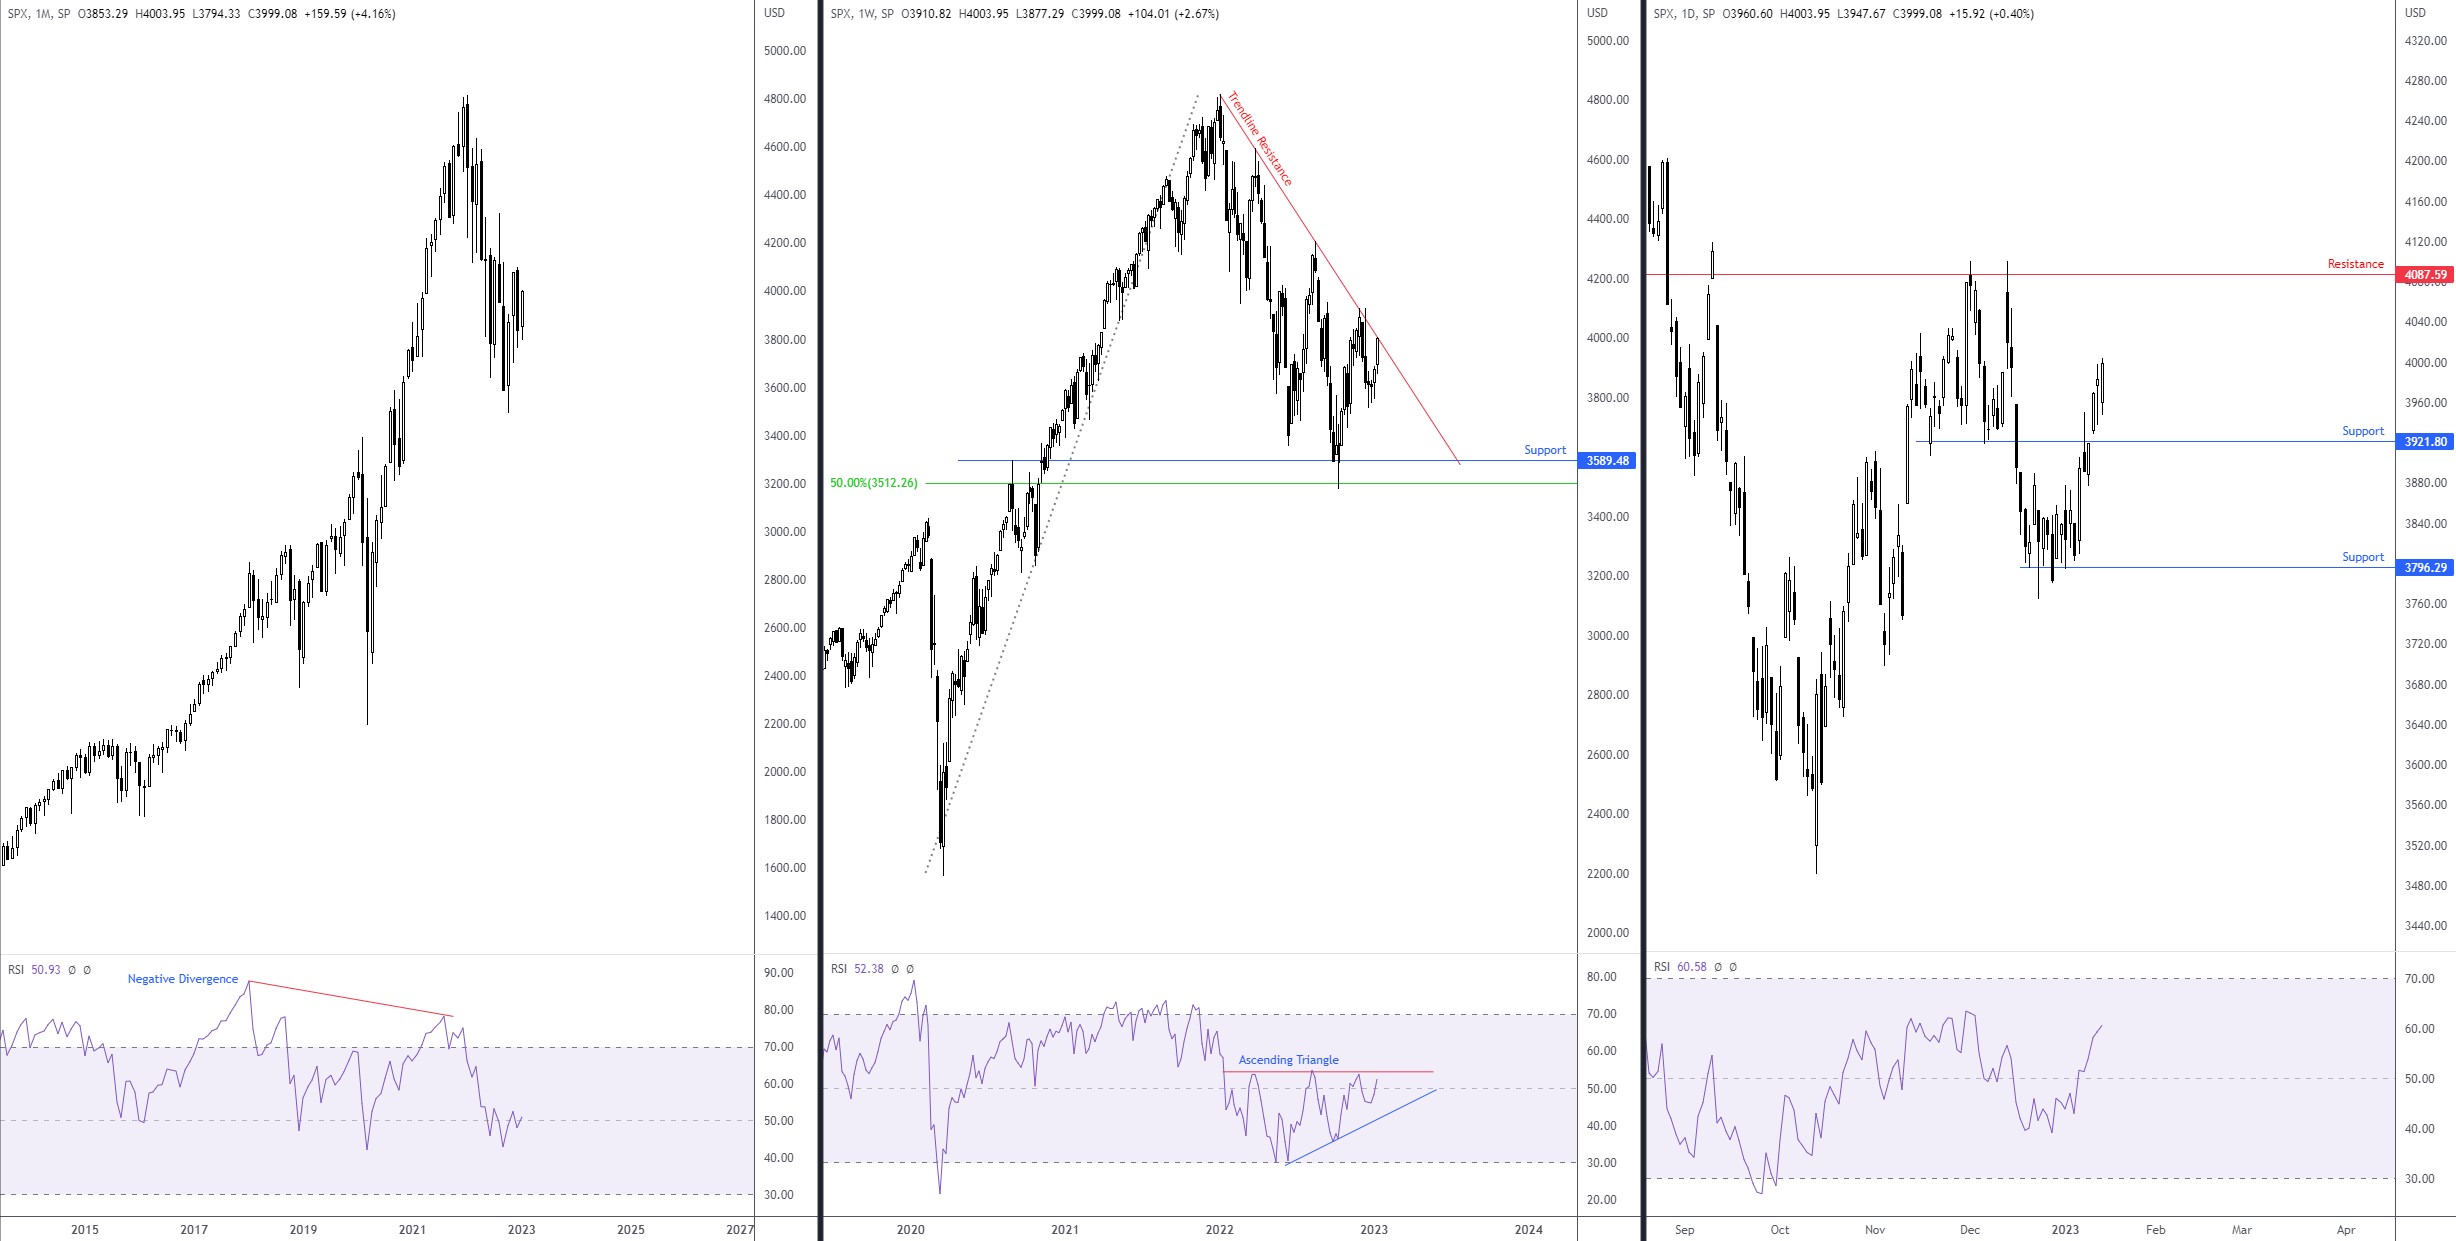
The S&P 500 is an interesting market right now, an index tracking the performance of 500 (a little more than 500) of the largest companies listed in the US.
Opening from the monthly chart, it is clear to see the index has remained in a dominant uptrend since early 2009. We had two notable corrections in that time, one in early 2020 (COVID), dropping 35%, and one currently in play since early 2022 (down 27% from 4,818, as of writing) which was accompanied by negative divergence out of the Relative Strength Index (RSI).
Across the page on the weekly timeframe, price action has been respecting trendline resistance (drawn from the high mentioned above at 4,818). However, following the rebound from support at 3,589 and a 50.0% retracement at 3,512 in mid-October, recent price action (lack of bearish interest) appears set to dethrone the noted trendline resistance. Technically, a break would help reaffirm the monthly chart’s uptrend, therefore this will likely be a monitored trendline resistance this week. Adding to this, the RSI, since March 2022, has been forming an ascending triangle between 53.60 and 30.47. While these patterns are frequently seen in uptrends, they can also represent reversal structure in downtrends. Consequently, a breakout north above both this triangle formation, alongside the noted trendline resistance, would likely underpin a longer-term bid in this market.
Against the backdrop of the monthly and weekly timeframes, price action on the daily timeframe forged support off 3,796 in late December and subsequently saw the index engulf resistance from 3,921 (now a marked support level). With daily price exhibiting scope to approach resistance at 4,087 this week, and the daily RSI recently cementing position north of its 50.00 centreline (positive momentum), this informs market participants that weekly price could be looking to take on weekly trendline resistance, in line with the overall long-term uptrend on the monthly scale.
Risk-averse buyers may consider waiting for a break of daily resistance at 4,087 to occur before committing, while those with more risk appetite might attempt to initiate a long position above current daily support at 3,921 this week, in anticipation of a breakout higher.
 Amazon (AMZN)
Daily Timeframe:
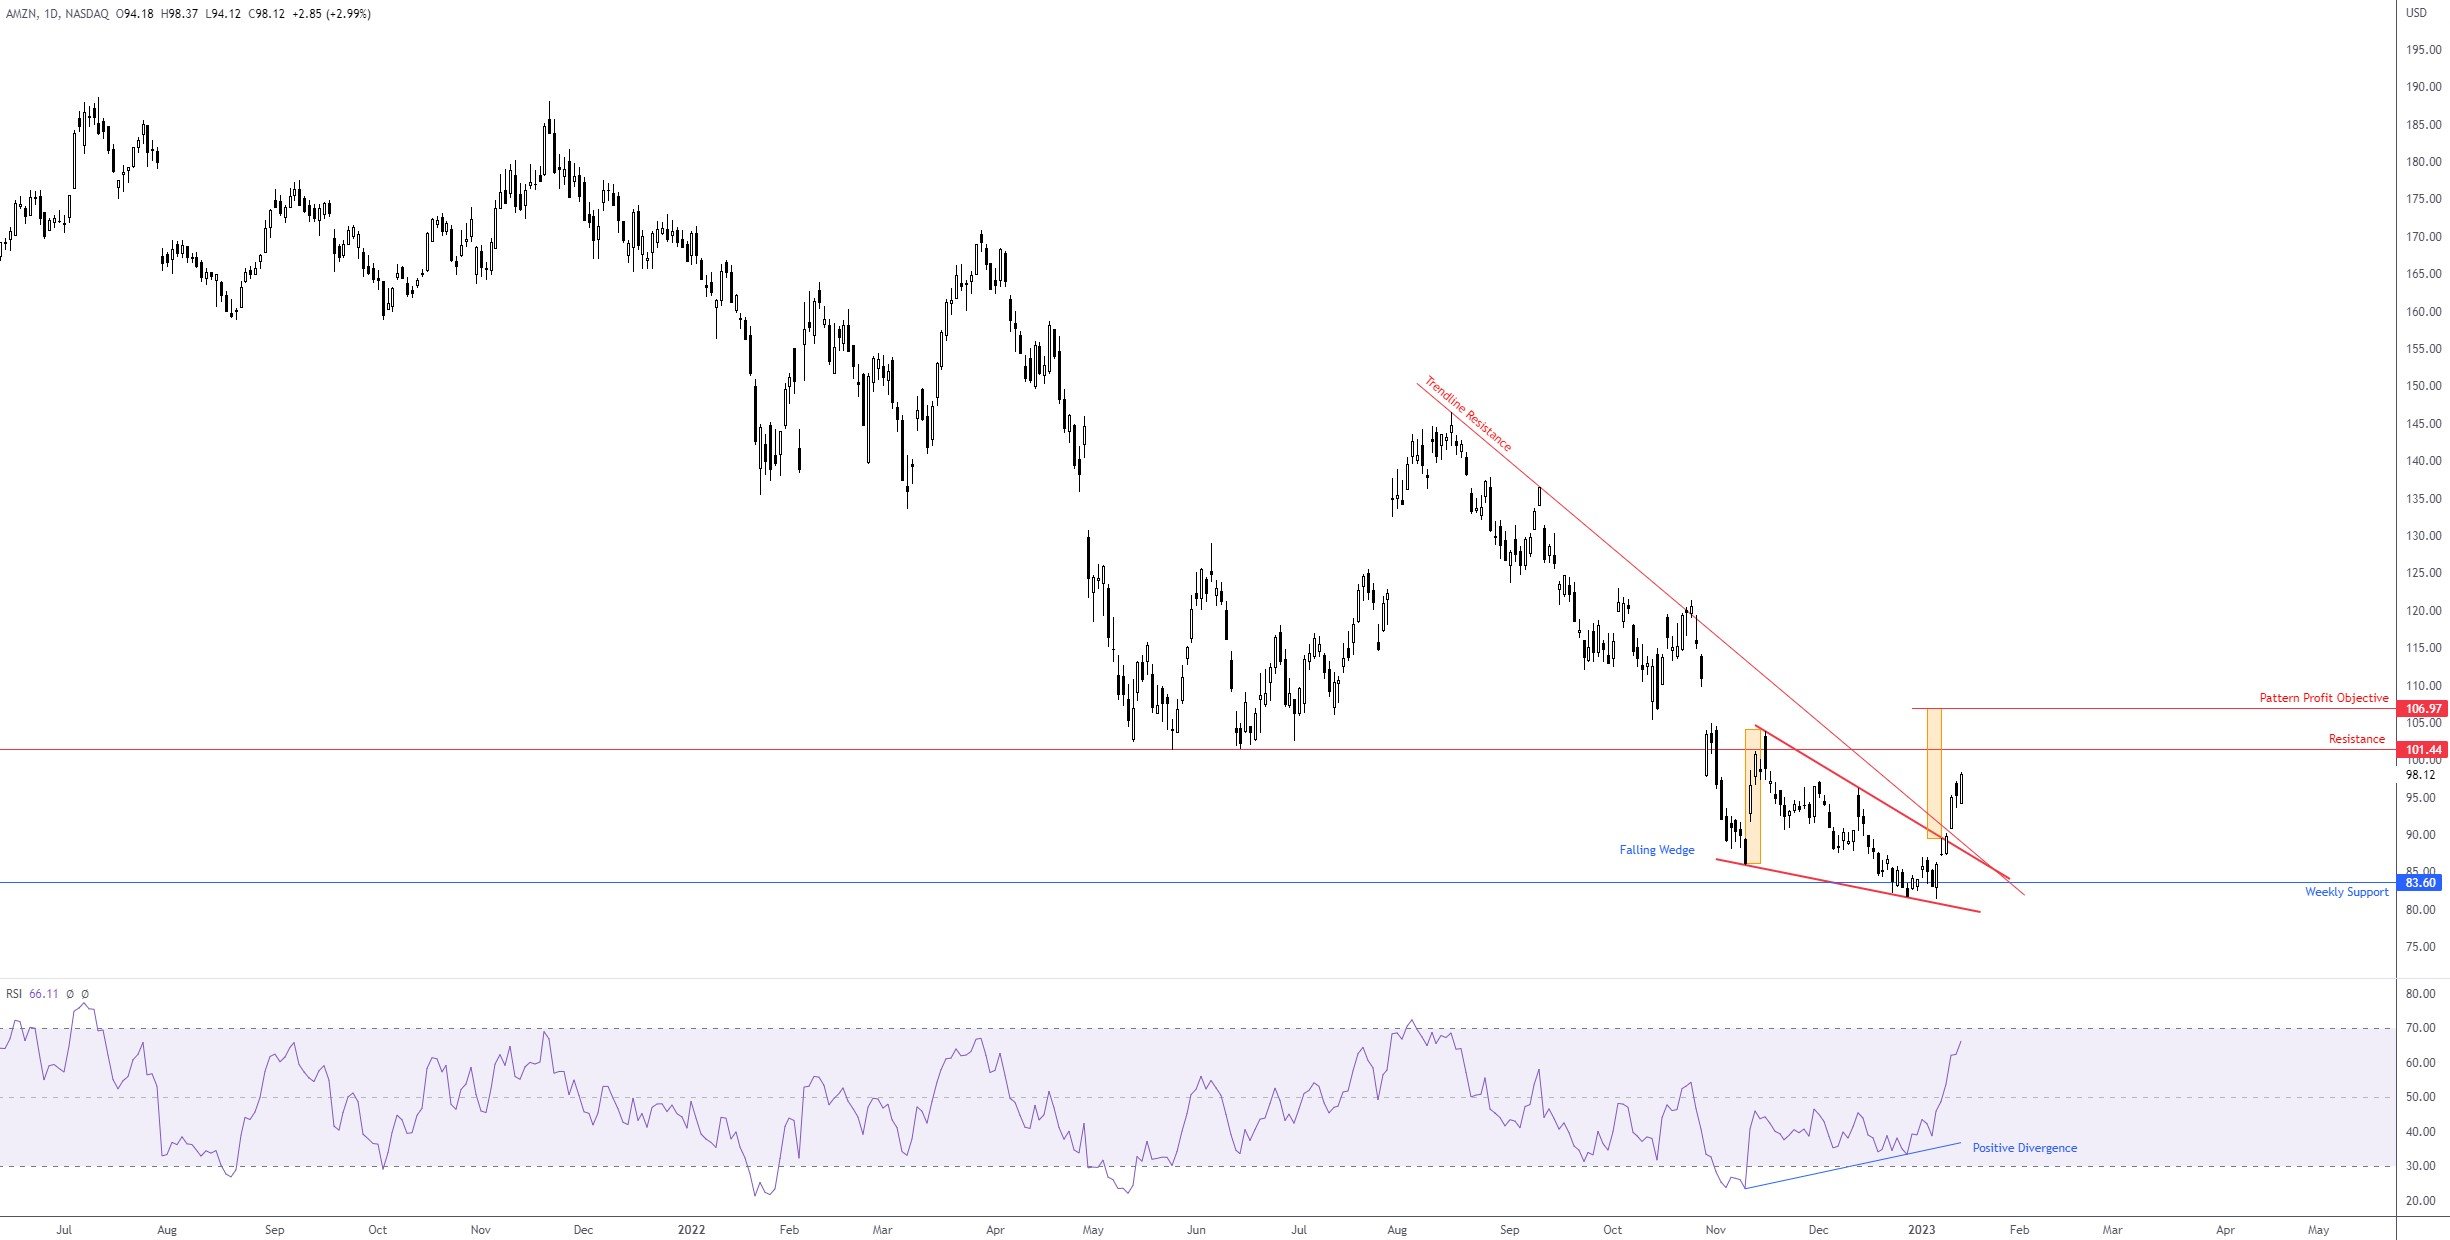
Note that this is a chart the research team wrote about last week. Given the week’s performance, nevertheless, and the approaching resistances, the team believed it deserved a second showing.
Following a 50.0% slump last year, could things be on the up for Amazon?
After price bottoming at a weekly support from $83.60 (with the help of the Relative Strength Index [RSI] printing positive divergence), last week witnessed a breakaway gap higher, one that forged a breakout above trendline resistance, taken from the high $146.57. Up 14.0% on the week, the share price has scope to extend recovery gains this week until meeting resistance priced in at $101.44.
Technicians may acknowledge a breakout above a falling wedge also occurred, drawn from between $103.79 and $85.87. This is a reversal structure, with many traders often taking the base value and adding this to the breakout point (orange rectangles) to calculate a profit objective, which, in this case, is set at $106.97, fixed just north of the resistance noted above at $101.44.
 XAU/USD: Golden Cross in Sight
Daily Timeframe:
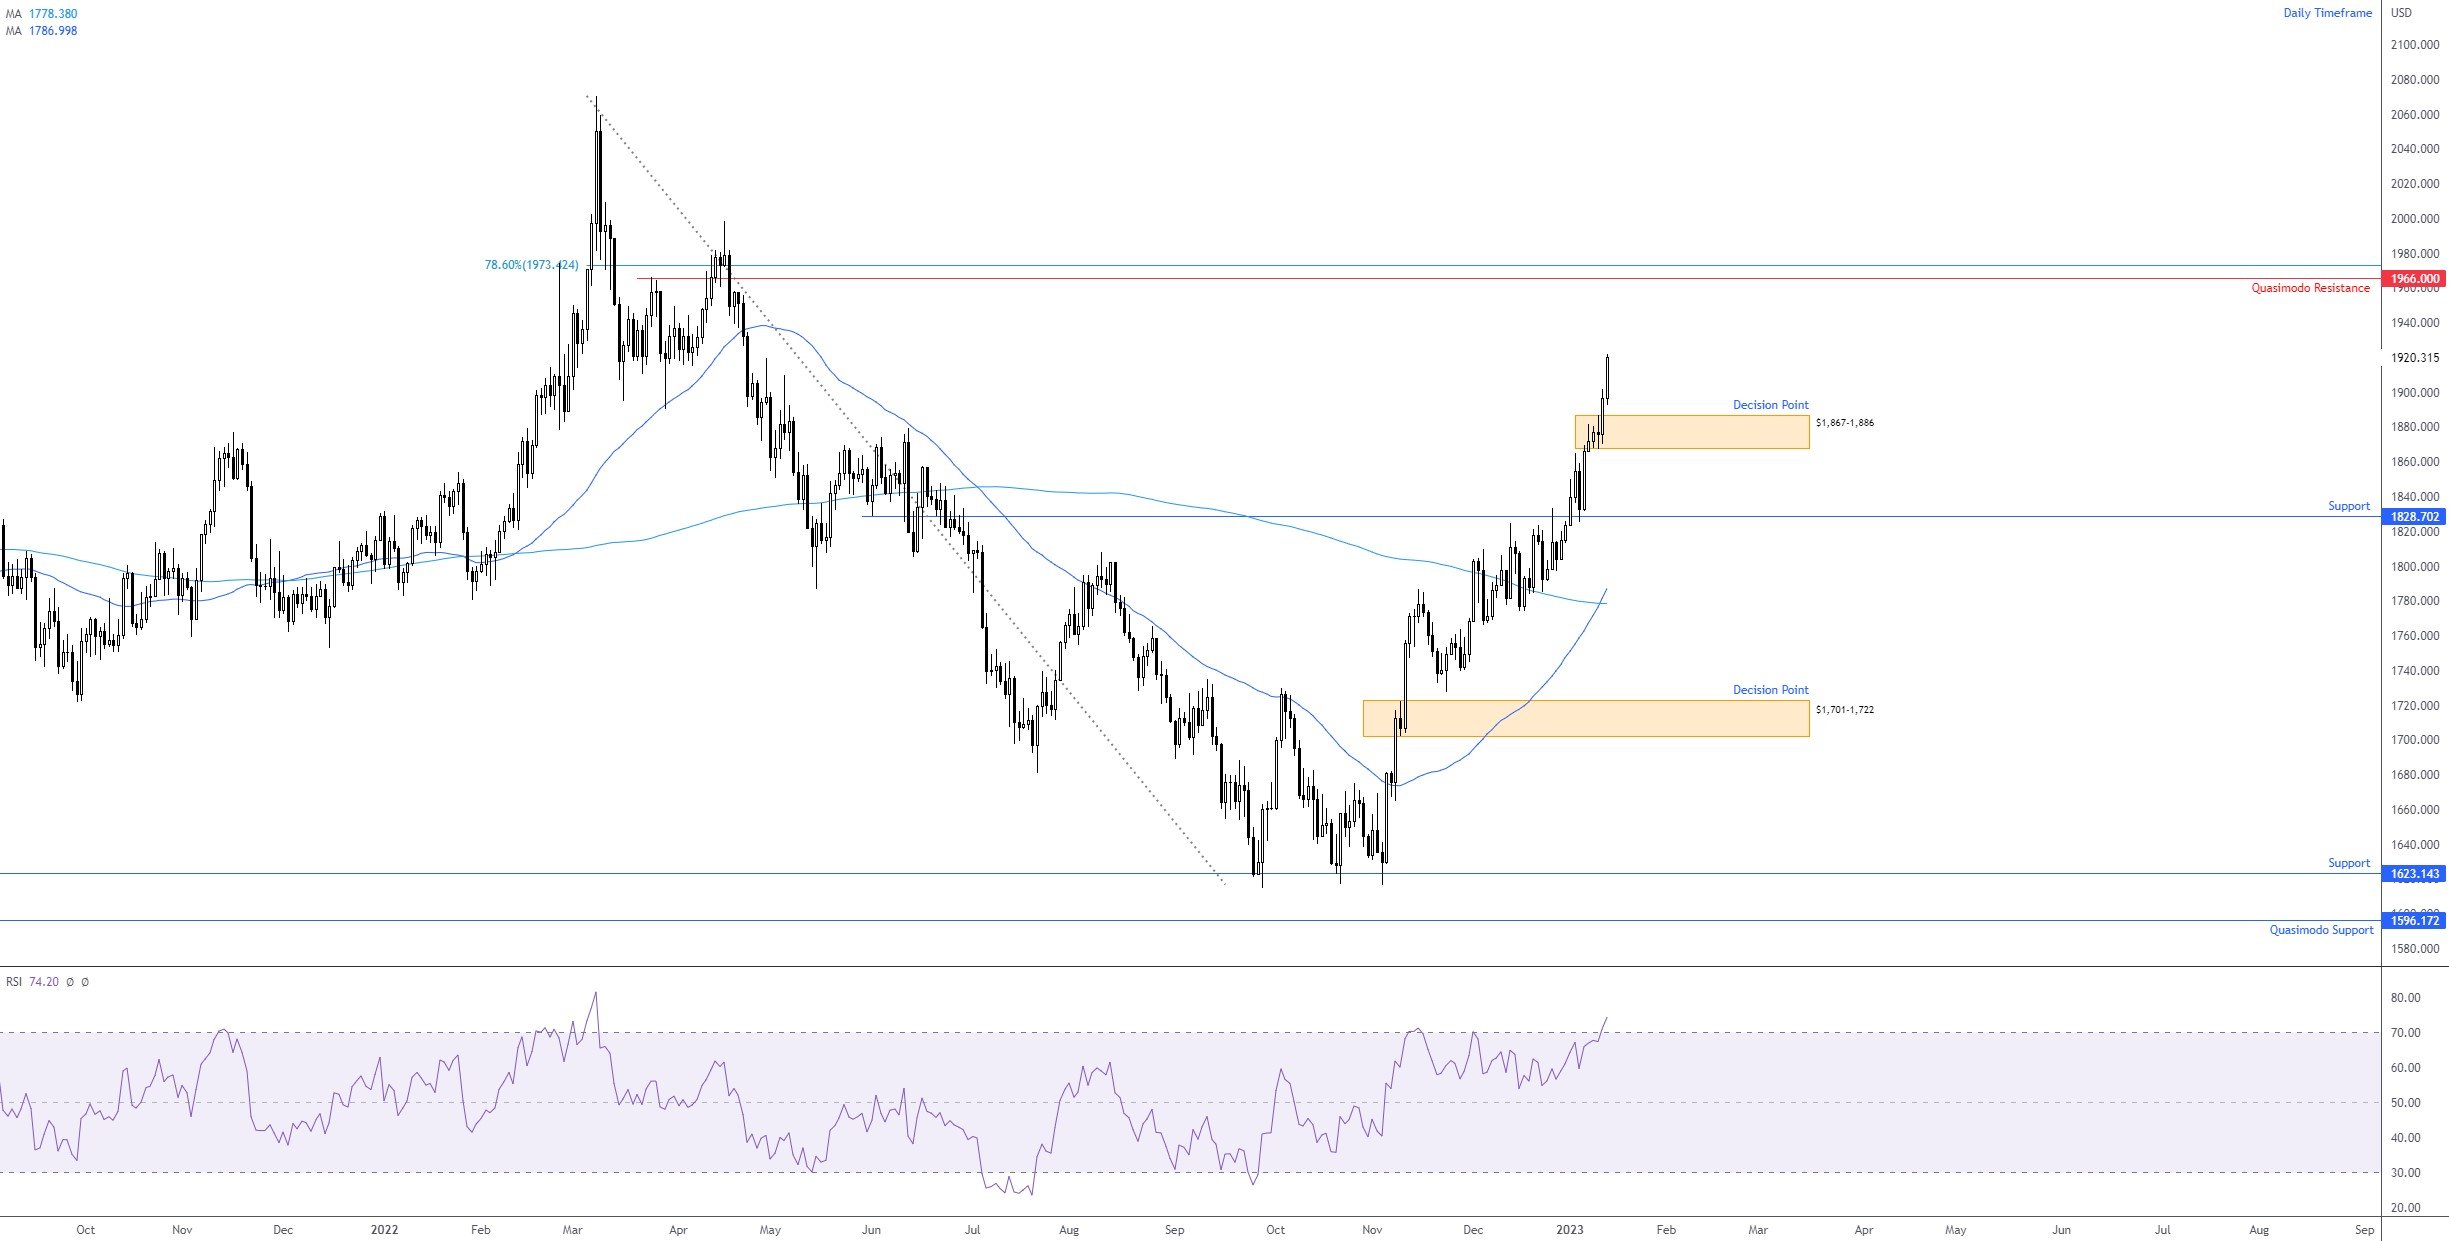
Spot gold, in $ terms, powered higher for a fourth consecutive week, adding nearly 3.0%. The trend, according to the daily chart, is now trending higher. The reversal presented itself in early December last year following the break of the $1,786 previous high in November 2022. Since then, the precious metal also recently welcomed what is known as a Golden Cross, which is the 50-day simple moving average ($1,786) crossing above the 200-day simple moving average ($1,778). This is a pattern trend followers tend to watch and can signal the possibility of a long-term uptrend surfacing.
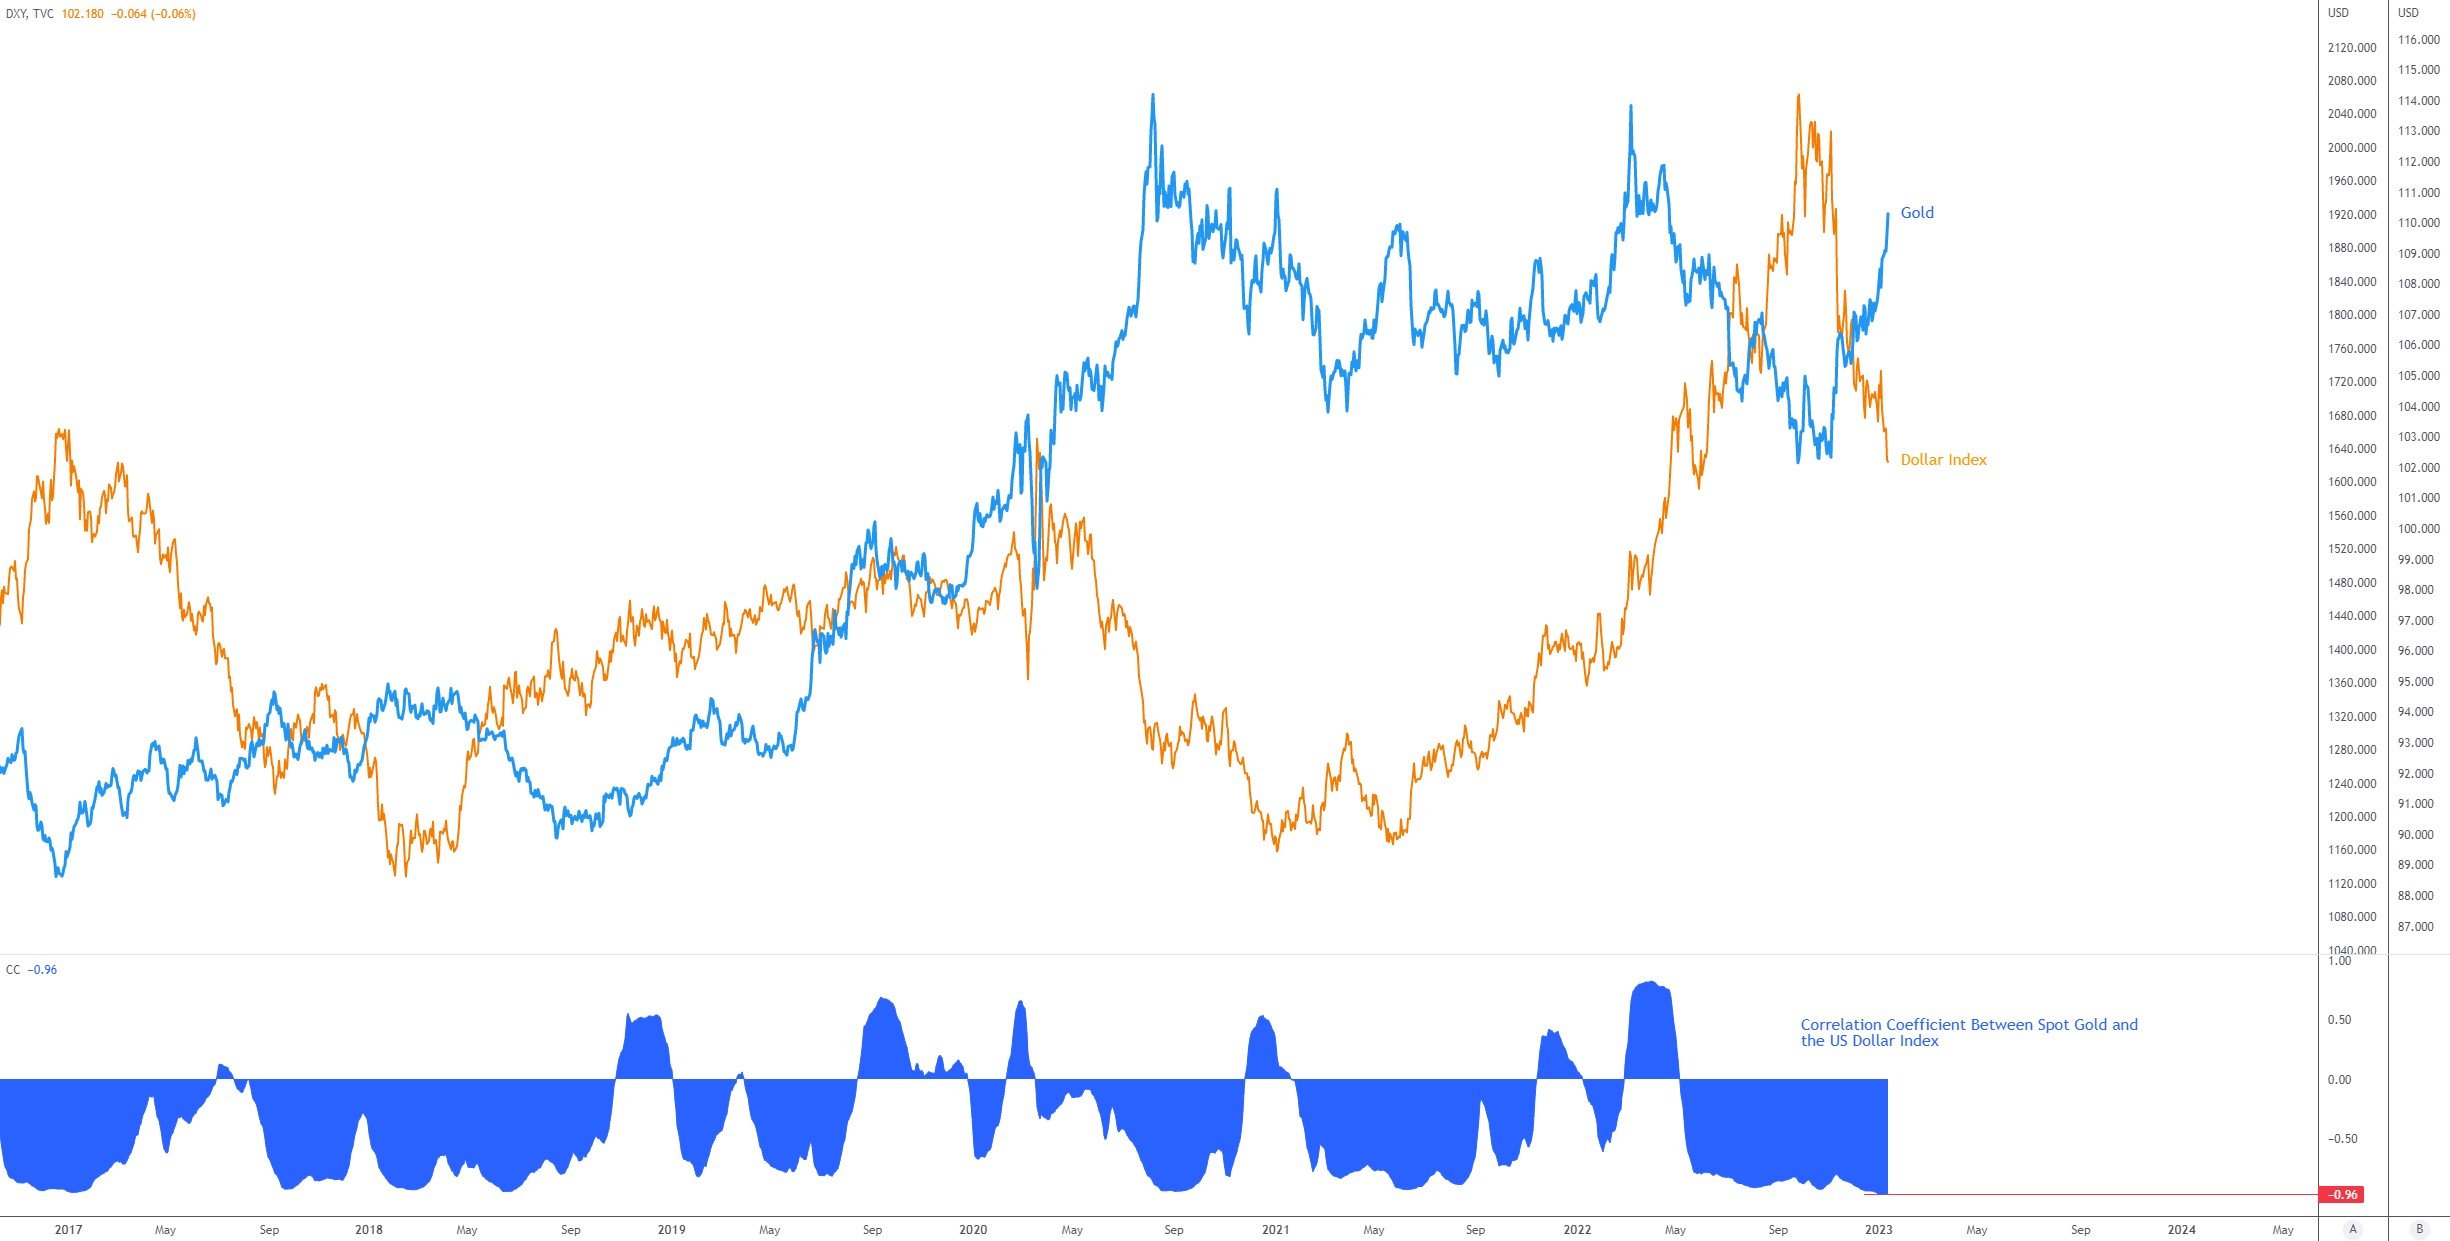
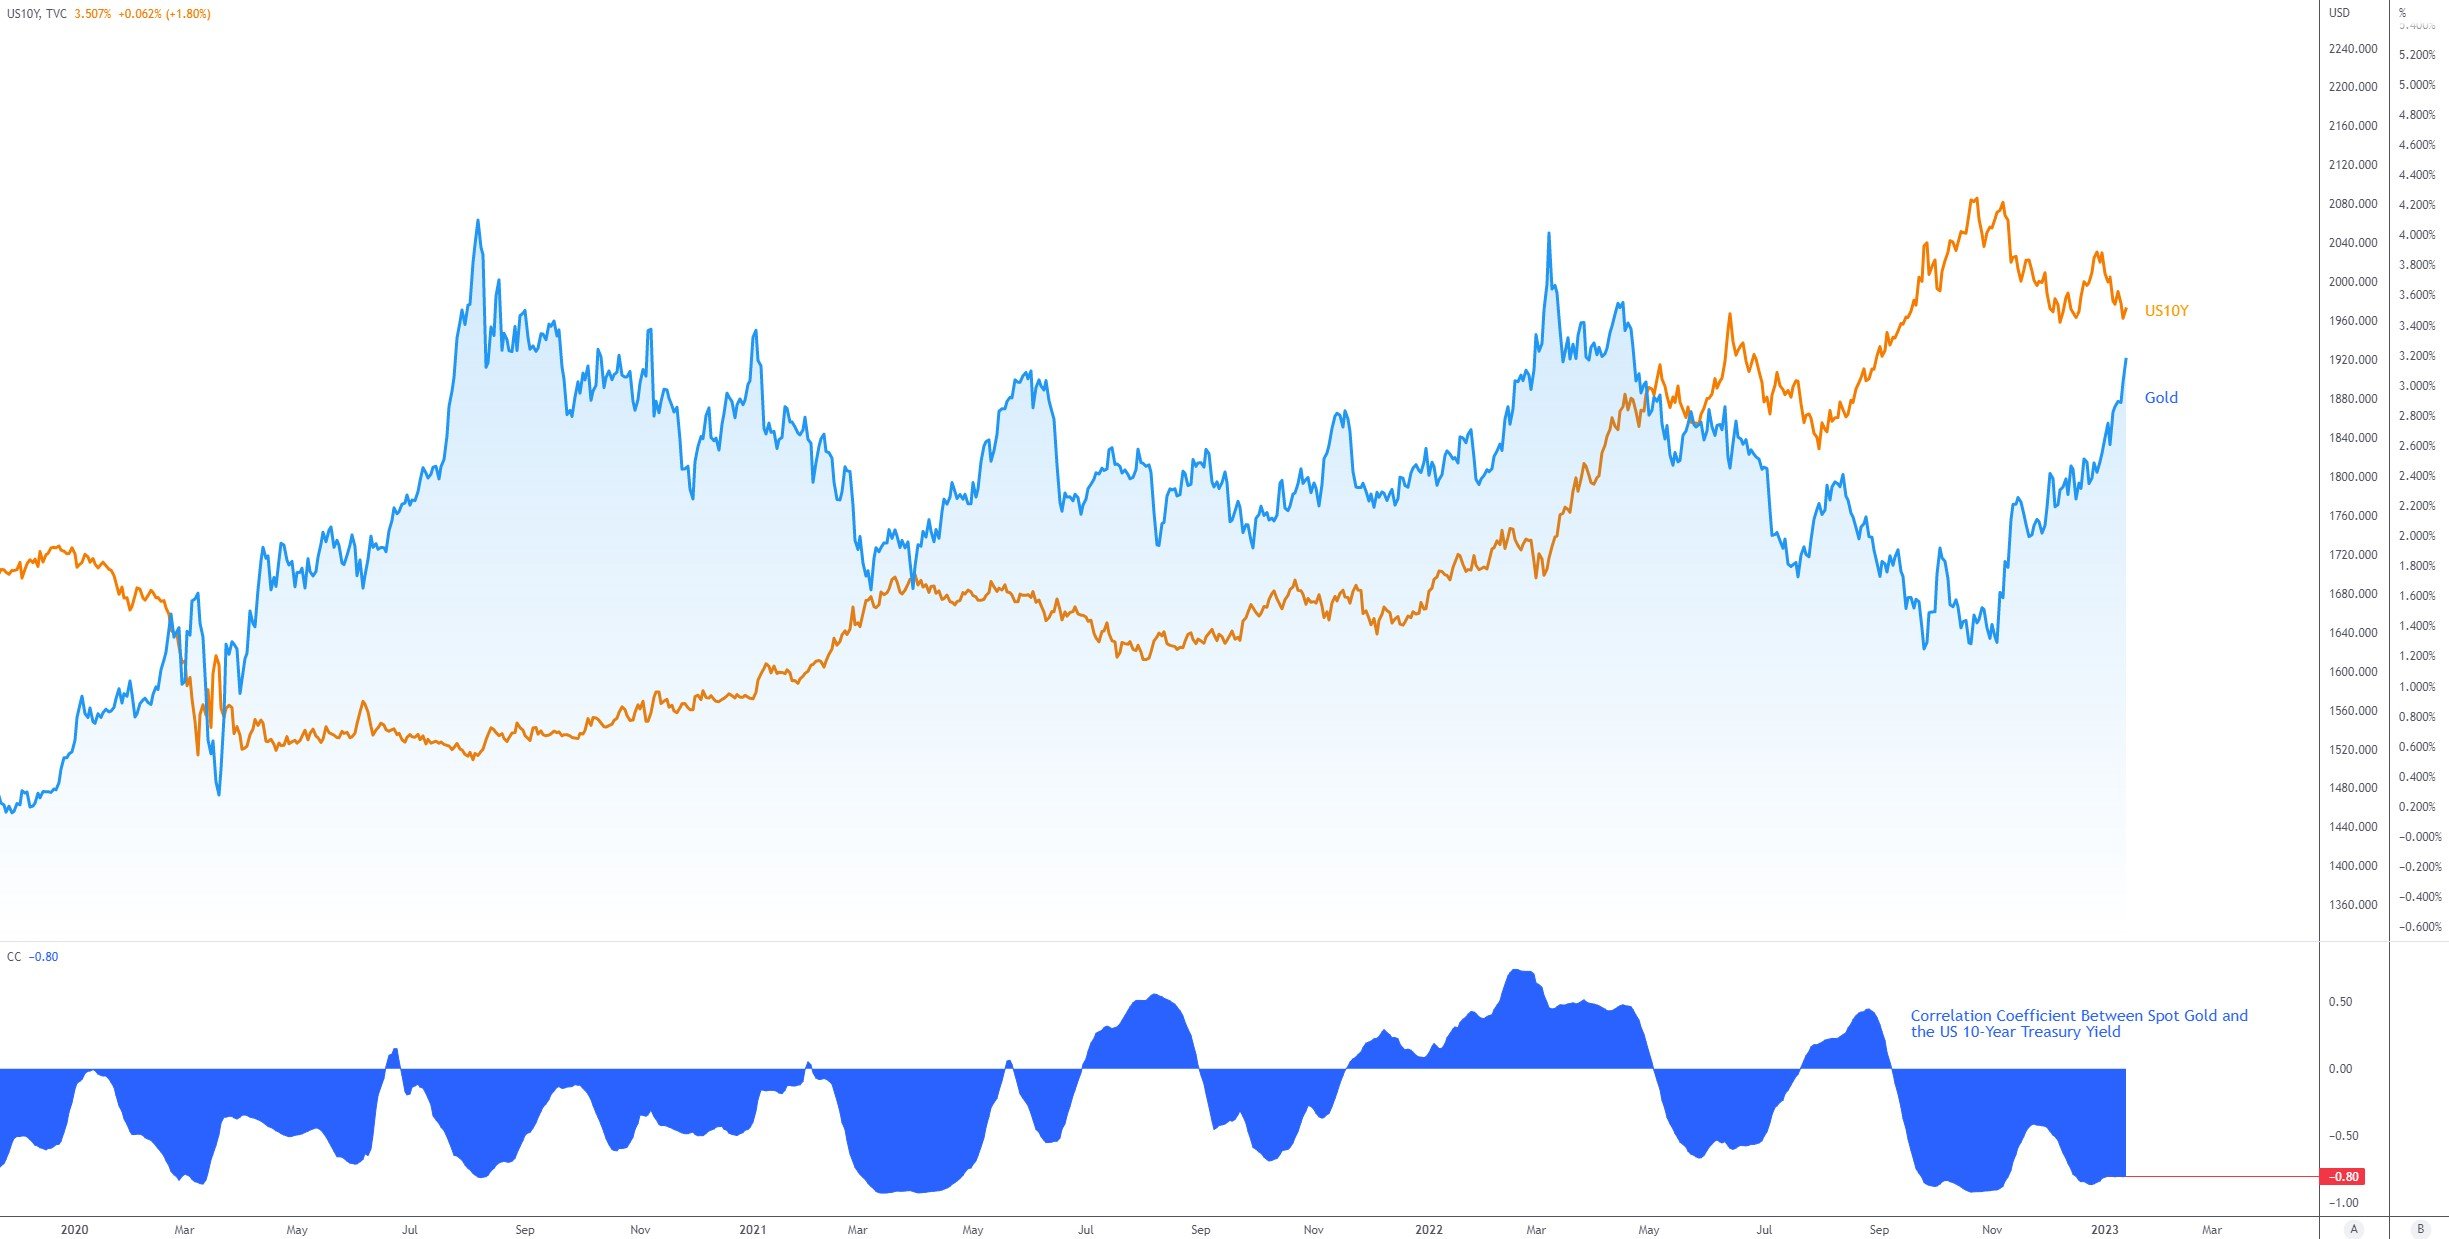
Helping to underpin this trend is both the US dollar’s decline (see above for the US Dollar Index) and US Treasury yields dropping (see correlation coefficient charts below for both the Dollar Index and US Treasury yields against gold). To the upside, resistance is seen in the form of a Quasimodo formation at $1,966, closely accompanied by a 78.6% Fibonacci retracement at $1,973. It is also worth highlighting that the Relative Strength Index (RSI) registered an overbought condition last week, touching levels not seen since March 2022.
Although support is not seen until $1,828, buyers do have a decision point nearby at $1,867-1,886 to possibly work with this week. A retest of the aforementioned area, therefore, could see dip-buyers make a show and push for the Quasimodo resistance noted at $1,966.
 Correlation Coefficient (60-Day Rolling Average) between Gold and the US Dollar Index
 Correlation Coefficient (60-Day Rolling Average) between Gold and the US 10-Year Treasury Yield
 DISCLAIMER:
The information contained in this material is intended for general advice only. It does not take into account your investment objectives, financial situation or particular needs. FP Markets has made every effort to ensure the accuracy of the information as at the date of publication. FP Markets does not give any warranty or representation as to the material. Examples included in this material are for illustrative purposes only. To the extent permitted by law, FP Markets and its employees shall not be liable for any loss or damage arising in any way (including by way of negligence) from or in connection with any information provided in or omitted from this material. Features of the FP Markets products including applicable fees and charges are outlined in the Product Disclosure Statements available from FP Markets website, www.fpmarkets.com and should be considered before deciding to deal in those products. Derivatives can be risky; losses can exceed your initial payment. FP Markets recommends that you seek independent advice. First Prudential Markets Pty Ltd trading as FP Markets ABN 16 112 600 281, Australian Financial Services License Number 286354.


 Access +10,000 financial
instruments
Access +10,000 financial
instruments