
In a holiday shortened-week for the US, Wednesday was a busy one for the macroeconomic space last week.
Flash manufacturing and services PMIs stole the limelight early in Europe, witnessing an upside surprise across the majority of the euro zone PMIs, pointing to a potentially milder contraction.
In the UK, both manufacturing and services PMIs matched the previous readings of 46.2 and 48.8, respectively, beating economists’ forecasts. Chris Williamson, Chief Business Economist at S&P Global Market Intelligence said:
‘A further steep fall in business activity in November adds to growing signs that the UK is in recession, with GDP likely to fall for a second consecutive quarter in the closing months of 2022’.
In the US, however, flash PMIs were softer than expected. The manufacturing PMI fell into contractionary territory to 47.6 from the previous reading of 50.4, considerably lower than the 50.0 consensus estimate. The services reading dropped to 46.1 from 47.8, against 48.0 expected.
During US hours on Wednesday, markets also received the latest FOMC minutes which indicated that a substantial majority of Fed officials support slowing the pace of monetary tightening; markets have largely anticipated this along with many Fed members underlining this point in recent days. This comes after the Fed increased the Fed Funds target range by 75 basis points at its November meeting, its fourth consecutive hike. The minutes also noted that inflation remains ‘stubbornly high’ and more ‘persistent’ than anticipated. For 14 December meeting, Fed Funds futures markets (CME FedWatch Tool) show there is a 75.8% chance the Fed hikes by 50 basis points versus the 24.2% probability of a 75 basis-point hike. Consequently, Fed Chair Powell’s speech on Wednesday will be closely monitored this week.
Week Ahead:
Macroeconomic themes driving the financial markets this week are largely focussed on the US economy. Consumer confidence data is out on Tuesday, ADP non-farm employment change and JOLTS job openings on Wednesday, the core PCE price index (the Fed’s preferred metric) and ISM manufacturing figures on Thursday, with the US employment situation report scheduled on Friday. The speech from US Federal Reserve Chair Jerome Powell on Wednesday will also be closely watched; the topic of his speech is centred on the economic outlook, inflation and the labour market.
Across the pond in Europe, attention will be on Wednesday’s euro area annual inflation.
Markets:
Global equity indices, aside from South Korea’s KOSPI, concluded the week on the front foot. Japan’s Nikkei 225 advanced 1.4%, Germany’s DAX climbed 0.8% and the S&P 500 out of the US rose 1.5%. Month to date, the S&P 500 is 4.0% higher, following October’s spirited 8% advance.
In the currency space, the British pound was a clear outperformer last week, rallying against the majority of its G10 peers. Procyclical currencies: the Australian and New Zealand dollar also outperformed on the week versus most of its G10 counterparts. Safe-haven currencies: the Japanese yen and Swiss franc were ultimately the week’s laggards, with the USD/JPY softening 0.9% and the USD/CHF dropping 1.0%.
For the commodity market, both gold (XAU/USD) and silver (XAG/USD) finished the week higher; silver was a notable outperformer, rallying 2.6%. WTI oil remains under pressure, down 11.4% on the month, and recorded a third successive decline last week (4.5%).
US Treasury yields wrapped up the week lower across the curve. Losses were more prominent in longer maturities; the benchmark 10-year yield declined nearly 4.0% and dipped a toe under 3.70%, falling circa 10 basis points on the week.
Finally, in the cryptocurrency market, bitcoin versus the US dollar (BTC/USD) continues to nurse losses following the FTX fallout, down 0.6% on the week, at the time of writing. Litecoin against the US dollar (LTC/USD), however, staged an impressive comeback and broke north of its multi-month range, rallying more than 20.0%.
Technical Outlook in Key Markets for the Week Ahead
Charts: TradingView
US Dollar: Uptrend or Downtrend?
Through the lens of a technical analyst, the US dollar, according to the US Dollar Index, is at an interesting juncture in terms of the currency’s trend direction.
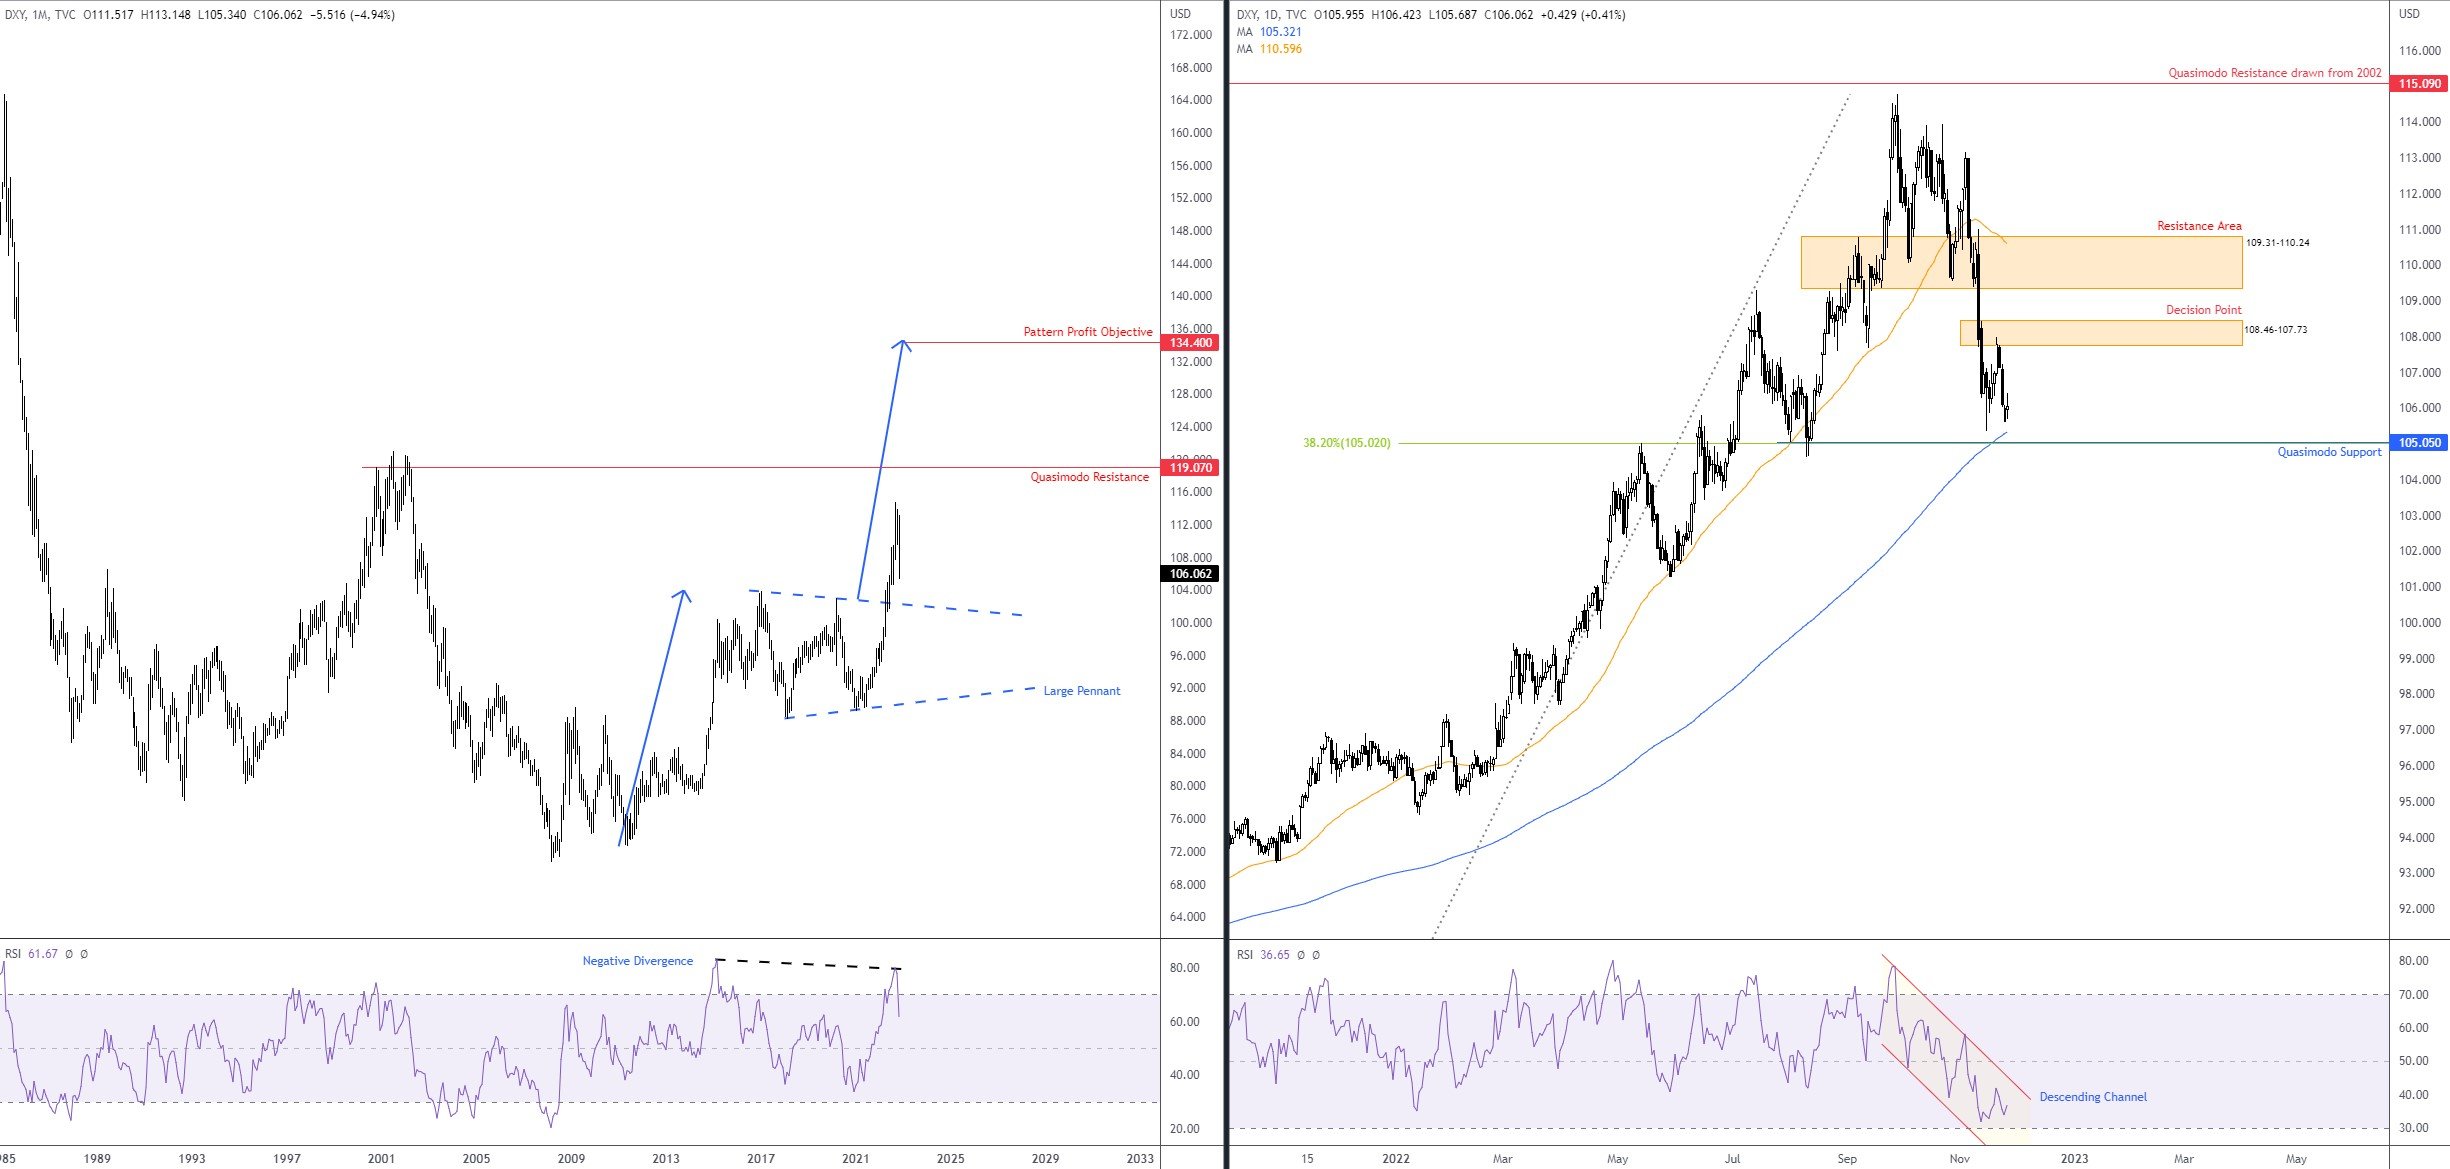
Month to date, the Dollar Index is down 5.0%, its largest one-month fall since 2010 (WTD the Index is lower by 0.9%). Despite the month’s bearish vibe, the trend on the monthly timeframe remains fixed to the upside since bottoming in 2008. Interestingly, though, the daily timeframe recently pencilled in a series of lower lows/highs since price peaked at 114.78 in late September and indicates a downtrend. The caveat here, however, is the dominant uptrend in play since June 2021.
With the clear uptrend visible on the monthly and daily charts, could the recent correction just represent a dip-buying opportunity within the larger uptrend?
Technical support and resistance on the radar this week is seen nearby on the daily timeframe at 105.05: a Quasimodo formation. This is accompanied by a 200-day simple moving average at 105.32 and a 38.2% Fibonacci retracement at 105.02. Overhead, a decision point calls for attention at 108.46-107.73, while beyond this area casts light on a resistance zone at 109.31-110.24 and the 50-day simple moving average at 110.60.
In terms of where the research team stands on the relative strength index (RSI), the monthly chart chalked up negative (bearish) divergence within overbought space in recent months, with the indicator’s value subsequently departing the zone. From the daily chart, the indicator’s line is nearing oversold territory, and remains enclosed within a descending channel, drawn from 78.45 and 47.91. Overall, therefore, momentum to the upside continues to slow, according to this indicator.
As a result of the above analysis, the daily timeframe’s Quasimodo support is likely to be closely monitored this week at 105.05, as well as the 200-day simple moving average. A break swings the technical pendulum in favour of further selling, in line with the downtrend on the daily chart. Alternatively, of course, a rebound from the aforementioned support area adds weight to buying, consistent with the longer-term uptrend on both monthly and daily charts.
 Oil (WTI): Double-Top Profit Objective in Sight
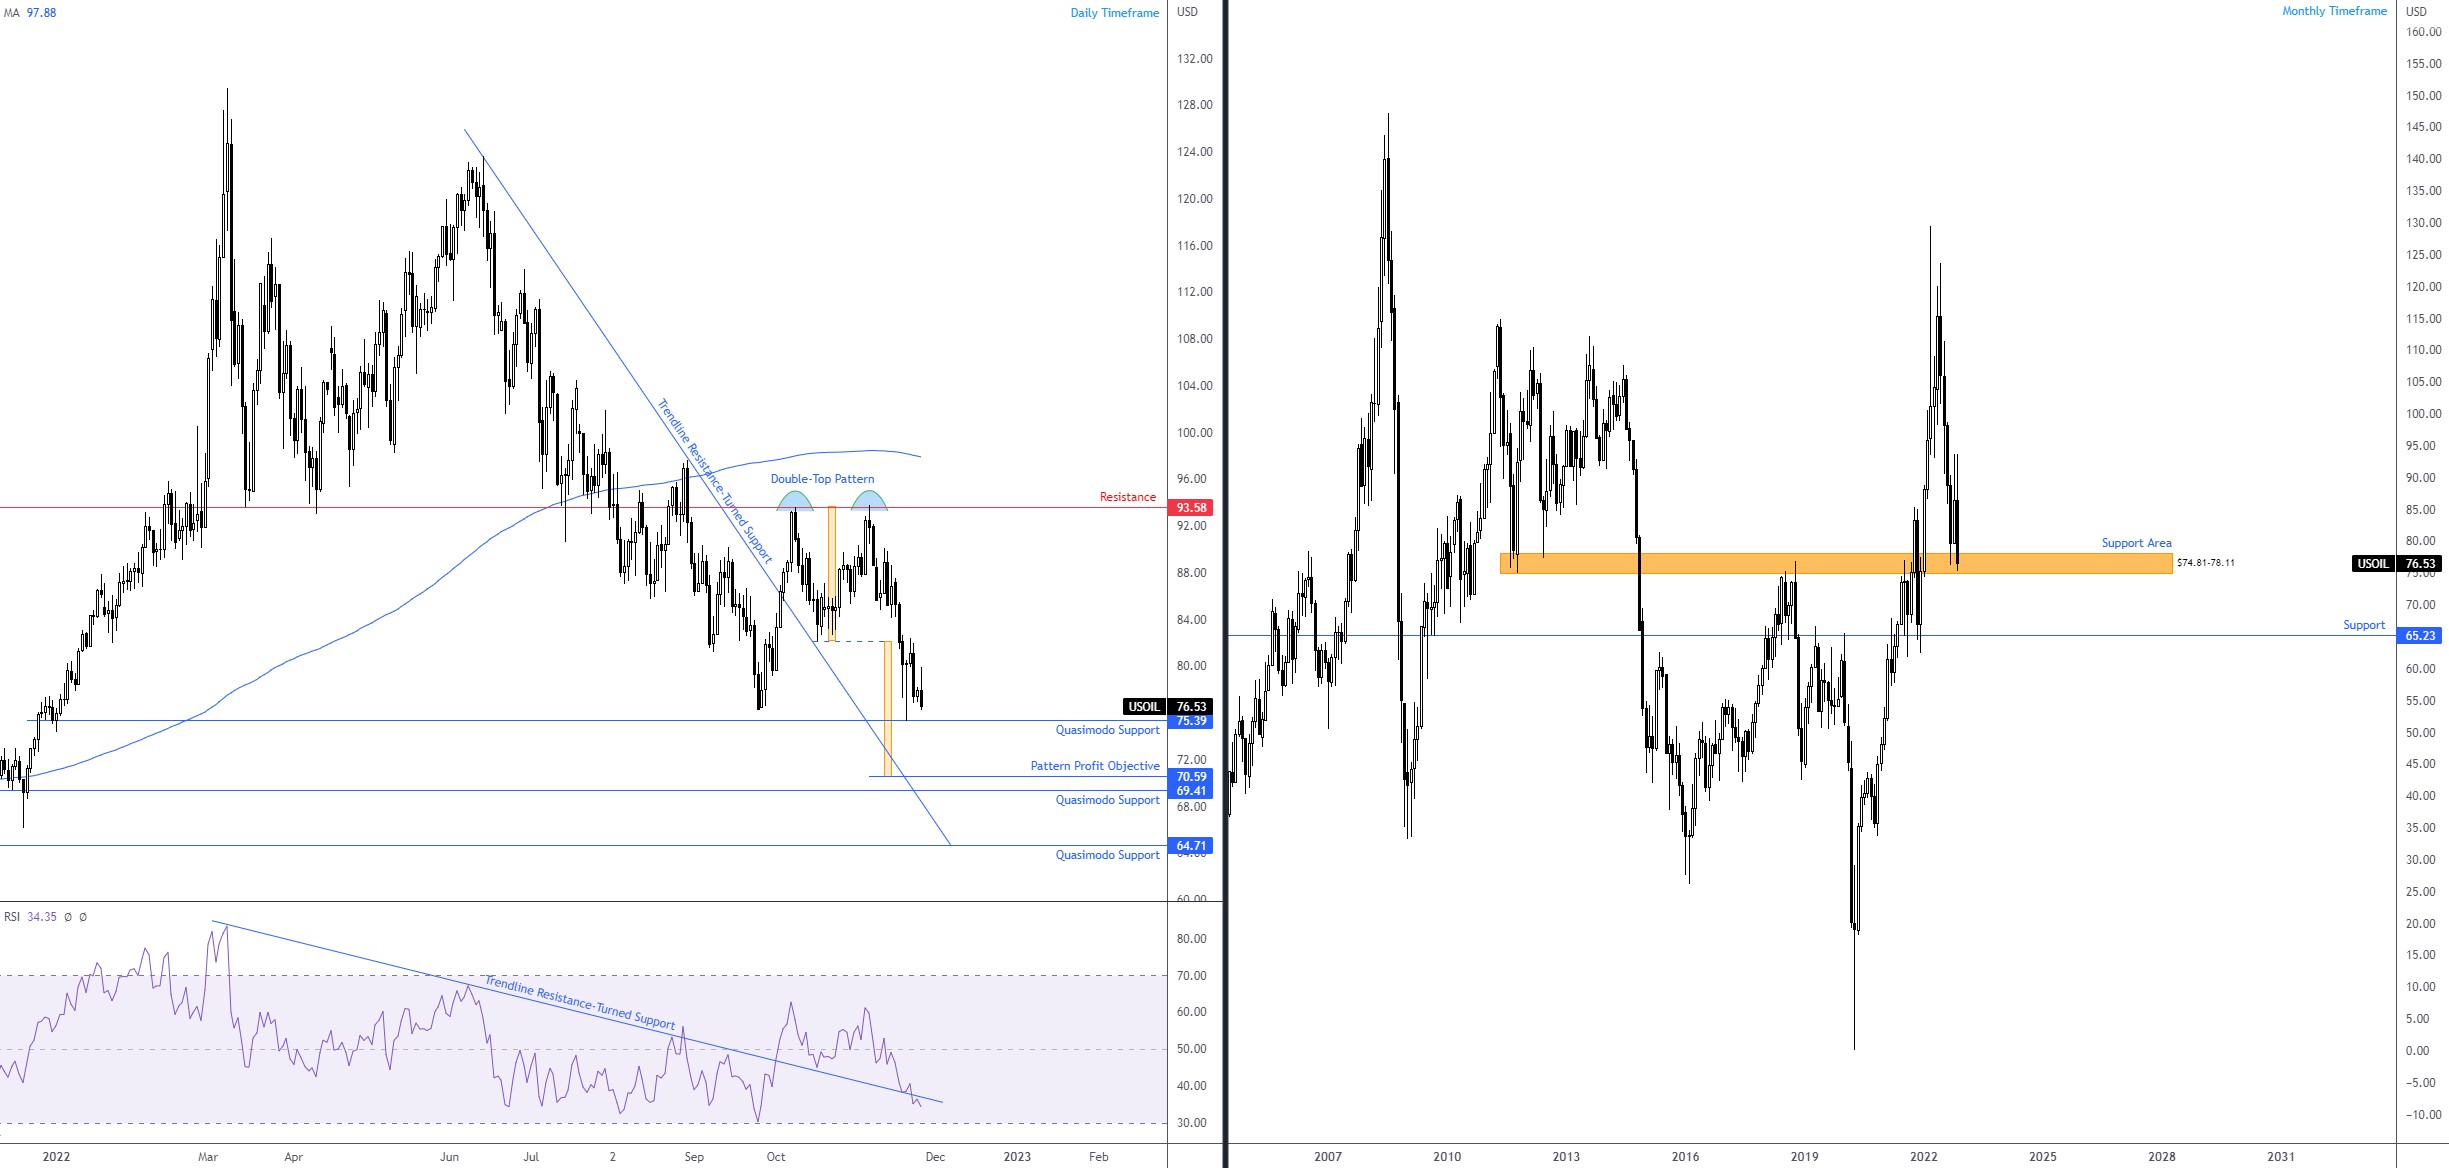
It has been quite the rollercoaster for oil prices in 2022. Year to date, WTI is trading 0.5% higher. This follows a heavy-handed ascent in Q1 and early Q2 to a high of $129.42, followed by a decline to near-unchanged levels in Q4. The price of oil carved out a third consecutive loss last week, shedding 4.5%. Month to date, WTI is down 11.4% and currently trading near session lows.
For those who read our research regularly, you may recall that the research team highlighted this market’s technical position last week, which remains valid heading into this week’s session:
Price action on the monthly timeframe is shaking hands with long-term support from $74.81-78.11. The month of October did witness price attempt to secure some grip from the aforementioned area, though slipped in November leaving a bold question mark on the zone in December. Dropping beneath here draws light to support from $65.23.
Noting that monthly support is potentially fragile, the daily timeframe forging a fresh lower low and completing a double-top pattern from resistance at $93.58 is likely to draw attention. The neckline ($82.10) for the pattern experienced a breach on 18 October, leading to a Quasimodo support level entering the fight at $75.39. Though considering the lacklustre bid seen from the level (the hammer candlestick reaction failed to persuade buyers and instead appears to have trapped those who entered on a buy-stop above the hammer pattern’s high), technical studies suggest further selling could be on the table in this market this week. This is corroborated by the non-existent response from the relative strength index (RSI) trendline resistance-turned support, taken from the high 83.24.
Therefore, a break of $75.39 on the daily scale could inspire breakout selling in the direction of $70.59.
XAU/USD: Monthly Double-Top; Daily Downtrend
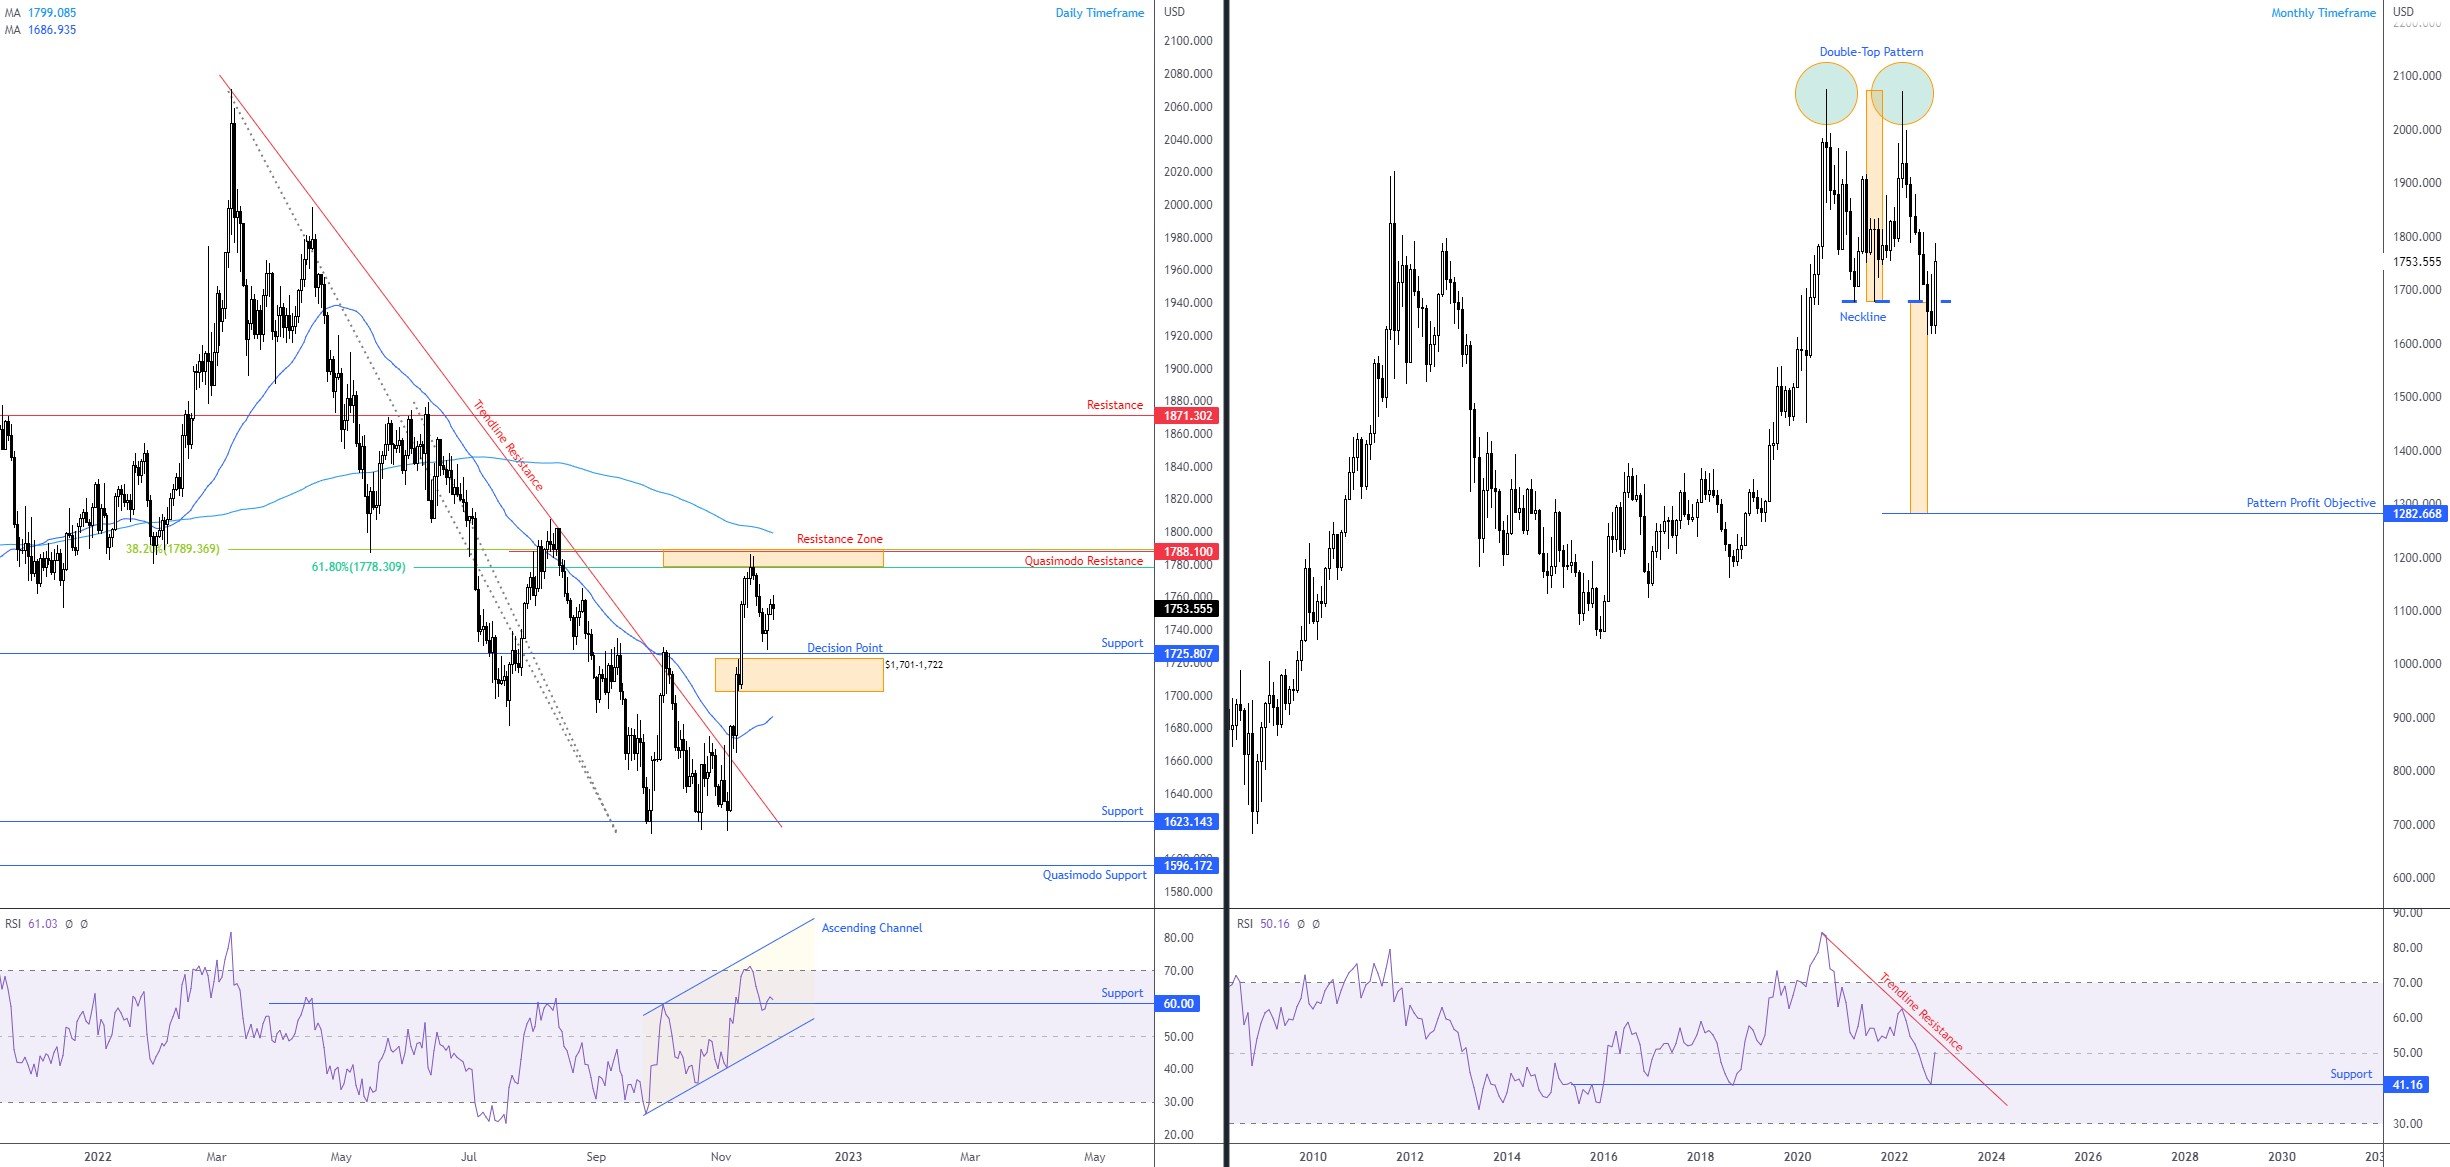
Despite the price of gold rallying an impressive 7.3% month to date, chart pattern enthusiasts will note the monthly timeframe’s double-top pattern, pinned between peaks at $2,075 and $2,070. Also of technical relevance is that the pattern’s neckline ($1,676) was breached in September, a move that permits technicians to chart the pattern’s profit objective as far south as $1,1282. This, given the lower low beyond $1,676, also informs market participants that the yellow metal is in the early stages of a potential long-term downtrend. Referring to the monthly chart’s relative strength index (RSI), we can see the indicator is testing the underside of the 50.00 centreline, following a rebound from indicator support at 41.16. Note that 50.00 is sheltered just under indicator trendline resistance, drawn from the high 84.21.
A closer reading of price action on the daily timeframe has buyers and sellers battling for position between resistance at $1,789-1,778 (composed of two Fibonacci ratios and a Quasimodo resistance at $1,788) and a nearby support from $1,725 (and decision point from $1,701-1,722). Outside of the aforementioned areas, the 200-day and 50-day simple moving averages are seen at $1,799 and $1,686, respectively. In terms of trend, the research team noted in recent analysis that although price breached trendline resistance (etched from the high $2,070), closing beyond 10 August high at $1,807 is likely required to validate a trend reversal as per price structure. Out of the relative strength index (RSI), the indicator’s value tagged the lower side of overbought space in recent trading (leaving indicator channel resistance [drawn from the high 59.51] untouched) and is now testing the mettle of indicator support coming in at 60.00.
Considering the noted chart studies, sellers still appear in control for the time being. To increase bearish conviction, sliding beneath the daily decision point at $1,701-1,722 and the 50-day simple moving average would likely be a welcomed sight for gold bears. Alternatively, another test of daily resistance at $1,789-1,778 (which draws in the 200-day simple moving average) could be something we see sellers embrace this week.
 GBP/USD: Third Consecutive Weekly Gain; Further Buying Until $1.22?
While sterling has posted impressive outperformance against the US dollar in recent months, the currency pair GBP/USD remains 10.6% lower, year to date.
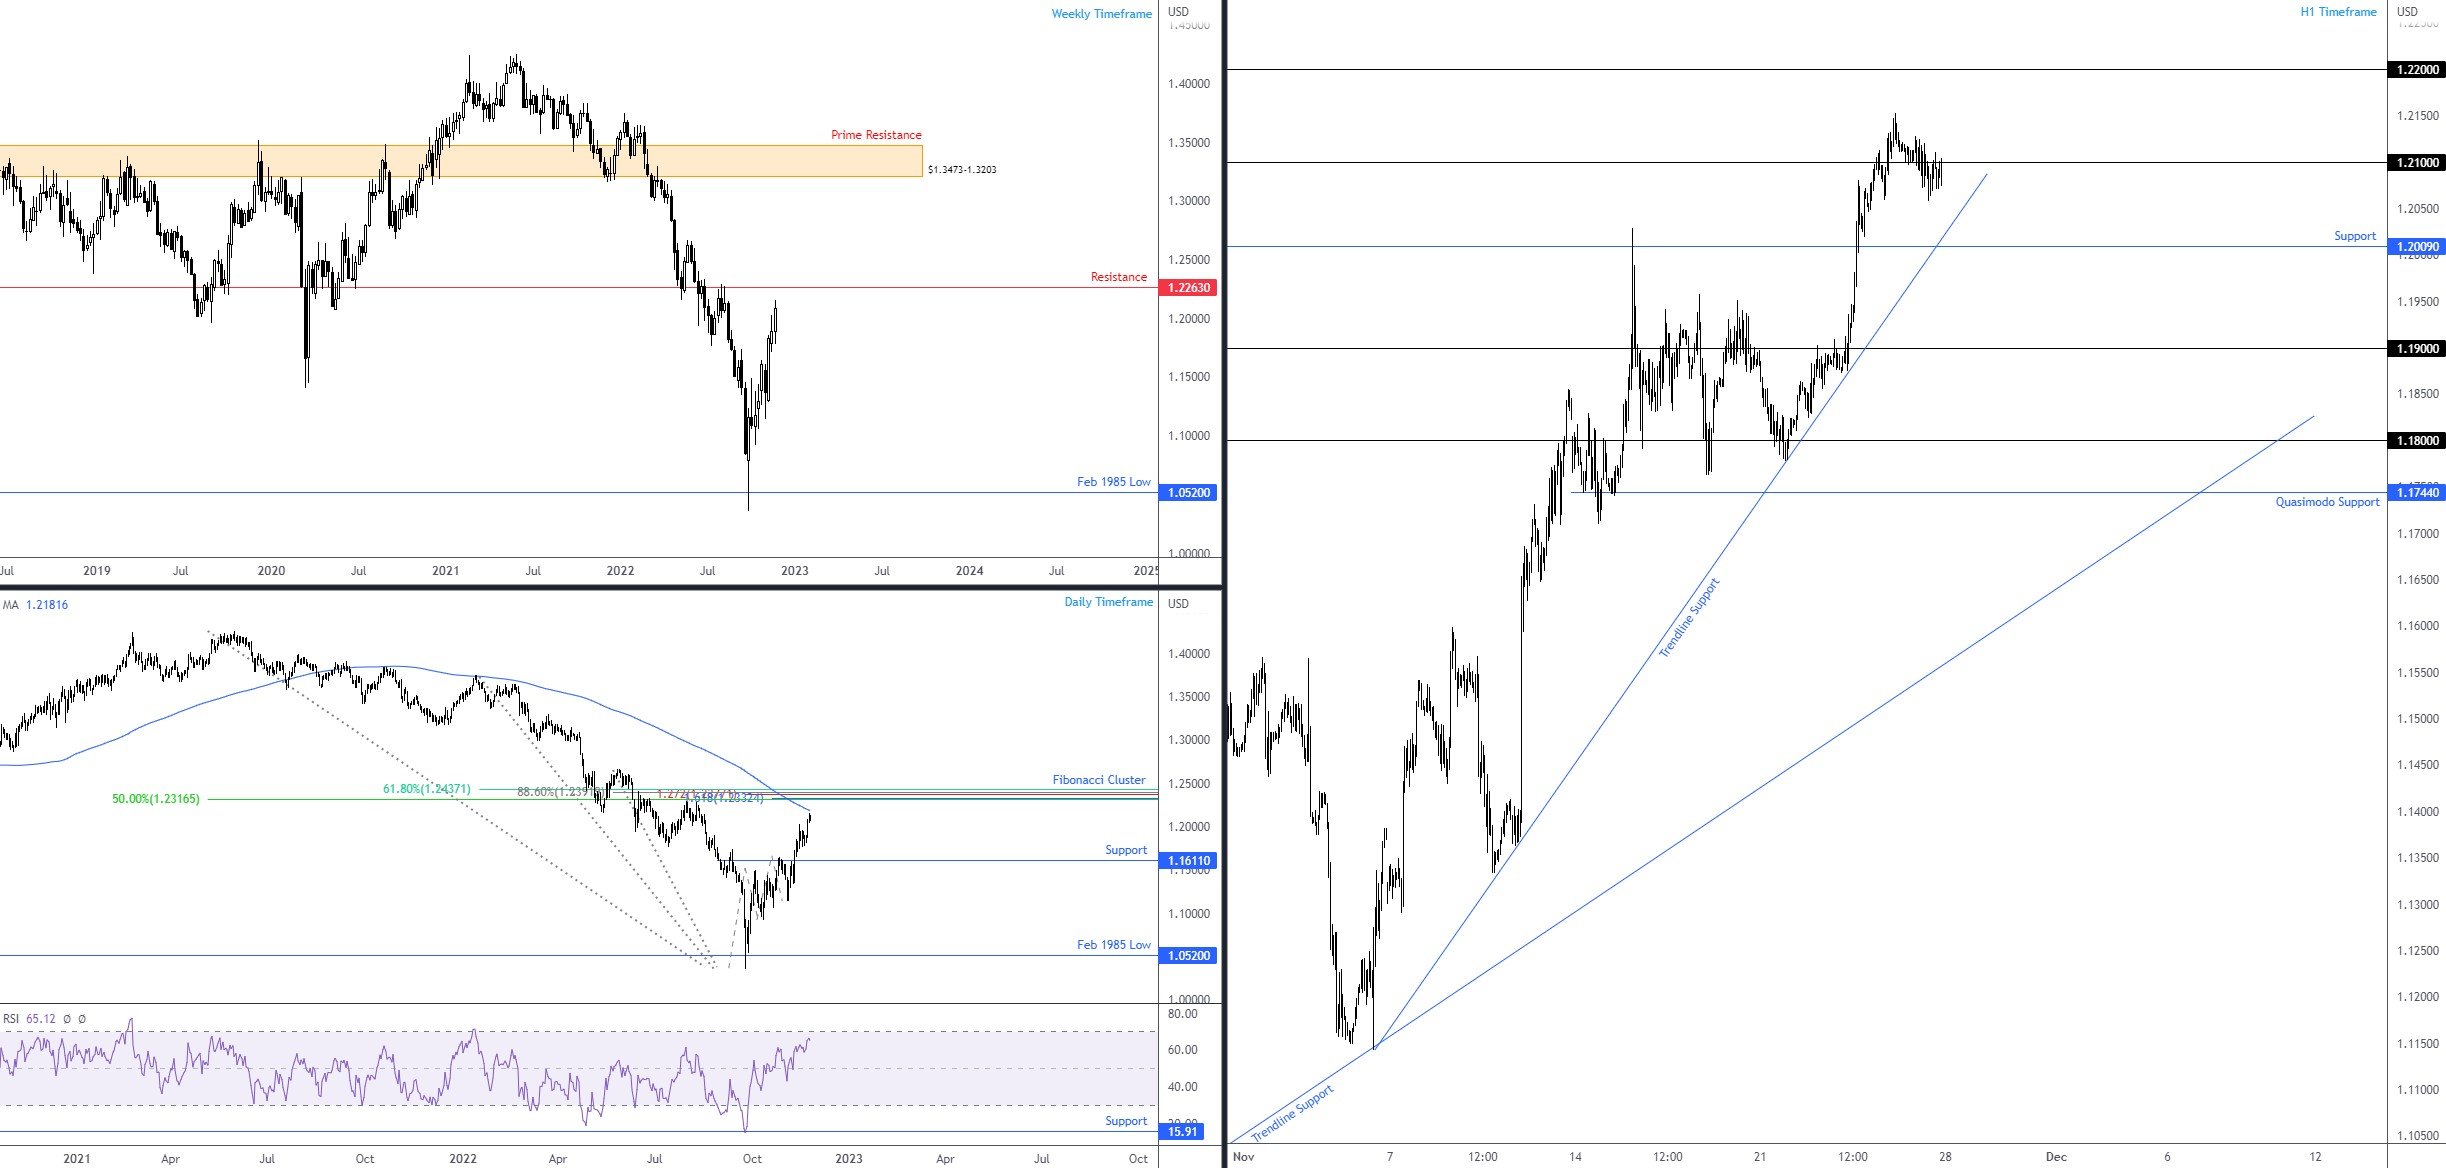
Following the record low of $1.0357 in late September, a spirited pullback has emerged, rallying nearly 17.0%. Albeit impressive, the longer-term trend direction on the weekly timeframe has faced south since early 2021. Directly above, resistance warrants consideration at $1.2263 this week, a level boasting historical significance since late 2019.
Out of the daily timeframe, the central technical feature this week is the widely watched 200-day simple moving average, currently fluctuating around $1.2182. Equally impressive is the neighbouring Fibonacci cluster between $1.2317 and $1.2437 (note that the 50.0% retracement is not a Fibonacci ratio), which happens to reside just north of the weekly resistance at $1.2263. Chartists who employ the relative strength index (RSI) may also acknowledge the indicator nearing overbought territory, following a retest of the 50.00 centreline in early November.
Across the page on the H1 timeframe, the $1.21 psychological figure came under attack on Friday. Given the lack of volatility, this was likely a painful experience for those attempting to fade or trade the breakouts of this number (bull and bear traps should come to mind). Beneath $1.21, trendline support (taken from the low $1.1142) and support from $1.2009 are visible, while a run to the upside could take aim at $1.22 (merges closely with the 200-day simple moving average on the daily timeframe [$1.2182]).
According to the chart studies shown here, buyers appear to have the upper hand this week at least until shaking hands with the area between the $1.22 figure and the 200-day simple moving average at $1.2182.
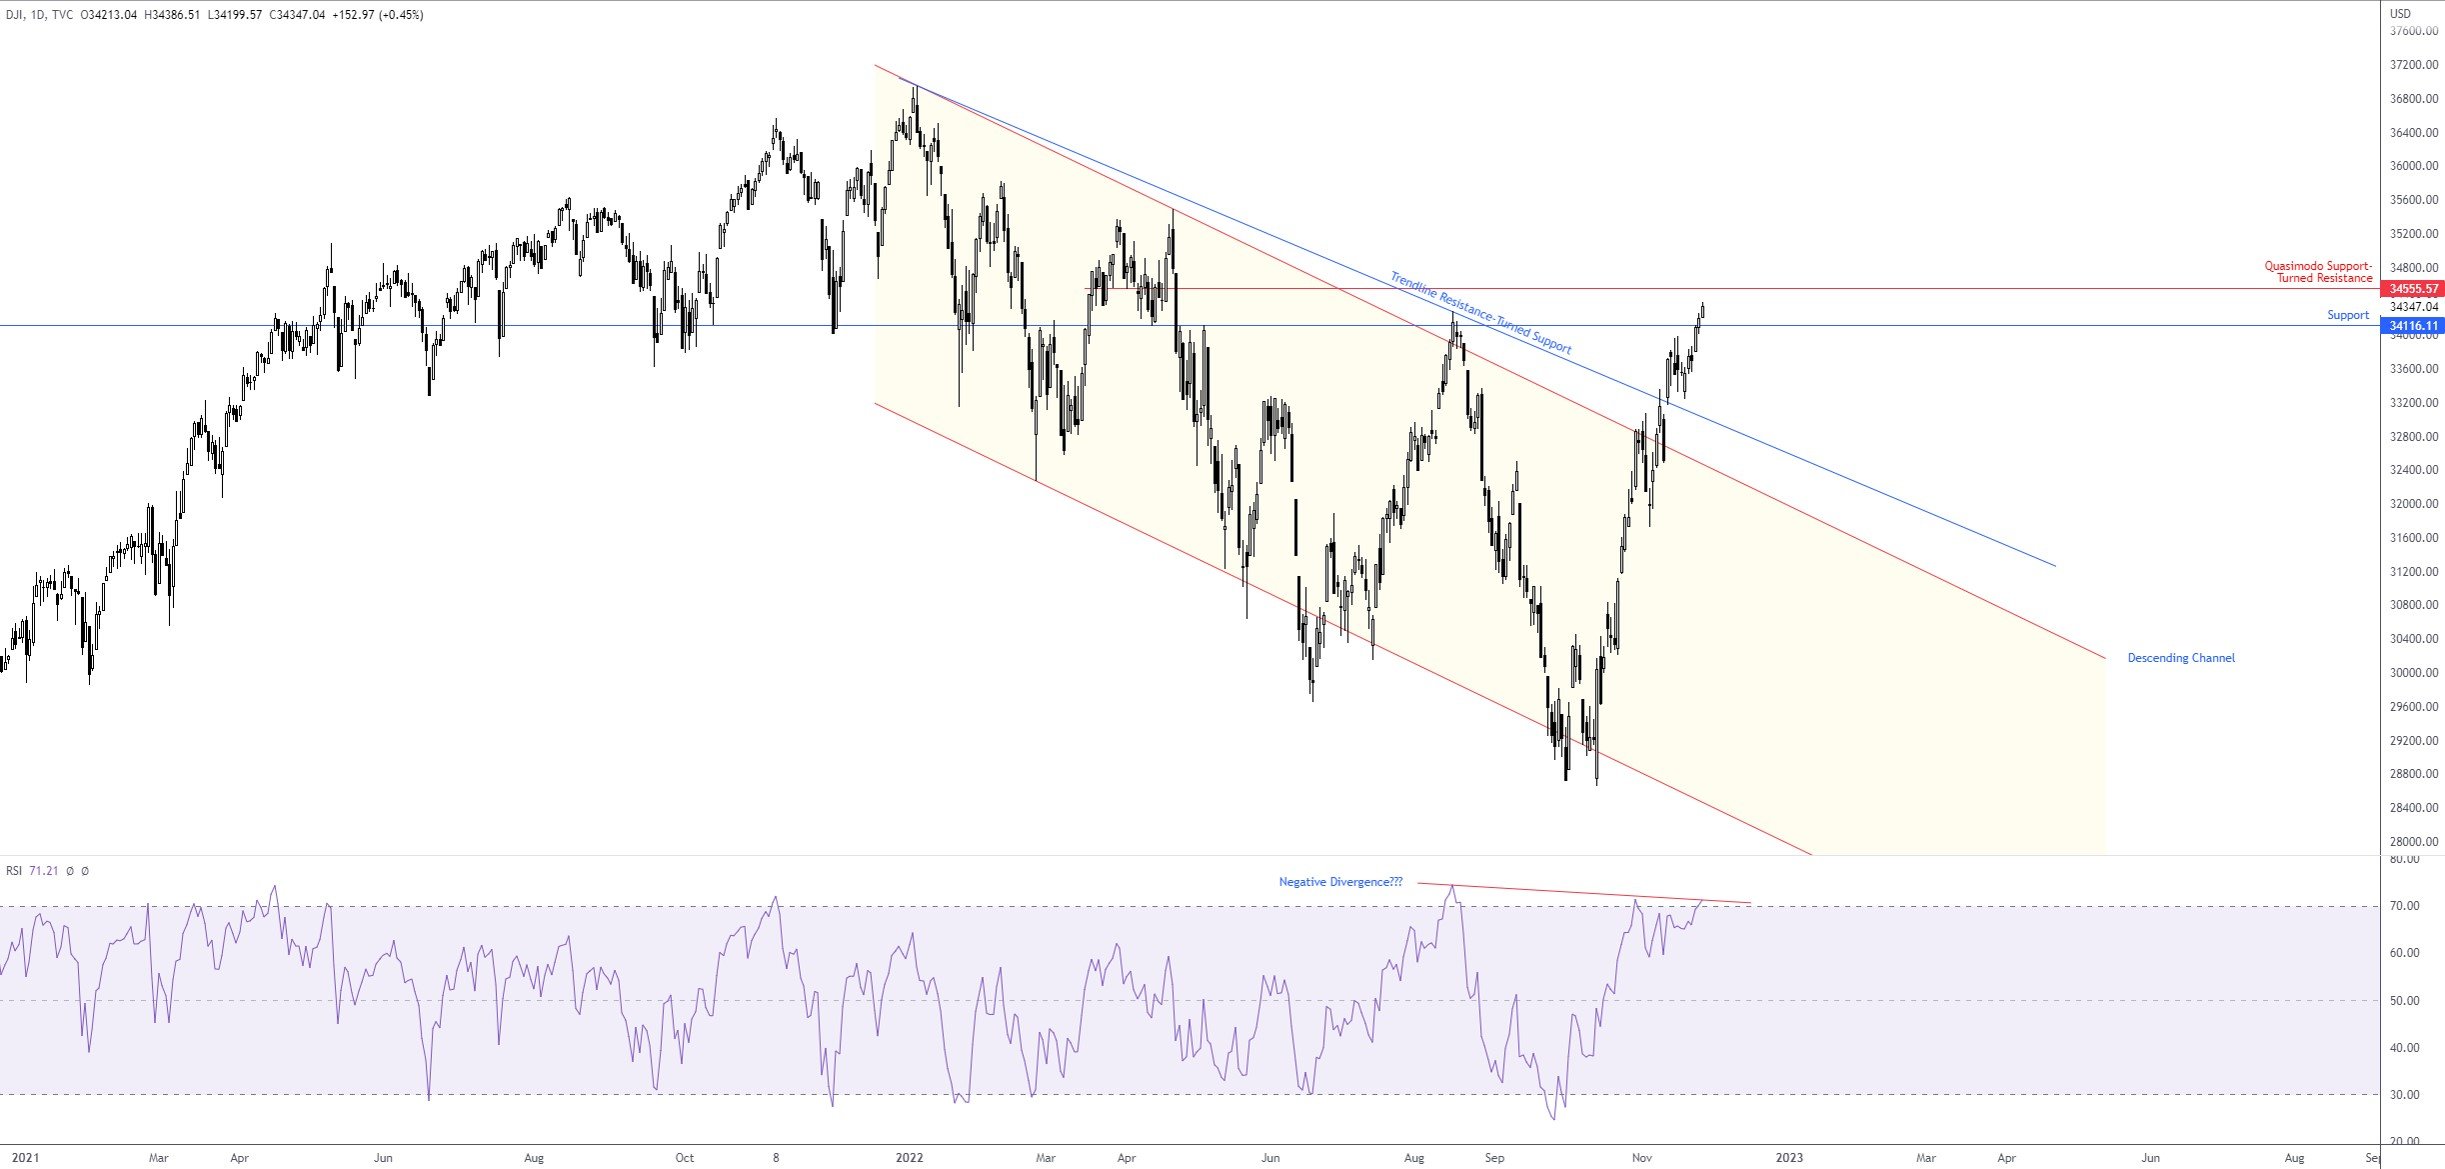
 Dow Jones Industrial Average
Daily Timeframe
Aside from 1 week of trading, the Dow has impressively finished each week in positive territory since bottoming at 28,660 in October. Month to date, the average is 4.9% higher, following October’s 14.0% gain.
Technical resistance is nearing at 34,555 (a Quasimodo support-turned resistance formation), following Friday rupturing 16 August high at 34,281. The buy-stops likely triggered above the aforementioned high may entice larger sellers into the market from 34,555 this week, attempting to fade buy-stop momentum. What Friday’s movement has also drawn attention to is the relative strength index (RSI) echoing potential negative divergence within overbought space.
As a result of the above, should price action cross swords with 34,555 this week and a bearish scenario unfolds, support at 34,116 is likely to be initially targeted, followed by trendline resistance-turned support, extended from the high 36,952.
 DISCLAIMER:
The information contained in this material is intended for general advice only. It does not take into account your investment objectives, financial situation or particular needs. FP Markets has made every effort to ensure the accuracy of the information as at the date of publication. FP Markets does not give any warranty or representation as to the material. Examples included in this material are for illustrative purposes only. To the extent permitted by law, FP Markets and its employees shall not be liable for any loss or damage arising in any way (including by way of negligence) from or in connection with any information provided in or omitted from this material. Features of the FP Markets products including applicable fees and charges are outlined in the Product Disclosure Statements available from FP Markets website, www.fpmarkets.com and should be considered before deciding to deal in those products. Derivatives can be risky; losses can exceed your initial payment. FP Markets recommends that you seek independent advice. First Prudential Markets Pty Ltd trading as FP Markets ABN 16 112 600 281, Australian Financial Services License Number 286354.


 Access +10,000 financial
instruments
Access +10,000 financial
instruments