
US Dollar Index:
Up 0.1%, the US dollar index put an end to an eight-week losing streak in recent trading, technically sponsored by support at 92.26, an active level since late 2017. Also providing additional impetus is a medium-term bear flag (between 95.72/97.45) take-profit target at 92.71, calculated by measuring the preceding move and adding the value to the breakout point (pink).
Traders with a focus on momentum-based indicators will also acknowledge the RSI oscillator exited oversold space and produced bullish divergence.
Looking ahead, supply at 94.02/93.56 could pose a problem for buyers this week, while clearance of the aforesaid zone potentially unearths trendline resistance (100.56), a level located nearby resistance at 95.03. Above here, traders have another layer of resistance at 95.84 to look forward to, joined closely with a longer-term trendline resistance (102.99).
Concerning the 200-day simple moving average, currently circling 97.67, the dynamic value continues to curve lower, two years after mostly drifting higher.

EUR/USD:
Monthly timeframe:
(Technical change on this timeframe is often limited though serves as guidance to potential longer-term moves)
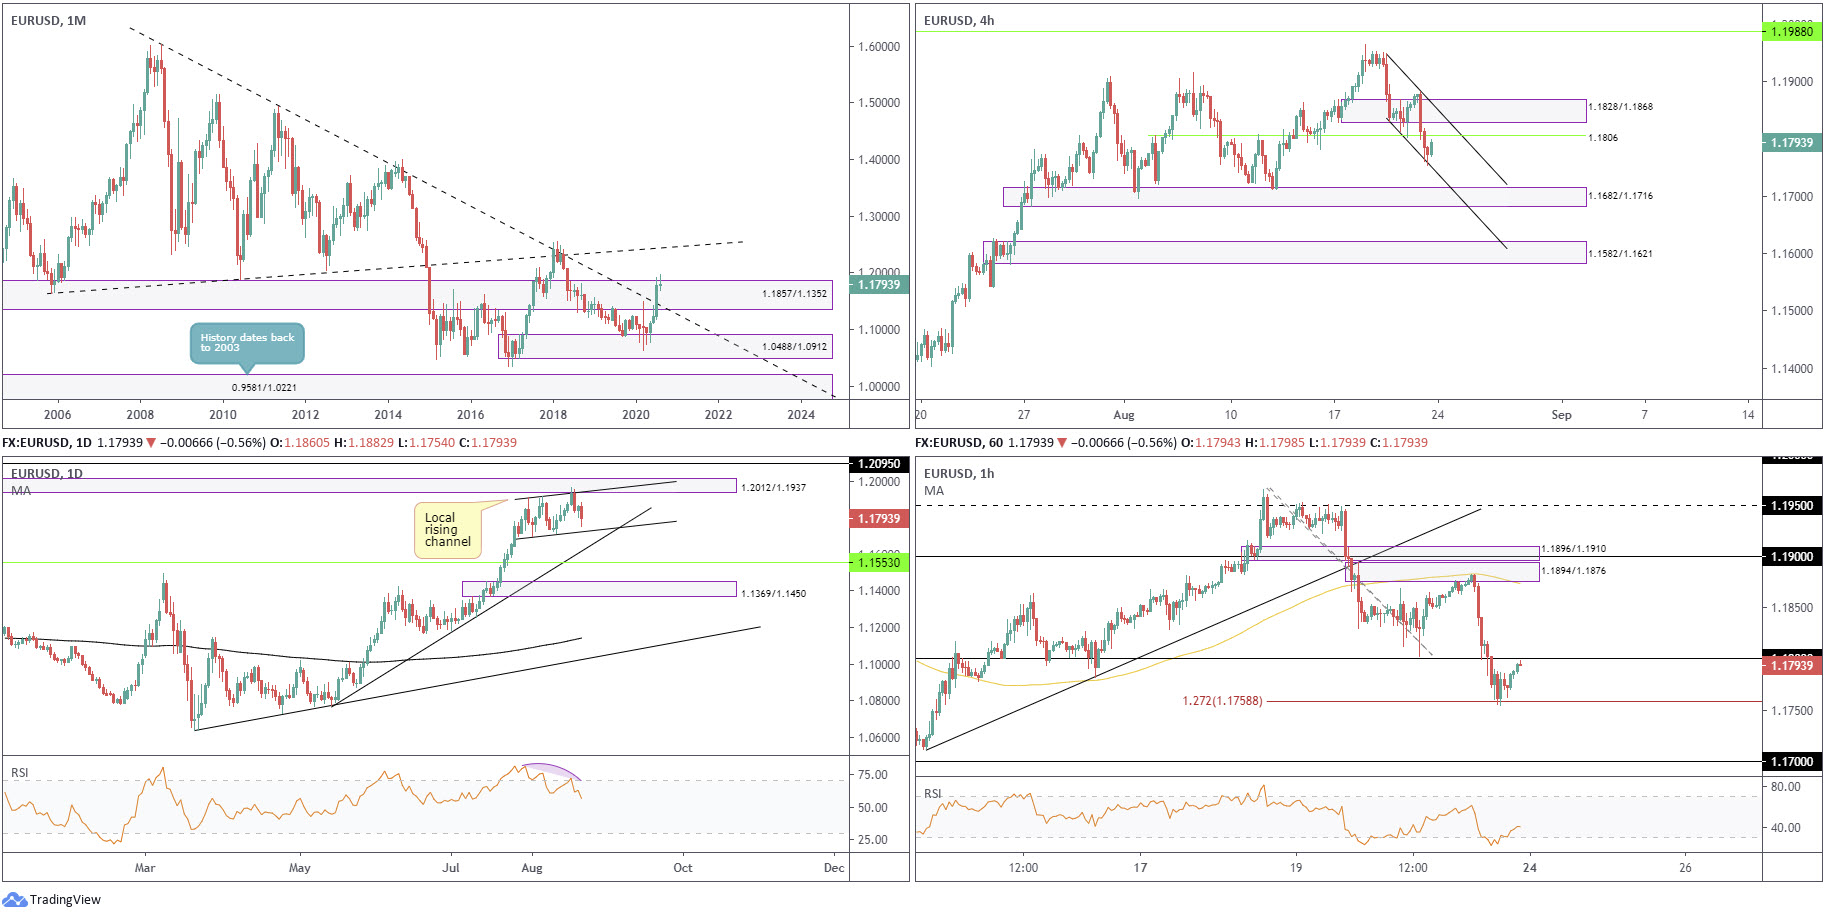
The euro nudged to a third successive monthly gain against the US dollar in July, adding nearly 5 percent. The move toppled long-term trendline resistance (1.6038) and made contact with the upper border of supply from 1.1857/1.1352.
This argues a move to the upside may be on the horizon, with trendline resistance (prior support – 1.1641) on the radar as the next target.
Also worth noting, though, is the primary downtrend (since July 2008) remains intact until 1.2555 is engulfed (Feb 1 high [2018]).
August, as you can see, has been relatively lacklustre, currently up by 0.2 percent.
Daily timeframe:
Efforts to extend July’s advance have been contained within a channel pattern (1.1695/1.1909) on the daily timeframe, in addition to supply at 1.2012/1.1937 recently making an entrance, extended from May 2018.
Trendline support (1.0774) could welcome price movement this week should a break lower come to pass, while immersing the aforesaid supply points to resistance at 1.2095.
The RSI indicator, since the beginning of August, has drifted lower and exited overbought space, consequently producing bearish divergence.
H4 timeframe:
Thursday’s rebound from support at 1.1806 failed to unearth much interest from buyers, leading to a decisive sell-off materialising Friday.
1.1806 and supply at 1.1828/1.1868, as well as a channel formation (1.1950) offer resistance to work with in early trade this week. To the downside, a familiar rally-base-rally demand area at 1.1682/1.1716 is also present, together with channel support (1.1812).
H1 timeframe:
Softer-than-expected Eurozone PMIs led EUR/USD lower from fresh supply at 1.1894/1.1876 (highlighted in recent analysis) Friday, an area sharing its range with a 100-period simple moving average.
The sell-off penetrated 1.18 and reached for lows at 1.1754, consequently testing a 127.2% Fib ext. level at 1.1758 heading into US trading. The pair, as you can see, mildly pared losses into the close, gifting a near-1.18 retest and pulling the RSI value to within close proximity of its 50.00 centreline.
Structures of Interest:
Long term:
Monthly price breaching supply and closing above a major trendline resistance is significant, despite August’s lacklustre response.
We are, however, seeing signs of upside momentum diminishing on the daily timeframe, confined within a channel pattern and hindered by supply. This may call for a dip to lower terrain before fresh buyers attempt to join the immediate uptrend (seen clearly on the daily timeframe). Yet, do remain aware the primary trend faces south (see monthly chart).
Short term:
With the H4 timeframe threatening a retest at resistance from 1.1806, along with room to press towards demand at 1.1682/1.1716, a 1.18 retest on the H1 in early trading today could stir sellers and potentially submerge 1.1758 (127.2% Fib ext.) and print an intraday move towards the 1.17 region.
AUD/USD:
Monthly timeframe:
(Technical change on this timeframe is often limited though serves as guidance to potential longer-term moves)
May’s extension, together with June and July’s follow-through, witnessed supply at 0.7029/0.6664 and intersecting long-term trendline resistance (1.0582) abandon its position.
Concluding July higher by 3.5 percent, buyers, despite August’s failure to build on recent upside, appear free to explore as far north as 0.8303/0.8082 in the coming months, a supply zone aligning closely with trendline resistance (prior support – 0.4776).
Although price has removed trendline resistance, the market’s primary trend (since mid-2011) remains south until breaking 0.8135 (January high [2018]).
Daily timeframe:
Brought forward from previous analysis –
Since mid-June, the pair has been compressing north between two converging trendlines (0.6832/0.7064), in what appears to be a rising wedge. Of late, price tumbled just ahead of supply at 0.7346/0.7282, leading to a test of the rising wedge base Thursday/Friday.
A break below the aforesaid rising wedge this week may have dips find initial support around the 0.7067 region.
H4 timeframe:
Partially altered from previous analysis –
Trendline support (0.7076) provided a floor to work with in the second half of the week, following Wednesday’s support breach at 0.7237.
Should buying prove unsustainable, probing to trendline support (0.6776) may emerge, an ascending line displaying a close connection with another local trendline support (prior resistance – 0.7243).
H1 timeframe:
The beginnings of a range is currently shaping on the H1 chart between the 0.72 level (and 100-period simple moving average) and the 0.7150 support. Outside of this area, supply at 0.7236/0.7222, a clear-cut drop-base-drop zone, is seen, whereas stepping to lower terrain throws light on demand at 0.7105/0.7118.
Structures of Interest:
Long term:
The higher timeframe picture currently offers mixed signals.
- Monthly price is attempting to secure ground north of supply at 0.7029/0.6664.
- Daily candles are in the process of forming a rising wedge pattern, a potential reversal formation.
Short term:
Friday’s mild end-of-day rebound from H4 trendline support (0.7076), an ascending line that aligns with the edge of 0.7150 support on the H1, may interest bullish strategies early trade. This is also in line with monthly structure, and the immediate trend based on the daily timeframe.

USD/JPY:
Monthly timeframe:
(Technical change on this timeframe is often limited though serves as guidance to potential longer-term moves)
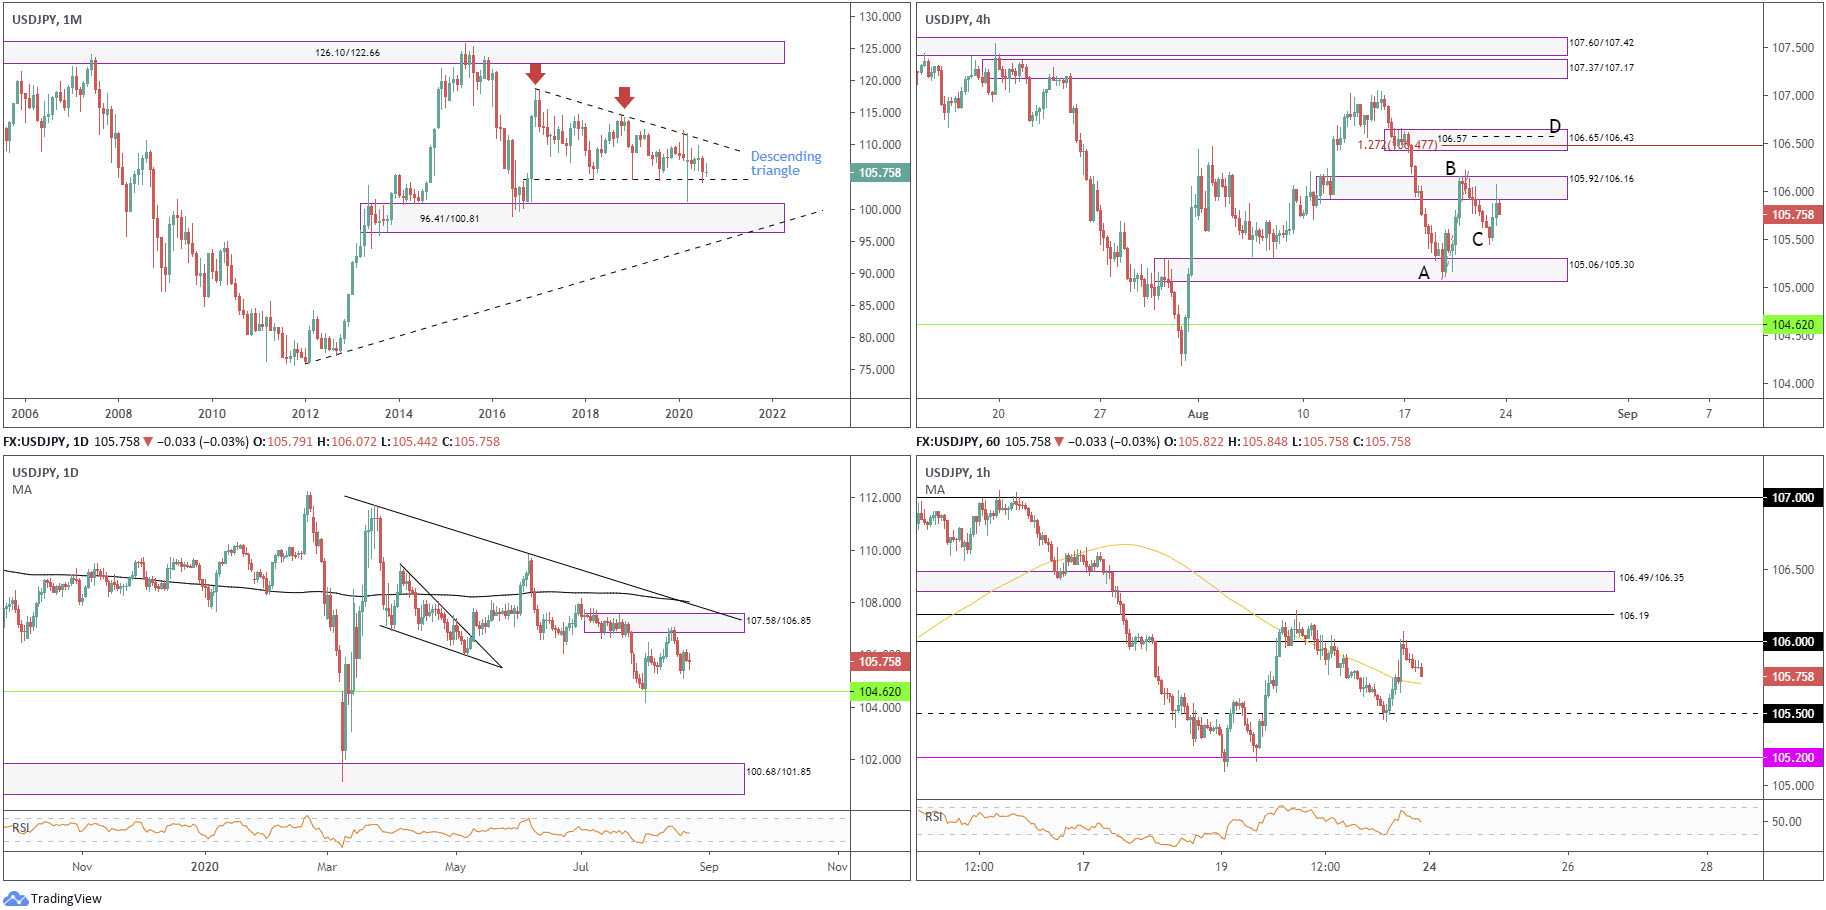
Since kicking off 2017, USD/JPY has been carving out a descending triangle pattern between 118.66/104.62.
April, May and June were pretty uneventful, with the latter wrapping up indecisively in the shape of a neutral doji candlestick pattern. July, nonetheless, sunk nearly 2 percent, testing the lower boundary of the descending triangle, while August currently trades lower by 0.10 percent.
Areas outside of the noted triangle can be seen at supply from 126.10/122.66 and demand coming in at 96.41/100.81.
Daily timeframe:
Partially altered from previous analysis –
Buyers and sellers are currently squaring off mid-range between supply from 107.58/106.85 and support at 104.62, taken from the monthly timeframe (descending triangle support). It should also be noted Friday finished by way of what appears to be a neutral doji indecision candle.
A push north this week may take on trendline resistance (111.71) and the 200-day simple moving average at 108.02, though beyond the monthly level we see limited support until reaching demand at 100.68/101.85, drawn from 2016.
H4 timeframe:
Supply at 105.92/106.16 (prior demand) greeted price movement in recent trading. Thursday’s mild breach, coupled with a relatively non-committal tone from sellers so far, implies we’re likely to leave demand at 105.06/105.30 (prior supply) behind and forge an advance to supply at 106.65/106.43 this week. Held within the aforesaid area, technicians will note an ABCD pattern completes at 106.57, cushioned further by a 127.2% Fib ext. level at 106.47.
H1 timeframe:
Price action, as you can see, embraced the 106 level during US trading Friday, following a break of the 100-period simple moving average. Leaving resistance at 106.19 unopposed, movement faded session peaks at 106.07 to close the week out within touching distance of the noted 100-period simple moving average.
In terms of the RSI value, the week ended crossing back under the 50.00 centre line.
Structures of Interest:
Long term:
Recently connecting with monthly support at 104.62, daily supply at 107.58/106.85 may, once again, come under fire this week, possibly also pulling in trendline resistance (111.71).
Short term:
H4 supply at 105.92/106.16 echoes a delicate tone right now, indicating a move higher to H4 supply at 106.65/106.43 could be seen. This, alongside monthly support seen in the frame, could have H1 defend the 100-period simple moving average as support in early trading to run for H1 resistance at 106.19 and H1 supply at 106.49/106.35 (glued to the underside of H4 supply at 106.65/106.43).
GBP/USD:
Monthly timeframe:
(Technical change on this timeframe is often limited though serves as guidance to potential longer-term moves)
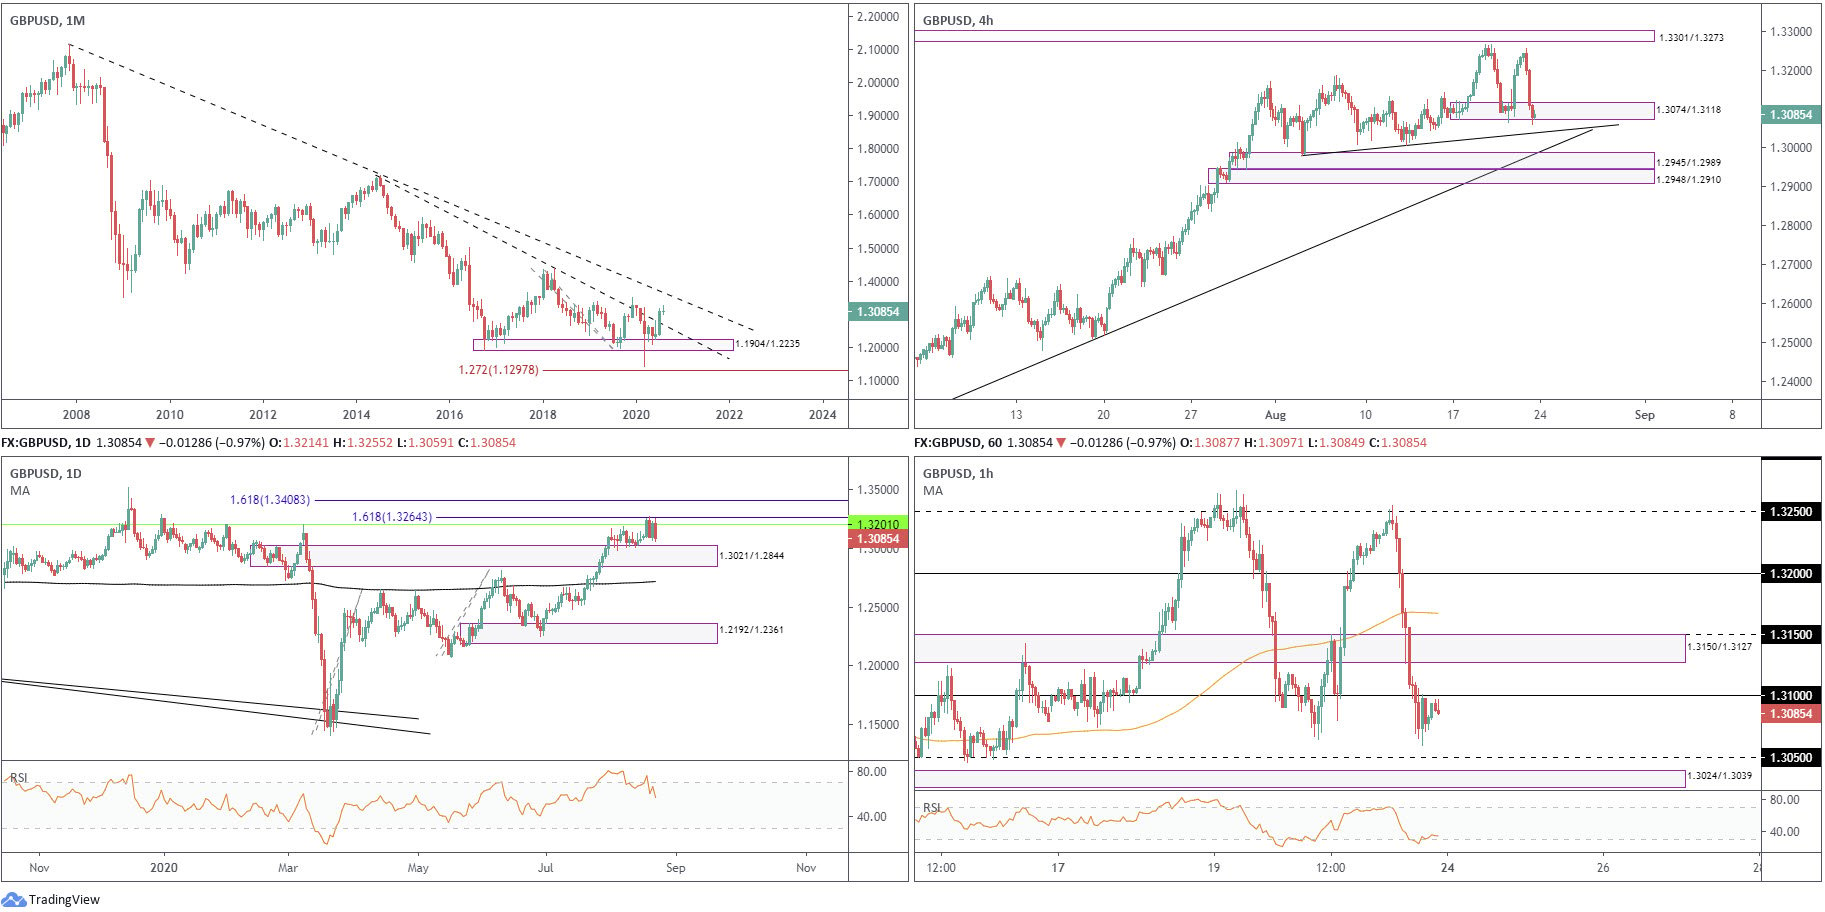
GBP/USD finished higher by 5.5 percent in July, leading to long-term trendline resistance (1.7191) vacating its position.
Despite the primary trend facing lower since early 2008 (unbroken until 1.4376 gives way – April 2 high [2018]), the break of current trendline resistance could have buyers work towards another prominent trendline resistance (2.1161) over the coming weeks.
August currently trades unchanged.
Daily timeframe:
Resistance at 1.3201, along with a 161.8% Fib ext. level at 1.3264, remains in play on the daily timeframe, welcoming price action heading into mid-week trade. Note we also have another 161.8% Fib ext. level at 1.3408 to work with in the event of moves higher. 1.3021/1.2844 is stationed nearby as demand, with a violation uncovering the 200-day simple moving average at 1.2717.
As you can see, buyers and sellers emphasise an uncertain tone right now. On one side, sellers are defending the aforesaid structures, while on the other side of the field buyers are hoping to extend the immediate trend, set in March.
H4 timeframe:
Demand at 1.3074/1.3118 appears to be hanging on by a thread right now, with its lower border giving way on two occasions into the second half of the week.
This throws light on trendline support (1.2981), with a break turning attention to another trendline support (1.2259) that intersects with an area of stacked demand between 1.2948/1.2910 and 1.2945/1.2989. Traders may also want to note this area inhabits daily demand at 1.3021/1.2844.
H1 timeframe:
A dominant sell-off unfolded from 1.3250 resistance in the early stages of European trading Friday, stripping a number of key technical supports, including 1.32 and, heading into the US session, the 1.31 base. 1.31, as you can see, swiftly re-entered the frame as resistance after mildly paring losses ahead of 1.3050 support.
With the RSI indicator recently exiting oversold territory, breaking 1.31 and reaching for supply at 1.3150/1.3127 may be seen. Dipping from 1.31, on the other hand, has 1.3050 calling for attention, together with nearby demand at 1.3024/1.3039. This is a reasonably important zone, representing an area where a decision was made to take the currency pair above 1.3050 and local peaks around 1.3067.
Structures of Interest:
Long term:
Though monthly price indicates scope to navigate territory north of current price, daily resistance at 1.3201 and the daily 161.8% Fib ext. level at 1.3264 currently hinder upside attempts.
Short term:
Drawing lower from either the 1.31 level or supply at 1.3150/1.3127 on the H1 is a possibility this week, having noted H4 demand at 1.3074/1.3118 offering a weak vibe and daily price fading resistance at 1.3201. Support targets fall in at the 1.3050 region, followed by H1 demand at 1.3024/1.3039 and then the upper edge of daily demand at 1.3021.
DISCLAIMER:
The information contained in this material is intended for general advice only. It does not take into account your investment objectives, financial situation or particular needs. FP Markets has made every effort to ensure the accuracy of the information as at the date of publication. FP Markets does not give any warranty or representation as to the material. Examples included in this material are for illustrative purposes only. To the extent permitted by law, FP Markets and its employees shall not be liable for any loss or damage arising in any way (including by way of negligence) from or in connection with any information provided in or omitted from this material. Features of the FP Markets products including applicable fees and charges are outlined in the Product Disclosure Statements available from FP Markets website, www.fpmarkets.com and should be considered before deciding to deal in those products. Derivatives can be risky; losses can exceed your initial payment. FP Markets recommends that you seek independent advice. First Prudential Markets Pty Ltd trading as FP Markets ABN 16 112 600 281, Australian Financial Services License Number 286354.


 Access +10,000 financial
instruments
Access +10,000 financial
instruments