
 XJO WEEKLY
Price structure:
The market remains in a consolidation phase until a breakout.
Continuing price rejection at 6900 following the reversal Outside period (OPu) of 3 weeks ago, this is statistically a very bearish setup. Only a close over the high would negate this view. In the short term a retest of the trendline at 6670 would be the first downside target.
A further breakout over 6900 would signal a retest of the 7000 point + high, this would possible negate the RSI divergence signal and the developing MACD swing sell.
Indicator: Relative Strength
The RSI indicator has remained over the key 50 level, last week turned slightly lower, a sign of changing price momentum.
A bearish divergence is developing within this momentum indicator, but not yet confirmed.
This should be monitored for a move below the key level of 50 to show a completed shift to bearish momentum.
Indicator: MACD
MACD remains a swing buy signal, but is closing in on a SELL crossover, again this highlights how slow this indicator can be in a fast market. It should be acknowledged this indicator can be very slow to react on a weekly basis and may continue to track sideways in the coming weeks as it did during 2019.
Traders should notice the faster average (orange) is now turning down and may swing to a sell signal.
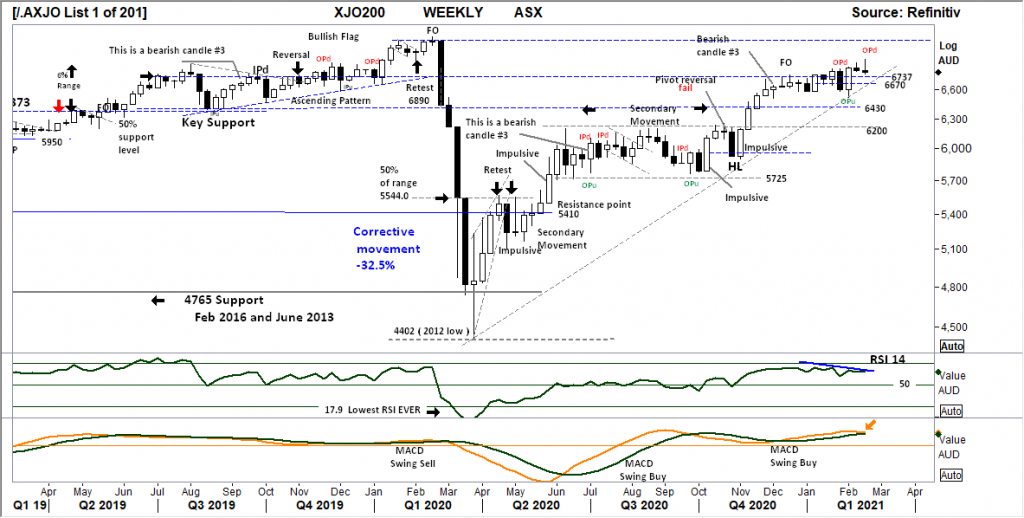
Comments from last week: Over the past 3 weeks two outside periods (OP’s) have occurred. This type of price action has a very high occurrence of marking the high or low turning point in price movements. As this Index has moved over 500 points from the November 2020 (HL) this area may be the turning point for some form of retracement.
Last week’s small range shows the buyers may be unwilling to pay higher price for the underlying equities. A time of caution for the longs with potential for the Sellers to move the market lower.
6737 remains a key level to hold in the short term.
XJO DAILY
Price structure:
Further high price rejection from the Outside period (OP) set last Wednesday has seen an accelerating price move lower towards 6765 support, this will the key daily price level to hold in the coming week.
Indicator: Relative Strength
With RSI making a series of lower highs recently and now tracking below the 50 level, setting a bearish momentum signal, a cautionary view of higher market momentum should be held.
Indicator: VOLUME
High Volumes in this small pattern and should indicate a increase of selling, this indicator should now be monitored for declining volumes to signal a loss of selling momentum.
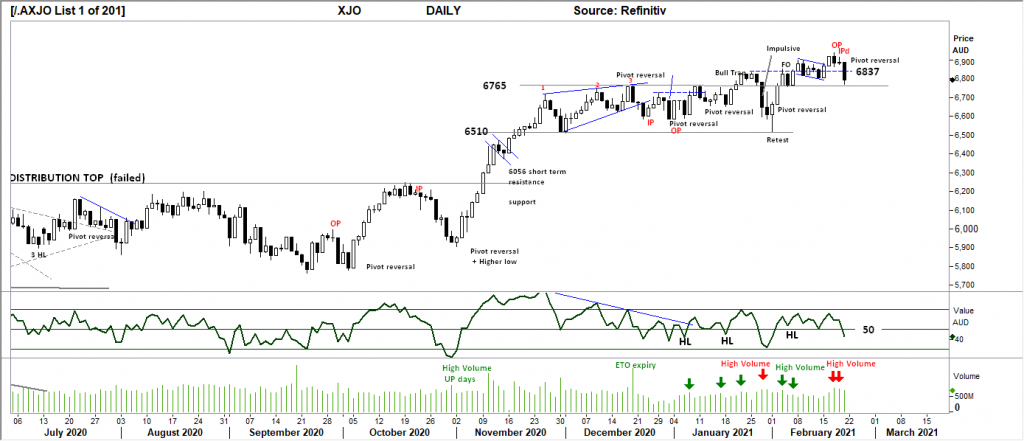
Comments from last week: With Last Monday making a new high and the following Friday making the low for the week, the Daily price movement remain unconvincing of further gains in the short term.
The current structure could be marked as a bullish flag pattern and may lead to a breakout higher. The current key level to break through higher is 6837. In the short term a retest of 6765 is underway, for the market to remain Bullish this level must hold in the coming days.
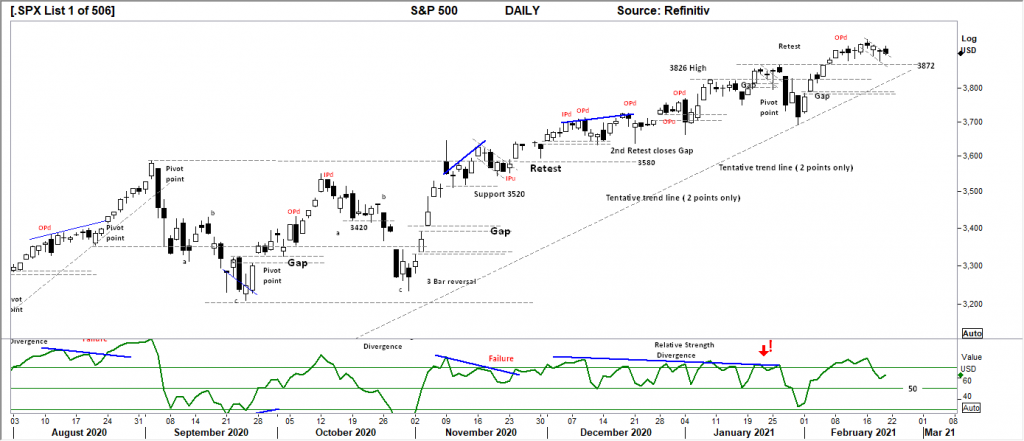
S&P 500 WEEKLY
Price structure:
A short range week, a signal of indecision, this can often lead to some form of decline as Buyers leave the market and current holders lock in profits.
3725 is the first level to hold in a retracement move. This type of price decline will place pressure on the buyers of the last 3 weeks.
In short some form of retracement is a high probability.
Primary Trend remain UP.
Indicator: Relative Strength Indicator
Relative Strength remains above the key 50 level and has set a Bearish divergence from price. This not the same but remains very similar to the Jan Feb 2020 divergence setup and continues to play out.
It should be acknowledged the RSI has remained above the 50 level for the past 9 months.
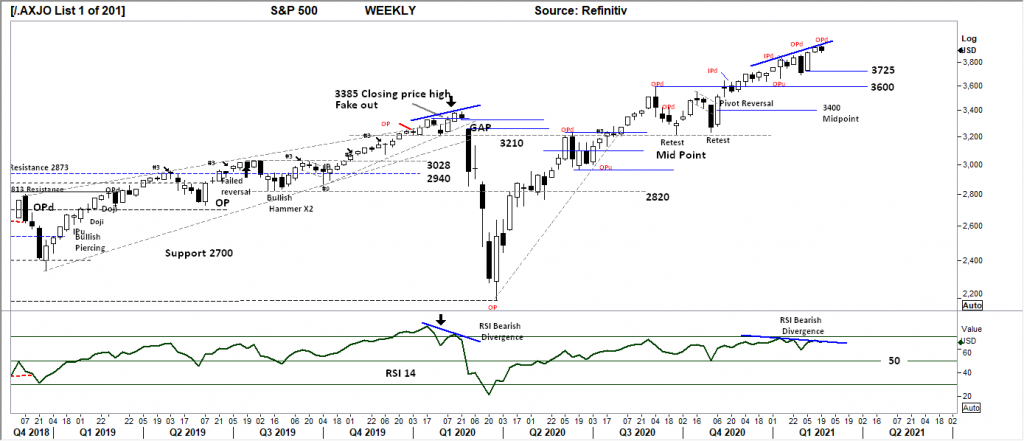
Comments from last week: The outside period of 3 weeks ago remains in play as the Relative strength Indicator continues to show a loss of momentum.
The S&P 500 is at risk of profit taking as last weeks range remained short compared to the previous two weeks. An unwillingness of the buyers to pay higher price is now starting to show.
Primary Trend remains UP.
S&P 500 DAILY
Price structure:
The Daily support level shown at 3872 was tested last Thursday, going forward this will be the short term level to hold in the coming days.
The daily structure could be described as a Bullish Flag looking for a breakout higher.
The favoured view is a retest of the trendline. To remain Bullish a large range UP day is required in the coming days to confirm the Buyers have remained in the market.
Indicator: Relative Strength
Relative Strength short term has turned higher from the decline below 70 level, it is a measure of immediate stronger price momentum and remains a weaker momentum signal until a new price high is confirmed.
The RSI should be monitored for a movement and close below the 50 level and further move below key 30 level as a loss of upward momentum.
Comments from last week: Last week closing on the high of the week and with a shortened week ahead, this high price area can potentially lead to some profit taking. A successful retest and hold of the 3872 level would be very bullish for further gains. Traders should monitor this level as a level to hold on any price retracement that may lead to further declines.
With the underlying price movement higher and the currently declining Relative strength Indicator, traders should be on guard for weaker price in the coming weeks.
USD Spot GOLD – WEEKLY
Price structure:
A very important development in the GOLD chart is the Fake out move below the November support level $1764, ( see last weeks notes below) followed by a Weekly close above this level.
The Daily chart of gold displays an outside period (OP).
This can be a very bullish setup with a potential retest of $1826 in the coming days.
Price failure at this level puts the lower trendline target in play at $1700.
Indicator: Relative Strength
Relative Strength turns lower and fails to cross the key “50” level. This is a key indicator of “slowing” price momentum, a continued move lower would only reflect negative price momentum both in the Daily and Weekly charts.
Look for an up turn in the RSI to confirm any potential price rally getting underway.
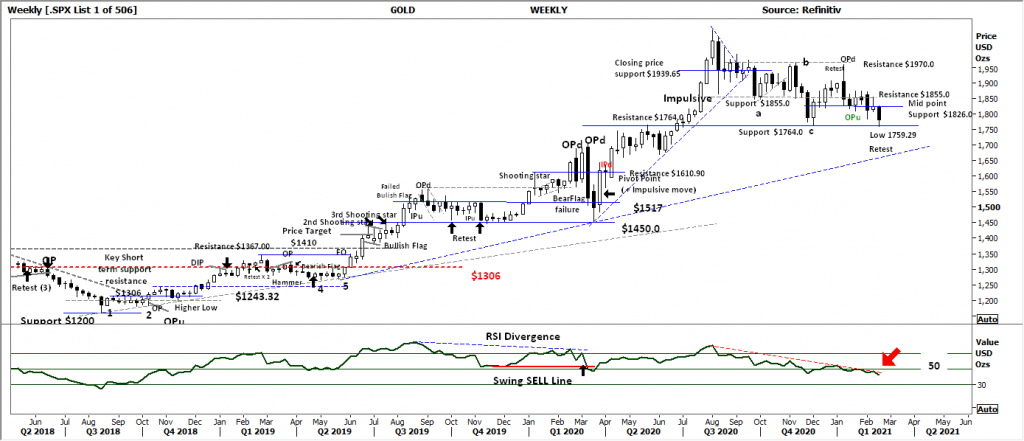
Comments from last week: USD Gold remains in a Primary down trend, last weeks price bar again retesting the $1855.0 level before closing towards the lows.
A potential retest of $1764.0 is a very high probability in this market.
There is nothing bullish in this chart. However it remains highly tradeable in shorter time frames.
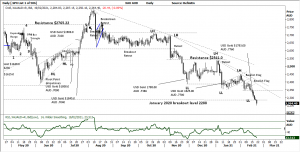
AUD GOLD DAILY
Price structure:
The AUDUSD Gold price has placed considerable pressure on the Australian producers underlying price, with most remaining within a Primary down trend.
Last Friday’s large range may be the extended price flush. (bullish)
The AUDSUD price breakdown below the January breakout level is a signal od very weak price and should be monitored for further declines.
Smaller Gold plays remain dependant on news flow and drilling results.
Indicator: Relative Strength
With the RSI turning lower from below the key 30 level showing decreasing momentum.
This indicator has swung around below the 50 level since August and remains a key observation for weaker prices on slowing momentum. This momentum indicator needs a continued swing higher over the key 50 level in line with any price gains to confirm a valid buy signal.
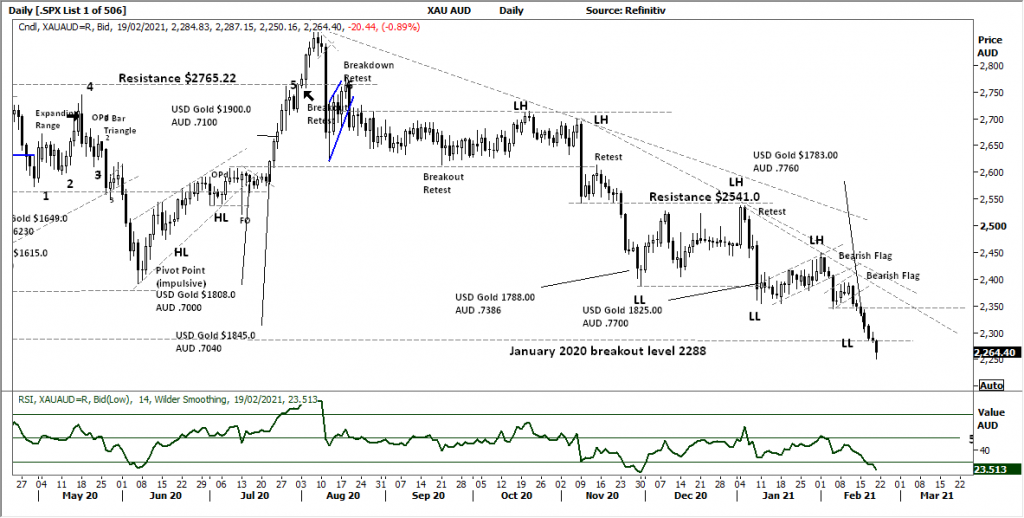
Comments from last week: Strength in the Australian dollar and a declining USD Gold price has set the AUD Gold price at a 9 month low, following Thursdays decline from the developed Bearish flag pattern.
2288 remains the current target. This will continue to play out against the local producers.
SILVER DAILY
Price structure:
Last Friday saw another retest of the $26.00 support level and again met with strong buying to lift price back towards the $27.70 resistance level.
This is a very strong signal for further gains as the Sliver price leads the Gold price in coming days.
A further close over the $27.70 level would be a very Bullish signal, with a potential retest of the $30.00 high underway.
Indicator: Relative Strength
Relative Strength has turned higher and has remained above the 50 level, operating in line with the underlying price movement a good signal for further improvement in price momentum at this 50+ level.

Comments from last week: The $26.00 level continues to hold Silver as the midweek retest of $27.70 has also taken place. Friday’s bullish close is a good signal price momentum may be turning higher inside the developing Bullish flag pattern. A breakout over $27.70 would be a very strong signal for a retest of the recent $30 high set 2 weeks ago. Silver remains highly tradeable in these volatile price movements.
COPPER DAILY
Price structure: Inventories under pressure.
“Dr Copper” the physician to economic growth.
Copper has staged a very strong breakout over the historical $4.00 resistance level on an extended range bar closing on the high.
A price back retest of this $4.00 level and hold, would be very bullish for further gains in the coming days.
This is a very bullish chart with trading opportunities long and short (against the trend)
Indicator: Relative Strength
Relative Strength has moved over the 70 level.
An early BEARISH divergence signal has been negated. The over “70” reading of the RSI is not a bearish signal as this reading can remain elevated for many weeks as seen during December 2020 and January 2021.

Comments from last week: Last week’s “impulsive” move has taken out a potentially strong resistance level at $3.80.
This type of impulsive price movement has a high probability of continuing with a retest of 2012 $4.00 highly likely.
Consolidation of price should hold above the $3.80 level on a daily basis.
The primary trend remains up.
AUSTRALIAN VOLATILITY INDEX
The large range bar last week has given way to a lower close over the previous week.
Volatility remains in equity pricing as the cost of option PUT insurance remains elevated.
The XVI is the difference of 1-month forward pricing of ETO Options against current month.
As markets anticipate events, the forward priced option volatility changes, hence as forward price changes, this “skew” in pricing is measured in this XVI.
The XVI value works as an inverse observation to the underlying market.

Comments from last week: The XVI value now shows an 8 week closing high, with the potential for a retracement in Index values the cost of PUT insurance is increasing. A further higher reading in the coming week will show as further pressure on equity prices.
USD DOLLAR INDEX
Price structure:
Building support along the 90.00 level is a strong signal the Buyers are accumulating.
The longer the consolidation period the stronger the breakout, however the consolidation above 90.00 and below trendline resistance can last for several more days.
A breakdown below the 90.00 would be decisive win for the BEARS and could lead to an accelerated decline to 89.00.
Indicator: Relative Strength
While the RSI has again moved lower below the 50 level, the indicator remains a signal of lower price momentum as consolidation takes place. Traders would look for an RSI move first above the 50 level to suggest a more significant momentum move higher is underway, this remains highly probable.

Comments from last week: The most important chart in the world as a driver of commodity prices and a reflection of the cost of money (interest rates) and potential forward inflation.
It remains significant the DXY value has not traded over 91.66 last week, with a sharp retracement to settle below the 90.66 level. The price chart is now at an important juncture where a new high over 91.66 must be made for the developing Primary UP trend to remain intact.
WTI CRUDE OIL
Price structure: This commodity is news driven by supply -demand.
Last week the $61.80 level has provided resistance to the current price advance above the $50.60 level.
A short retracement could be expected in the coming days with the trendline the first level of support at $55.00
Indicator: Relative Strength
RSI turning higher over the 50 level and now over 70 remains in a very good place for further momentum price gains until a dip below the 70 level.
The indicator is “rolling” over in line with current price weakness.
As the indicator remains over 70, this should also be monitored for a potential divergence signal.

Comments from last week : Another good week for the price of WTI as a break way of the $50.50 level continues.
The weekly chart shows $66.00 remaining as the historical resistance level and potential price target.
With 2 weeks of strong price movement some consolidation may be expected at the $61.80 level in the coming weeks.
The next target remains $61.80. The new support level remains $50.60


 Access +10,000 financial
instruments
Access +10,000 financial
instruments