
Charts provided by Trading View
EUR/USD:
Monthly timeframe:
(Technical change on this timeframe is often limited, though serves as guidance to potential longer-term moves)
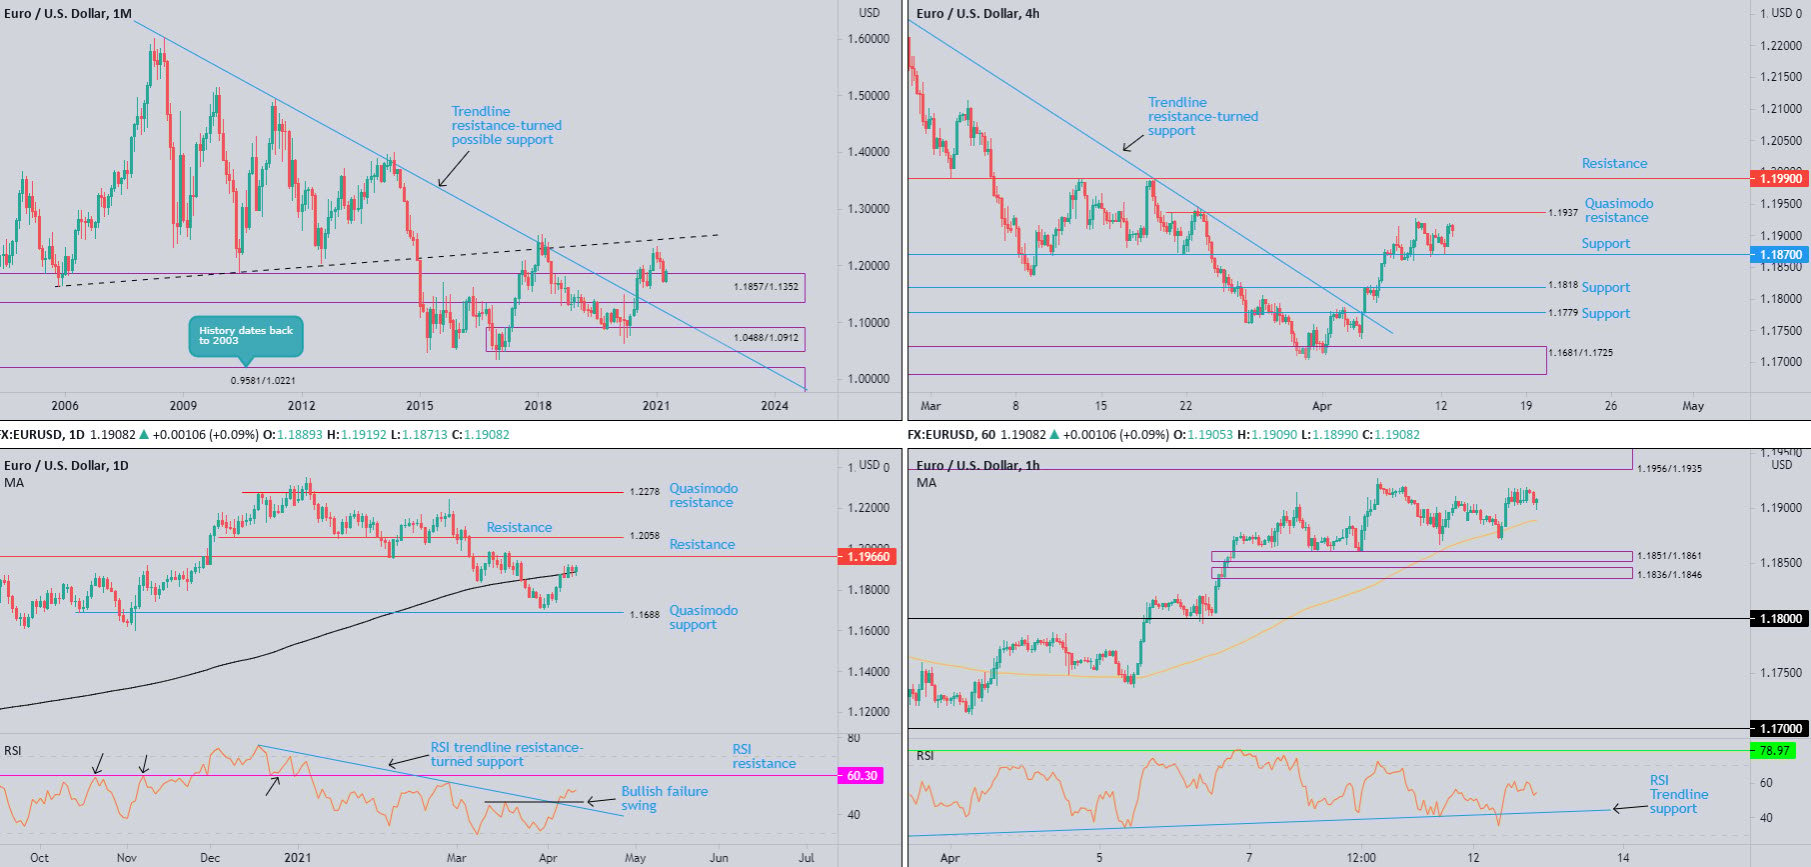
March carved out a third consecutive loss, extending the 2021 retracement slide by 2.8 percent. Recent underperformance, as you can see, pulled EUR/USD into the upper range of demand at 1.1857/1.1352.
April’s 1.4 percent rebound thus far shifts attention to the possibility of fresh 2021 peaks and a test of ascending resistance (prior support – 1.1641). Extending lower, on the other hand, shines the technical spotlight on trendline resistance-turned support, taken from the high 1.6038.
Based on trend studies, the primary uptrend has been underway since price broke the 1.1714 high (Aug 2015) in July 2017.
Daily timeframe:
Largely unchanged analysis from previous report.
Europe’s single currency traded within a narrow range against the US dollar on Monday. Interestingly, the US dollar index (DXY) holds just south of its 200-day simple moving average, while EUR/USD hovers a touch above its 200-day SMA at 1.1889.
Resistance at 1.1966 is next in line, with a break unmasking additional resistance at 1.2058.
Despite the 2021 retracement slide, trend studies reveal the pair has been higher since early 2020.
RSI analysis shows upside momentum gathered traction last week, sweeping through trendline resistance (taken from the peak 75.97) and forming a bullish failure swing (a sign of a potential reversal).
H4 timeframe:
Largely unchanged analysis from previous report.
1.1870 continues to serve as support on the H4 scale, withstanding two downside attempts last week and once on Monday.
Quasimodo resistance calls for attention at 1.1937; continuation buying is likely to bring light to notable resistance at 1.1990. In the event 1.1870 fails to hold, nevertheless, support at 1.1818 could elbow its way into the spotlight.
H1 timeframe:
The 100-period simple moving average delivered dynamic support as we transitioned into London hours on Monday around 1.1878, aided by trendline support out of the relative strength index (RSI). Note the RSI currently hovers above the 50.00 centreline, implying momentum to the upside is reasonably healthy.
Supply resides at 1.1956/1.1935, a zone housing H4 Quasimodo resistance at 1.1937. Aside from the 100-period simple moving average, additional supportive structure to have eyes on are demand at 1.1851/1.1861 (sited beneath H4 support at 1.1870) as well as at 1.1836/1.1846.
Observed levels:
Longer-term action reveals a bullish vibe, with monthly demand at 1.1857/1.1352 making an entrance and daily price climbing above the 200-day simple moving average last week. Daily resistance is seen at 1.1966.
Shorter-term flow shows H1 poised to retest the 100-period simple moving average, potentially prompting a dip-buying scenario to target H1 supply at 1.1956/1.1935 (houses H4 Quasimodo resistance within its lower limit at 1.1937).
AUD/USD:
Monthly timeframe:
(Technical change on this timeframe is often limited, though serves as guidance to potential longer-term moves)
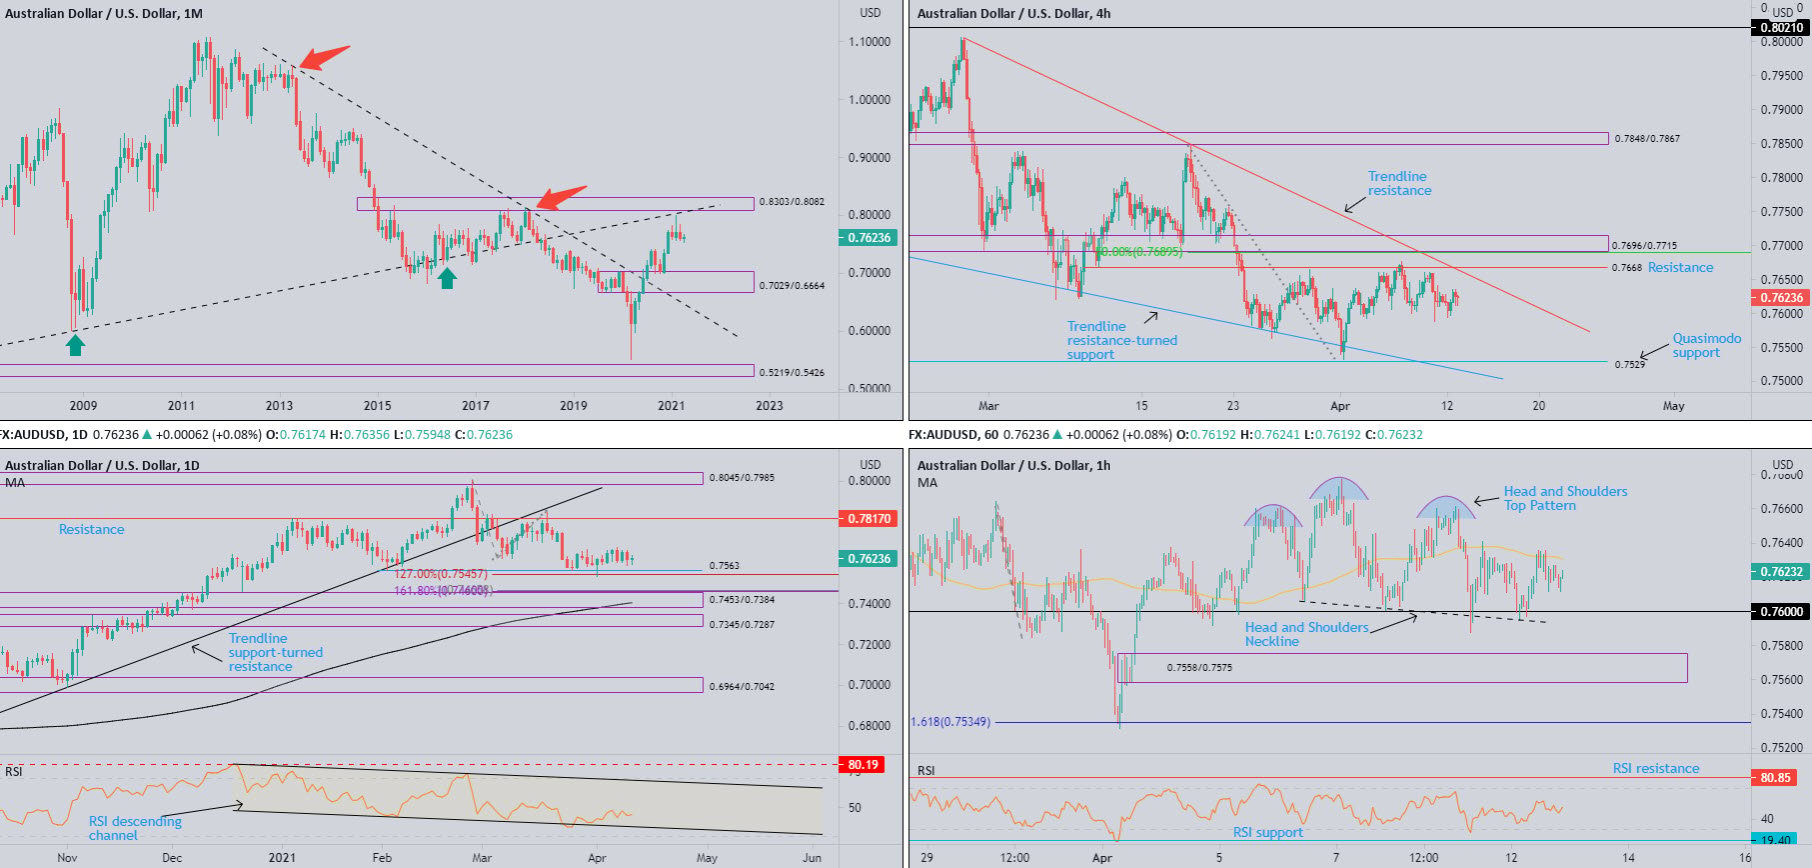
February finished considerably off best levels, establishing what many candlestick fans call a shooting star pattern—a bearish signal found at peaks. What’s interesting was February also came within striking distance of trendline resistance (prior support – 0.4776 high), sheltered under supply from 0.8303/0.8082.
March subsequently erased 1.5% over the Month and probed February’s lows. Should follow-through selling develop, demand is in view at 0.7029/0.6664 (prior supply).
With respect to trend (despite the trendline resistance [1.0582] breach in July 2020), the primary downtrend (since mid-2011) remains in play until breaking 0.8135 (January high [2018]).
Daily timeframe:
Largely unchanged analysis from previous report.
Since 25th March, buyers and sellers have been squaring off around the 0.7563 February low, aided by a 1.272% Fib extension at 0.7545. Monday wrapped up largely unchanged, forming what many candlestick traders would label as a doji indecision formation.
Resistance remains at 0.7817; a dip beneath 0.7563 brings light to demand from 0.7453/0.7384 (dovetailing closely with a 100% Fib expansion at 0.7465 and a 1.618% Fib extension at 0.7460). Technicians will also note the 200-day simple moving average circling nearby at 0.7401.
Trend studies reveal the unit has been higher since early 2020.
As for the RSI oscillator, the value remains reinforced off channel support, taken from the low 43.70, and nears the underside of 50.00.
H4 timeframe:
Unchanged analysis from previous report.
AUD/USD flow remains languishing south of resistance at 0.7688, with price discovering a modestly supportive tone around the 0.7592 April 2nd low. Traders will note that 0.7688 unites with trendline resistance, taken from the high 0.8007, with space above pointing to supply at 0.7696/0.7715, accompanied by a 50.0% retracement at 0.7689.
Should 0.7592 step aside, Quasimodo support at 0.7529 could enter the frame, a level joined closely by a trendline resistance-turned support, taken from the high 0.7805.
H1 timeframe:
As you can see from the H1 chart, price action established a head and shoulders top pattern around 0.7662 last week, a formation that’s considered a reversal indicator. In this case, it has formed amidst a pullback within a short-term downtrend (see H4 for a clearer view).
Consequently, should price overrun the pattern’s neckline, drawn from the low 0.7605, a bearish theme might unfold. This, of course, would entail dethroning 0.76 psychological support and likely attacking demand at 0.7558/0.7575.
In addition to the pattern structure, traders will note the 100-period simple moving average around 0.7630 recently held as resistance (SMAs often deliver dynamic support and resistance).
RSI action spent the majority of Monday circling the 50.00 centreline, following Friday’s rebound from oversold space.
Observed levels:
Unchanged analysis from previous report.
From the bigger picture, the lack of buying interest from the 0.7563 February low on the daily scale may be due to monthly price pencilling in a bearish candlestick formation in February ahead of notable structure. This indicates sellers could eventually topple 0.7563 and challenge daily demand at 0.7453/0.7384.
In tandem with the monthly chart, H1 pencilled in a head and shoulders top pattern, with price retesting the lower side of the 100-period simple moving average again on Monday. This implies a bearish scene could develop, taking on the 0.76 round number and testing H1 demand at 0.7558/0.7575. Of course, further selling may also be on the cards, given the head and shoulders top pattern’s take-profit target resides beyond the H1 timeframe’s 1.618% Fib expansion at 0.7534.
DISCLAIMER:
The information contained in this material is intended for general advice only. It does not take into account your investment objectives, financial situation or particular needs. FP Markets has made every effort to ensure the accuracy of the information as at the date of publication. FP Markets does not give any warranty or representation as to the material. Examples included in this material are for illustrative purposes only. To the extent permitted by law, FP Markets and its employees shall not be liable for any loss or damage arising in any way (including by way of negligence) from or in connection with any information provided in or omitted from this material. Features of the FP Markets products including applicable fees and charges are outlined in the Product Disclosure Statements available from FP Markets website, www.fpmarkets.com and should be considered before deciding to deal in those products. Derivatives can be risky; losses can exceed your initial payment. FP Markets recommends that you seek independent advice. First Prudential Markets Pty Ltd trading as FP Markets ABN 16 112 600 281, Australian Financial Services License Number 286354.


 Access +10,000 financial
instruments
Access +10,000 financial
instruments