
EUR/USD:
Monthly timeframe:
(Technical change on this timeframe is often limited though serves as guidance to potential longer-term moves)
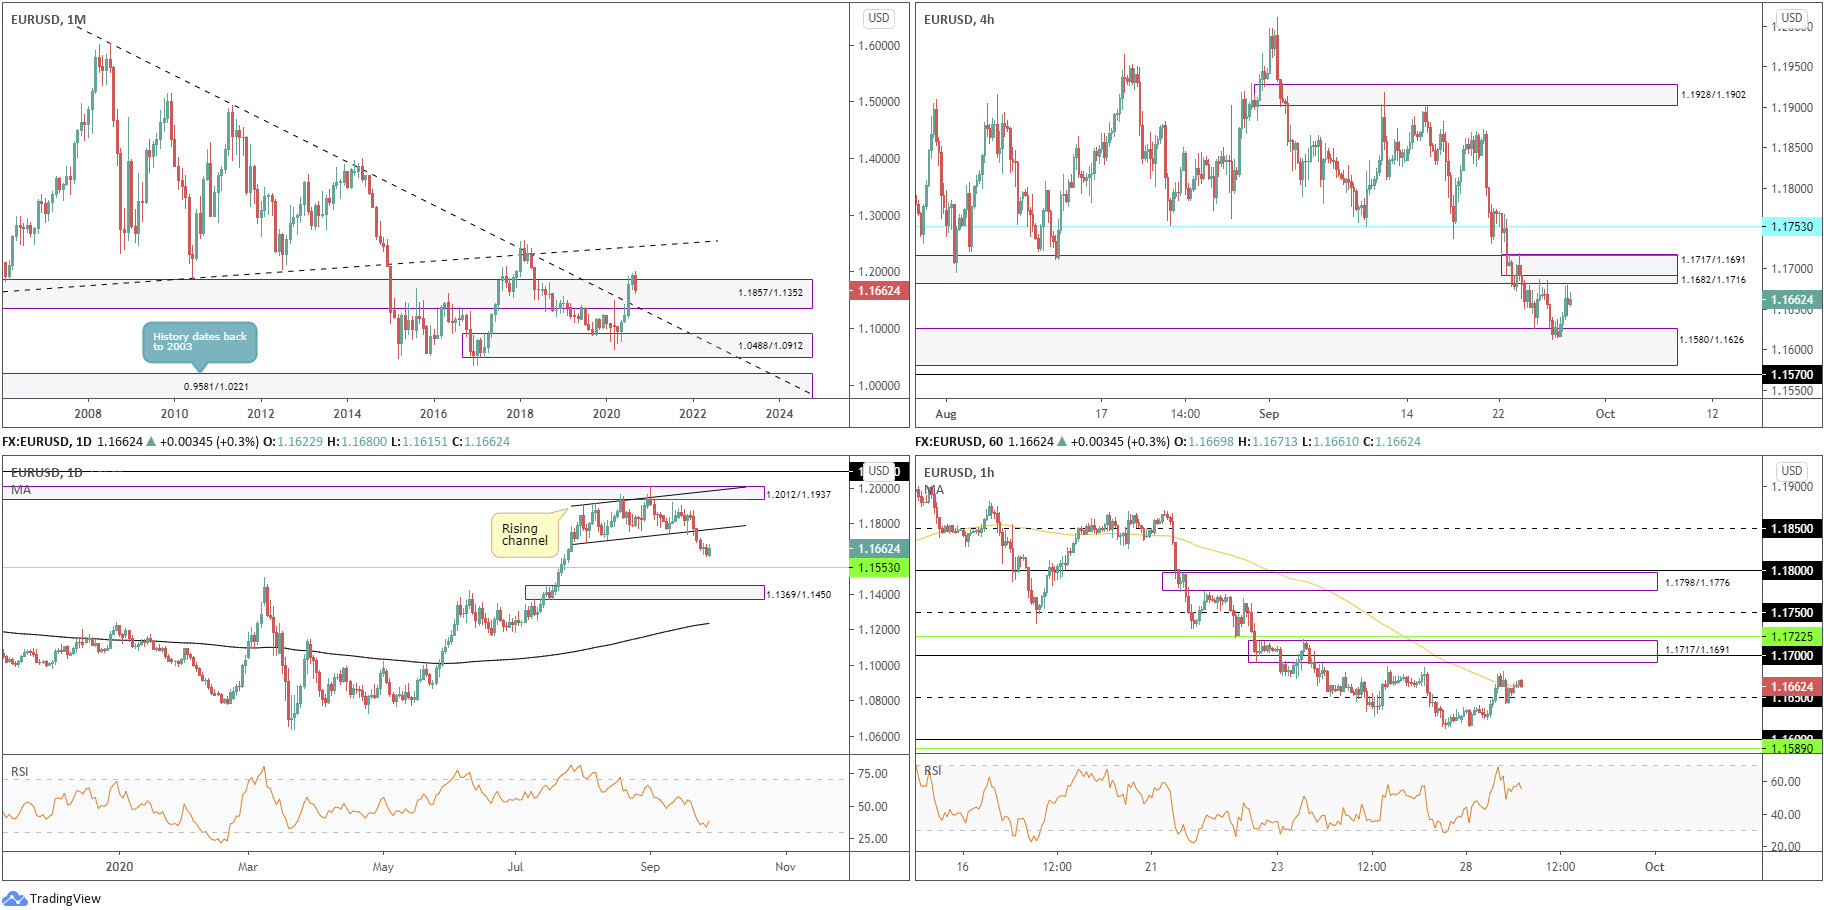
August, as you can see, toppled supply from 1.1857/1.1352 and extended space north of long-term trendline resistance (1.6038), arguing additional upside may be on the horizon, targeting trendline resistance (prior support – 1.1641).
Trading in September, however, is down more than 2.2 percent, on track to snap a four-month winning streak and retest broken trendline resistance.
The primary downtrend (since July 2008) remains intact until 1.2555 is engulfed (Feb 1 high [2018]).
Daily timeframe:
Partially altered from previous analysis –
Despite the absence of any concrete daily support, EUR/USD is having a go at establishing a bottom. The currency pair’s technical position, however, is tipped for more underperformance until making contact with 1.1553 support, with a break uncovering demand at 1.1369/1.1450.
With respect to the RSI oscillator, the line recently rotated just north of oversold levels, currently hovering around the 40.00 region.
H4 timeframe:
Monday, as you can see, recoiled from demand at 1.1580/1.1626. This led to a near test of supply at 1.1682/1.1716 (prior demand), an area which boasts a partnership with another supply zone at 1.1717/1.1691.
Outside of the aforesaid zones, 1.1753 resistance and 1.1570 support are marked on the radar.
H1 timeframe:
Following a mild slump heading into the US session on Monday, intraday activity made a stand off 1.1650 support and moderately pared losses into the final hours of trade.
Supply at 1.1717/1.1691 (represents supply on the H4 and contains 1.17) is pinned as the next primary resistance, with a break unmasking nearby resistance at 1.1722 and 1.1750 resistance, along with supply painted at 1.1798/1.1776.
Structures of Interest:
Although testing the air above monthly supply at 1.1857/1.1352 likely tripped some long-term stops, September’s depreciation echoes the possibility of further declines to retest the recently penetrated monthly trendline, which happens to share space with daily demand at 1.1369/1.1450. However, to reach the aforesaid demand, daily support at 1.1553, an active hurdle since February 2015, must be dethroned.
With the higher timeframes suggesting bulls display a lack of participation, moving beyond the H4/H1 supply area at 1.1717/1.1691 may be a challenge and, therefore, an area the market may witness active selling emerge from.
AUD/USD:
Monthly timeframe:
(Technical change on this timeframe is often limited though serves as guidance to potential longer-term moves)
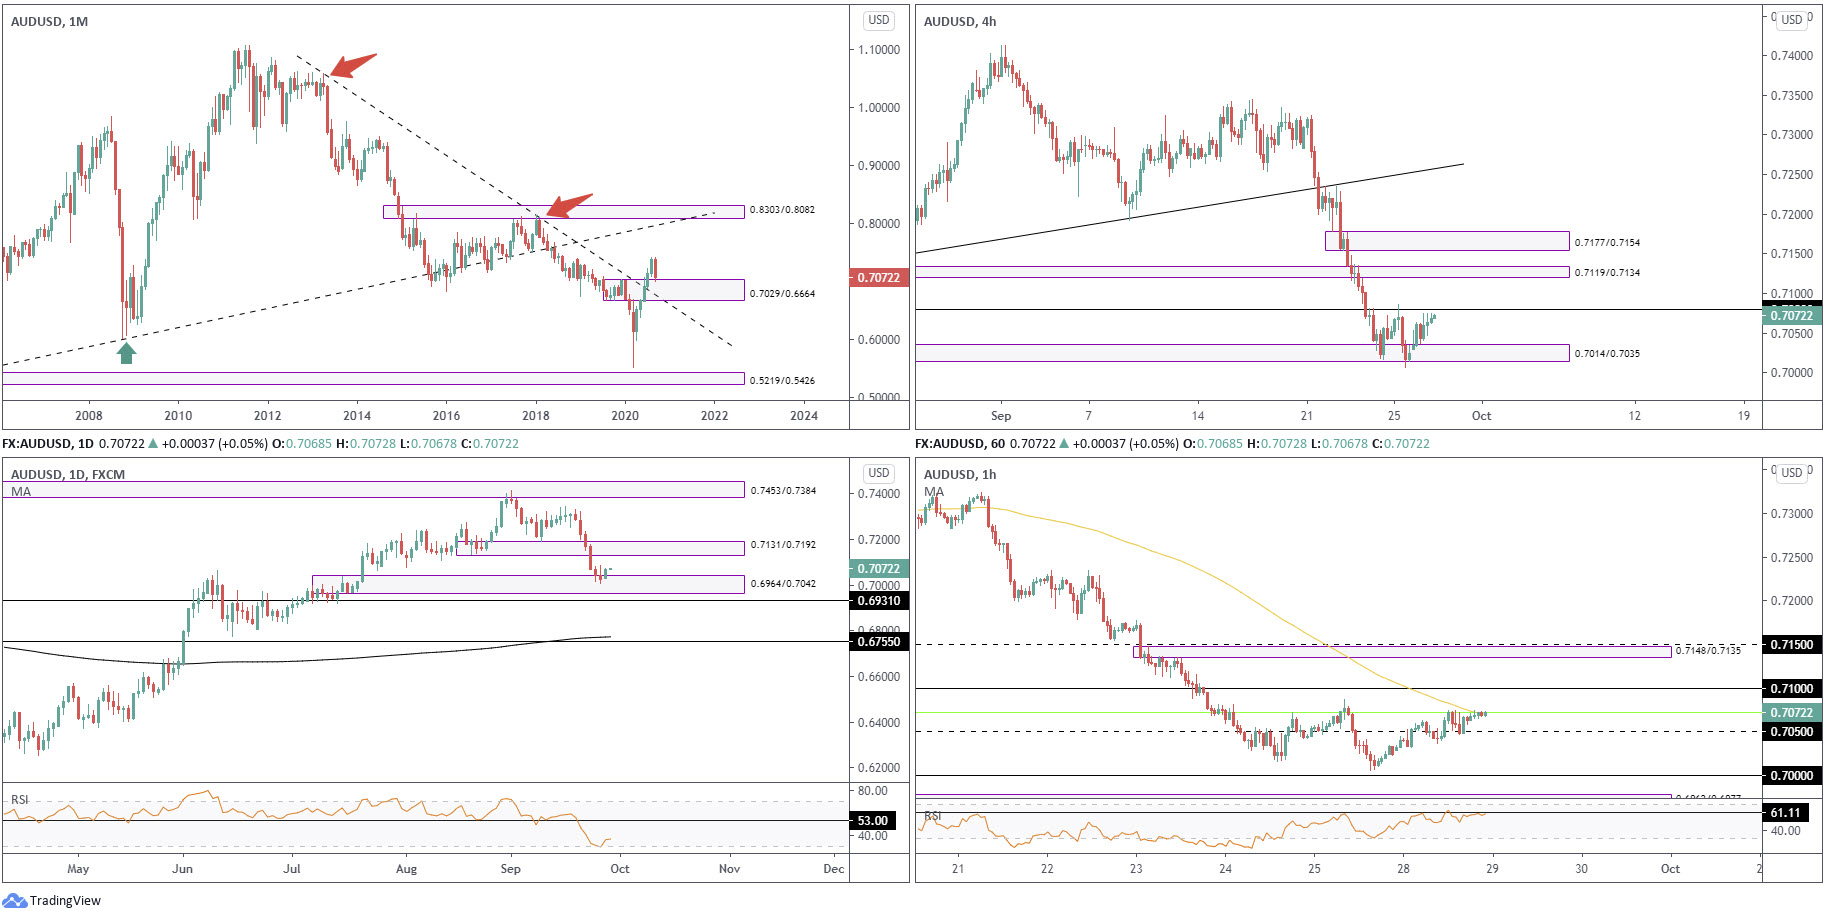
August’s 3.3% gain extended space north of supply at 0.7029/0.6664 and long-term trendline resistance (1.0582). Technically, buyers appear free to explore as far north as 0.8303/0.8082 in the coming months, a supply zone aligning closely with trendline resistance (prior support – 0.4776). The month of September (lower by 4 percent), however, is on the brink of snapping a five-month winning streak with price currently retesting 0.7029/0.6664.
In addition to the above, traders might want to take into account the primary downtrend (since mid-2011) remains south until breaking 0.8135 (January high [2018]).
Daily timeframe:
Partially altered from previous analysis –
Arranged by way of six successive daily bearish candles, demand at 0.6964/0.7042 received price action heading into the second half of last week, mapped just ahead of support at 0.6931.
The trend, according to the daily timeframe (and also the 200-day simple moving average), has emphasised a positive tone since bottoming in late March. Traders may also recognise the RSI recently traded aggressively south of 53.00, a clear S/R level since October 2019, and recently embraced and rebounded from oversold turf.
H4 timeframe:
Although moderately clipping the lower edge of demand at 0.7014/0.7035 likely tripped some stops late Friday, it was clearly not enough fuel to prompt lower moves.
Monday finished around session highs and snapped a six-day losing streak, on track to welcome resistance at 0.7080. The airspace above the latter is relatively clear until supply at 0.7119/0.7134 (prior demand), closely tailed by another area of supply coming in from 0.7177/0.7154.
H1 timeframe:
Monday’s recovery concluded testing resistance at 0.7072, a level currently intersecting with the 100-period simple moving average. Overrunning the aforesaid levels today directs attention to the 0.71 handle and the supply zone parked a couple of pips under 0.7150 resistance at 0.7148/0.7135 (located just above H4 supply).
With reference to the RSI indicator, resistance is visible around 61.10.
Structures of Interest:
Monthly price testing 0.7029/0.6664 as demand, together with daily price also responding to demand at 0.6964/0.7042, could guide H1 above resistance at 0.7072 and H4 above 0.7080 resistance today.
This projects a bullish tone heading into Tuesday, with 0.71 pinned as a possible target, followed by the lower ledge of H4 supply at 0.7119.
USD/JPY:
Monthly timeframe:
(Technical change on this timeframe is often limited though serves as guidance to potential longer-term moves)
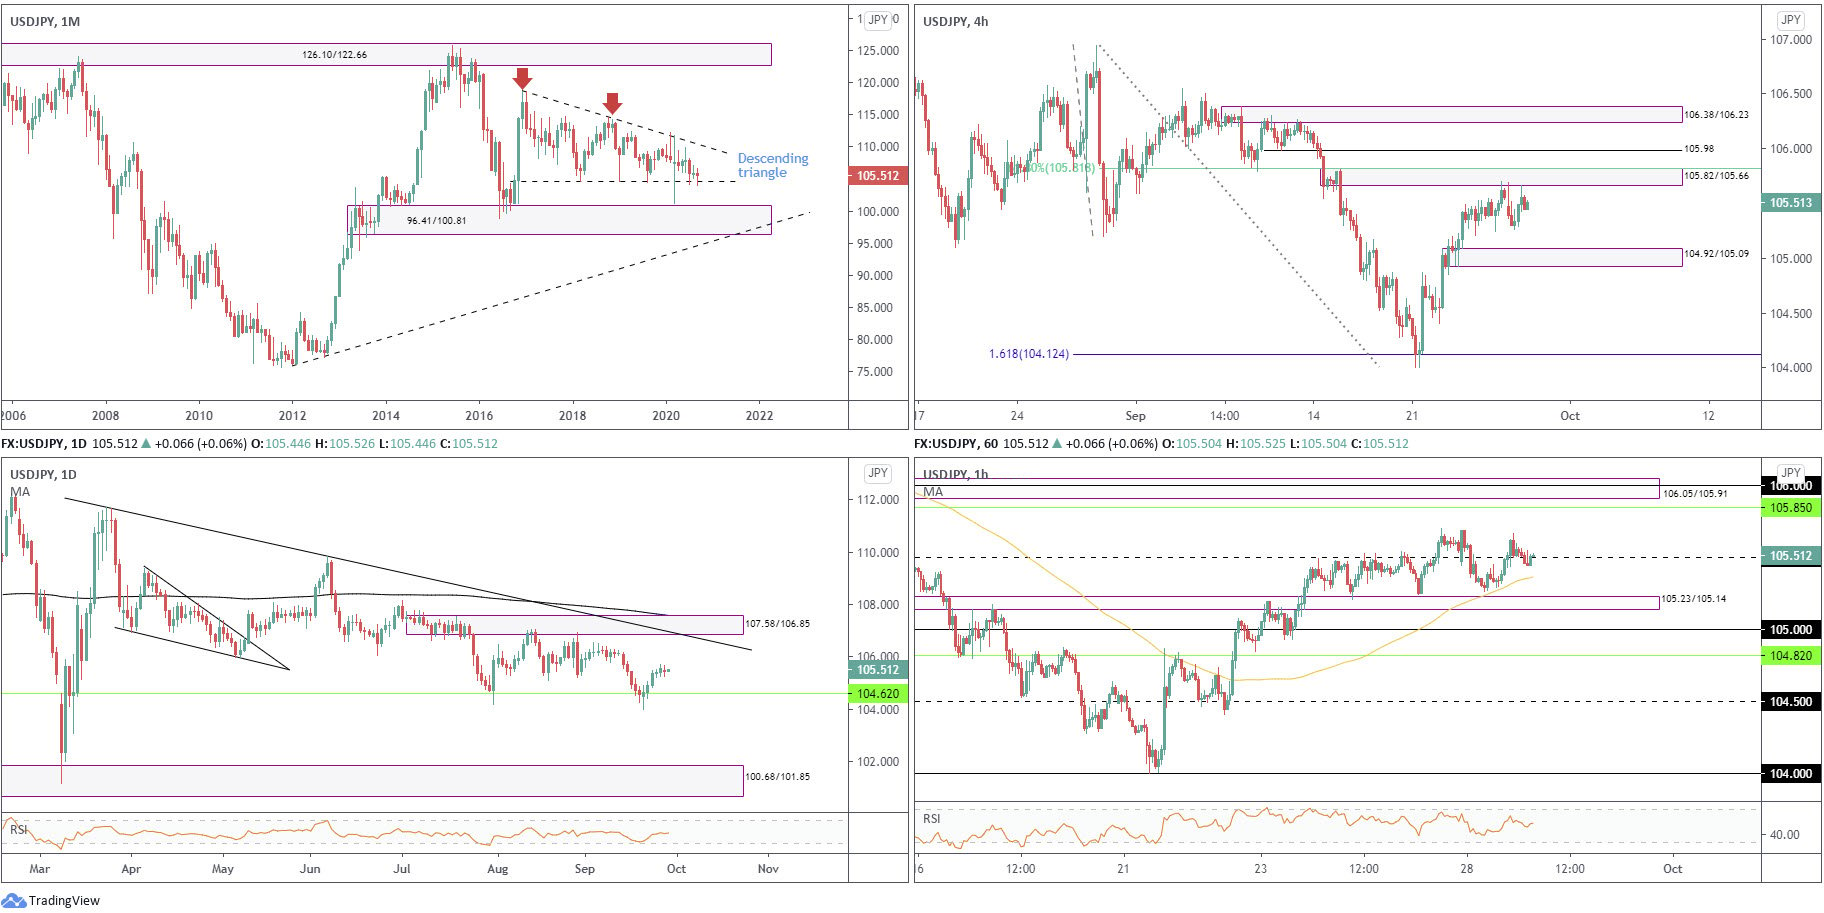
Since kicking off 2017, USD/JPY has been carving out a descending triangle pattern between 118.66/104.62.
Notably, September tested the lower boundary of the aforesaid pattern and is on course to end the month off worst levels.
Areas of interest outside of the triangle can be seen at supply from 126.10/122.66 and demand coming in at 96.41/100.81.
Daily timeframe:
Brought forward from previous analysis –
Recent recovery gains off monthly support at 104.62 (the lower boundary of the monthly descending triangle) invites the prospect of additional bullish sentiment towards trendline resistance (111.71) and nearby supply at 107.58/106.85.
The RSI, for those who follow momentum oscillators, recently bottomed ahead of oversold levels and is currently hovering at the underside of the 50.00 mark.
H4 timeframe:
Partially altered from previous analysis –
The second half of last week crossed paths with supply at 105.82/105.66, an area that stores a 61.8% Fib level within its upper boundary at 105.81.
Other areas of interest on the H4 chart are resistance at 105.98 and supply from 106.38/106.23. In addition, demand can also be seen at 104.92/105.09.
H1 timeframe:
Early Europe Monday bounced ahead of the 100-period simple moving average and toppled 105.50 resistance as we transitioned into US hours. Although a mild pullback has been observed into the close, 105.50 appears to have survived as support. Scope to build on recent gains is visible on the H1, demonstrating a relatively clear road north until resistance at 105.85 and supply at 106.05/105.91.
Failure to gain ground today rotates the technical radar back to demand (prior supply) at 105.23/105.14.
Structures of Interest:
Partially altered from previous analysis –
Monthly support at 104.62 (lower base of the monthly descending triangle) prompting a reasonably decisive advance last week, along with the daily chart exhibiting room to approach trendline resistance and supply coming in from 107.58/106.85, signals buyers are likely to remain behind the wheel.
Supply at 105.82/105.66 remains in place on the H4 timeframe, yet on the H1 chart 105.50 could tempt buying to target H1 resistance at 105.85. This, of course, is in line with higher timeframe action recently rebounding from monthly support, together with room to approach higher levels on the daily chart.
GBP/USD:
Monthly timeframe:
(Technical change on this timeframe is often limited though serves as guidance to potential longer-term moves)
Leaving trendline resistance taken from 2.1161 unopposed, September trades lower by 4 percent, on track to retest trendline support (prior resistance – 1.7191).
Interestingly, the primary trend has faced lower since early 2008, unbroken until 1.4376 gives way – April 2 high 2018.
Daily timeframe:
Partially altered from previous analysis –
Price, as you can see, recently took on the 200-day simple moving average at 1.2715, stored inside demand at 1.2645/1.2773. Although buyers displayed some enthusiasm on Monday, efforts were obstructed by supply at 1.3021/1.2844.
Violating the aforesaid demand shines light on another demand placed at 1.2192/1.2361, an area that contained downside in late June.
The RSI indicator is currently drawing up a possible double-bottom pattern ahead of oversold space.
H4 timeframe:
Demand at 1.2646/1.2685 accepted price action last week. While upside attempts were initially met with strong opposition from resistance at 1.2773, buyers mustered enough strength Monday and blew through resistance to greet supply at 1.2965/1.2911.
H1 timeframe:
Monday’s retreat from peaks north of 1.29 landed at a demand area drawn from 1.2810/1.2833, positioned above the 1.28 level. A recovery from the aforesaid demand is likely to reach for 1.29, though before buyers make a show, a nudge to 1.28 could be seen.
Traders will also note the 100-period simple moving average is in the process of turning higher, and the RSI oscillator is within a stone’s throw from testing trendline support.
Structures of Interest:
Intraday, the combination of 1.28 and demand at 1.2810/1.2833 offer well-grounded support, enough to potentially pull out an advance back to 1.29.
Further out, however, H4 shows room to drop and retest support at 1.2773; monthly also displays scope to push lower until testing trendline support (around 1.26ish), and daily price is seen struggling to print anything of meaning out of demand at 1.2645/1.2773 (hampered by supply at 1.3021/1.2844).

DISCLAIMER:
The information contained in this material is intended for general advice only. It does not take into account your investment objectives, financial situation or particular needs. FP Markets has made every effort to ensure the accuracy of the information as at the date of publication. FP Markets does not give any warranty or representation as to the material. Examples included in this material are for illustrative purposes only. To the extent permitted by law, FP Markets and its employees shall not be liable for any loss or damage arising in any way (including by way of negligence) from or in connection with any information provided in or omitted from this material. Features of the FP Markets products including applicable fees and charges are outlined in the Product Disclosure Statements available from FP Markets website, www.fpmarkets.com and should be considered before deciding to deal in those products. Derivatives can be risky; losses can exceed your initial payment. FP Markets recommends that you seek independent advice. First Prudential Markets Pty Ltd trading as FP Markets ABN 16 112 600 281, Australian Financial Services License Number 286354.


 Access +10,000 financial
instruments
Access +10,000 financial
instruments