
EUR/USD:
Monthly timeframe:
(Technical change on this timeframe is often limited though serves as guidance to potential longer-term moves)
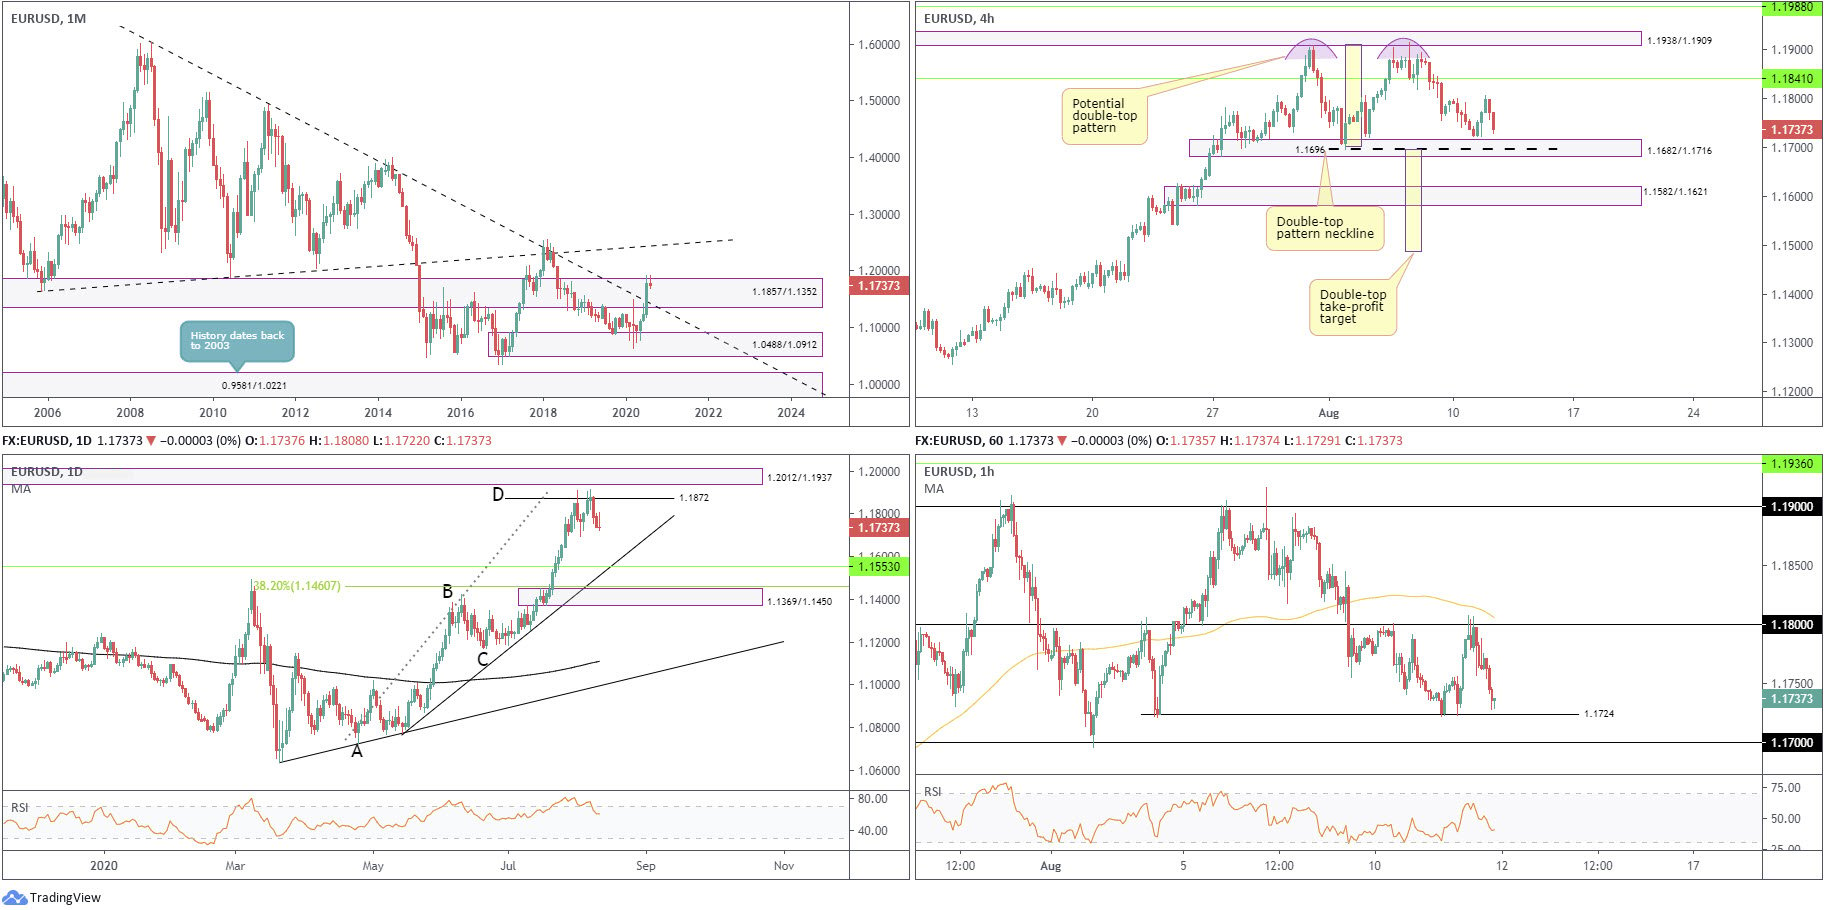
The euro punched out a third successive monthly gain against the US dollar in July, adding nearly 5 percent. The move toppled long-term trendline resistance (1.6038) and made contact with the upper border of supply from 1.1857/1.1352. This argues a trend change to the upside may be on the horizon, with trendline resistance (prior support – 1.1641) on the radar as the next upside target.
August, as you can see, currently trades cautiously, down by 0.40 percent.
Also worth pointing out, though, is the primary trend remains intact, underlining a southerly trajectory since July 2008.
Daily timeframe:
Partially altered from previous analysis –
The ABCD bearish pattern at 1.1872, a simple harmonic configuration, is proving a tough nut to crack since the level made a show at the end of July. Placed just ahead of supply at 1.2012/1.1937, last Friday’s action delivered a muscular bearish candle, a move which snapped a three-day winning streak, with Monday and Tuesday marginally following through to the downside.
An extension lower appears likely on this timeframe. Assuming last Monday’s low at 1.1695 breaks down, support at 1.1553 will firmly be on the radar as the initial point of interest.
In reference to the RSI indicator, the value topped around 80.00 in recent action and decisively departed overbought territory.
H4 timeframe:
Supply at 1.1938/1.1909 has so far played an important role during August (glued to the underside of daily supply at 1.2012/1.1937), providing enough fuel for price to dethrone support at 1.1841 and carry the action to within striking distance of demand at 1.1682/1.1716.
Also interesting on this timeframe is the recent formation of a potential double-top pattern around the lower ledge of supply, with a neckline located at 1.1696.
Unseating the aforesaid demand (and neckline) today positions demand at 1.1582/1.1621 in sight, followed by the double-top take-profit target at 1.1487 (yellow).
H1 timeframe:
EUR/USD gathered traction heading into London Tuesday, though energy was short-lived, halting at the 1.18 vicinity (nearby the 100-period simple moving average) and giving up nearly 70 pips.
1.1724 support is next on tap, with a break unmasking nearby support by way of the 1.17 level.
Structures of Interest:
With daily price making progress under the ABCD bearish pattern at 1.1872 and monthly price yet to secure position north of supply at 1.1857/1.1352, it is likely we’re headed through H4 demand at 1.1682/1.1716 today. By extension, this implies a H1 close under 1.17. H1 demand at 1.1639/1.1658 is the next area in range, followed by H4 demand at 1.1582/1.1621.
AUD/USD:
Monthly timeframe:
(Technical change on this timeframe is often limited though serves as guidance to potential longer-term moves)
May’s extension, together with June and July’s follow-through, witnessed supply at 0.7029/0.6664 and intersecting long-term trendline resistance (1.0582) relinquish ground. Concluding July higher by 3.5 percent, buyers appear free to explore as far north as 0.8303/0.8082 in August, a supply zone aligning closely with trendline resistance (prior support – 0.4776).
Despite recently taking trendline resistance, the market’s primary trend still points south, demonstrating a series of lower lows and lower highs since mid-2011.
Daily timeframe:
Brought forward from previous analysis –
By way of a bearish outside day, AUD/USD snapped a three-day winning streak from supply at 0.7264/0.7224 (stationed underneath another supply at 0.7346/0.7282) on Friday. This, despite Monday and Tuesday’s half-hearted bearish response, still has daily action perhaps bound for support at 0.7067.
With reference to the RSI indicator, we have been toying with overbought status since July 20, with the value recently nudging back beneath 60.00.
H4 timeframe:
Partially altered from previous analysis –
Demand at 0.7115/0.7144 remains a prominent fixture on this timeframe, containing downside both Monday and Tuesday.
Buyers, however, still seem somewhat uncertain, potentially unlocking the possibility of drawing in demand at 0.7082/0.7106, an area intersecting with local trendline support (0.7063), as well as a longer-term trendline support (0.6832).
H1 timeframe:
Partially altered from previous analysis –
H1 witnessed early trading this week get to know 0.7150 support, recently crossing paths with nearby 100-period simple moving average, currently circling 0.7181.
Sustained movement under 0.7150 today could set up a stop-fuelled decline to mild demand, circled in red around 0.7112, and the 0.71 level.
Structures of Interest:
Partially altered from previous analysis –
Monthly price sweeping through supply and associated trendline resistance has likely aroused interest from longer-term buyers. However, the fact we’re fading daily supply at 0.7264/0.7224 could lead to a retest at daily support from 0.7067.
With the daily timeframe’s structure in mind (targeting daily support at 0.7067), this implies a break of 0.7150 on the H1 may exceed the 0.71 level and H1 demand at 0.7073/0.7088.
Before reaching daily support at 0.7067, nonetheless, we would also need to dethrone H4 demand at 0.7082/0.7106, which, as we already know, is reinforced with two H4 trendline supports. Therefore, although daily price suggests downside could be in the offing, lower-timeframe buyers are likely to put up a fight.

USD/JPY:
Monthly timeframe:
(Technical change on this timeframe is often limited though serves as guidance to potential longer-term moves)
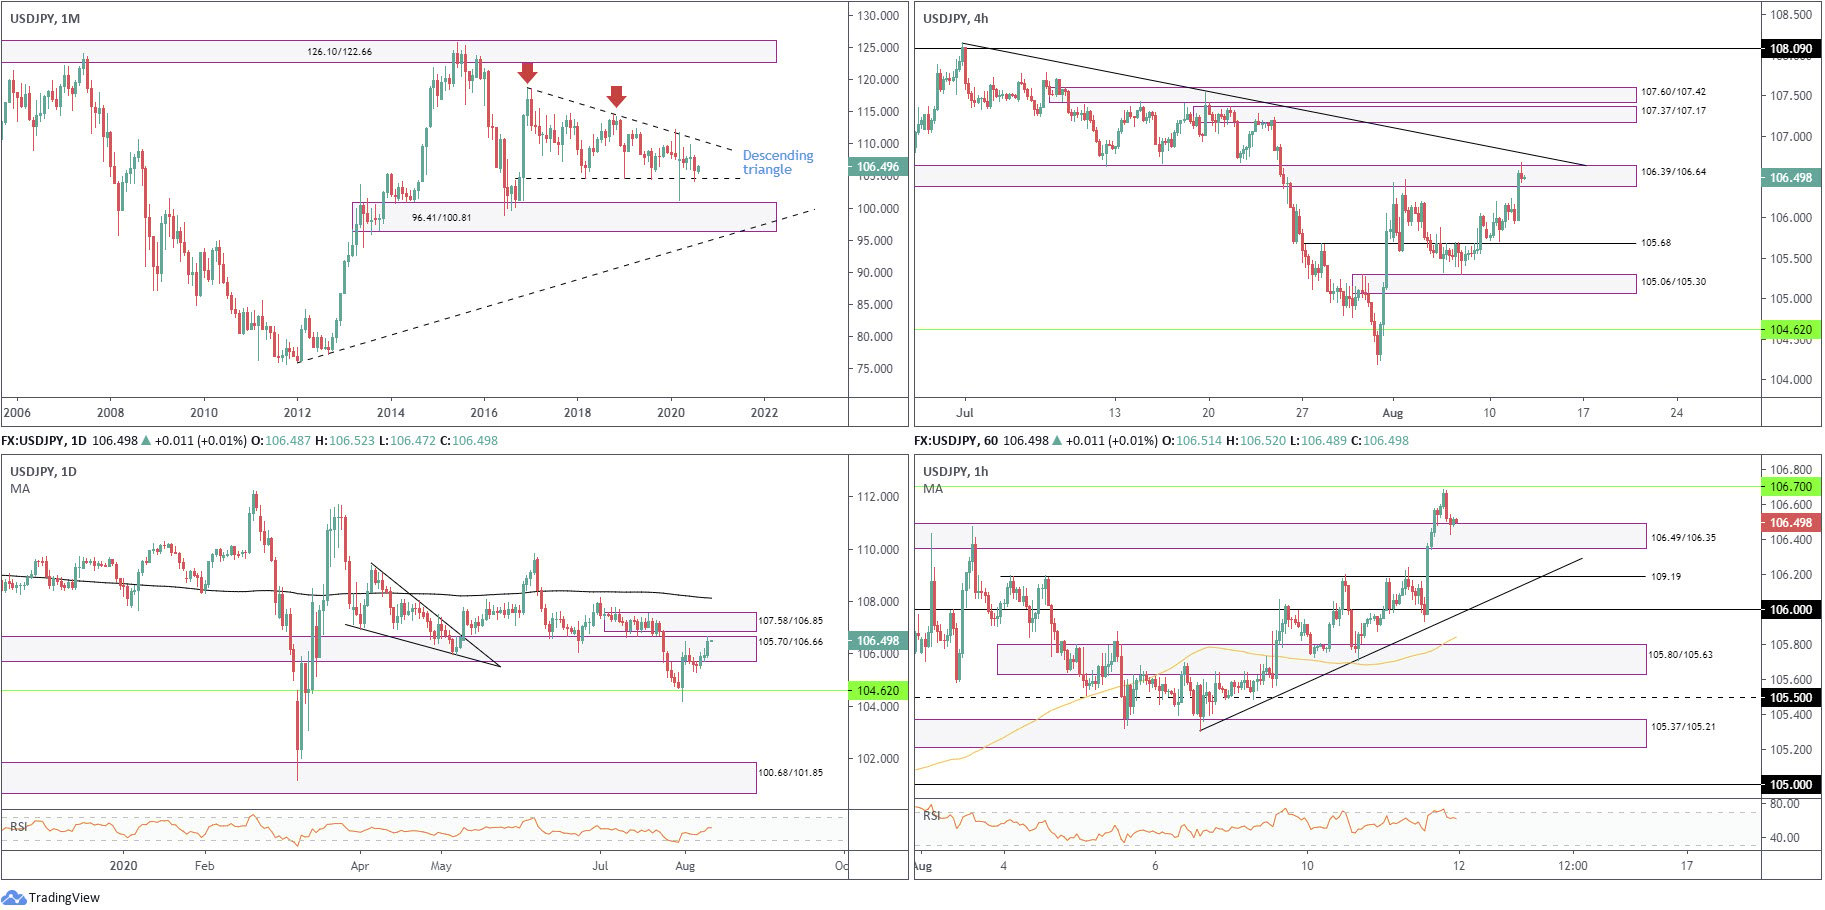
Since kicking off 2017, USD/JPY has been carving out a descending triangle pattern between 118.66/104.62.
April, May and June were pretty uneventful, with the latter wrapping up indecisively in the shape of a neutral doji candlestick pattern. July, nonetheless, sunk nearly 2 percent, consequently testing the lower boundary of the descending triangle.
August currently trades higher by 0.60 percent.
Areas outside of the noted triangle can be seen at supply from 126.10/122.66 and demand coming in at 96.41/100.81.
Daily timeframe:
Partially altered from previous analysis –
Having monthly support at 104.62 make a show, daily price recently made its way into supply at 105.70/106.66.
Eliminating 105.70/106.66 could perhaps pull in supply at 107.58/106.85.
The RSI value, thanks to recent buying notching up a third successive gain, traded marginally above 50.
H4 timeframe:
Another solid day of gains extended things north of support at 105.68, consequently taking H4 action to supply at 106.39/106.64, an area positioned nearby trendline resistance (108.16).
Climbing beyond the aforesaid levels today possibly builds a foundation to approach supply at 107.37/107.17 and another neighbouring supply at 107.60/107.42.
H1 timeframe:
US trading on Tuesday, following a clear-cut retest at the 106 level after fading 109.19 resistance, observed a sharp ascent which broke through supply at 106.49/106.35 and came within a few pips of reaching resistance at 106.70 before pulling back. The RSI value also tested overbought terrain.
106.49/106.35 re-entered the frame and, as of current price, is holding ground. Above 106.70, 107 is likely to call for attention.
Structures of Interest:
Coming off monthly support at 104.62, and with the next daily supply not seen until 107.58/106.85 (above 105.70/106.66), H1 demand at 106.49/106.35 could hold and take things through 106.70 resistance to 107. Dipping lower to H1 support at 109.19 is also a possibility.
GBP/USD:
Monthly timeframe:
(Technical change on this timeframe is often limited though serves as guidance to potential longer-term moves)
GBP/USD finished higher by 5.5 percent in July, leading to long-term trendline resistance (1.7191) abandoning its position.
Despite the primary trend facing lower since early 2008, rupturing current trendline resistance could have buyers work towards another prominent trendline resistance (2.1161) over the coming weeks.
August has so far offered little movement, trading lower by 0.1% as of current price.
Daily timeframe:
Brought forward from previous analysis –
After squeezing through the 200-day simple moving average (July 21), currently fluctuating around 1.2707, and toppling supply at 1.3021/1.2844, price action recently revisited the latter as a demand. To the upside, resistance at 1.3201 (ahead of a 161.8% Fib ext. level at 1.3264) is seen as the next point of interest.
The RSI oscillator, for those following momentum indicators, will note the value marginally exited overbought status, recently fading values as far north as 80.00.
H4 timeframe:
As we transitioned into US trading Tuesday, buyers stepped aside and formed what appears to be the beginning of a right shoulder to a potential head and shoulder’s pattern (1.3170/1.3185/1.3132). The neckline, as of current price, forms from 1.2981.
Technical structure, nonetheless, reveals demand at 1.2945/1.2989 is seen nearby, formed as part of stacked demand at 1.2948/1.2910.
Also particularly noteworthy on this timeframe is trendline support (1.2259).
H1 timeframe:
Partially altered from previous analysis –
Tuesday, as you can see, whipsawed through orders at 1.31 (and the 100-period simple moving average), testing pinnacles at 1.3133, before sinking back to 1.3050 support.
Dropping through 1.3050 today throws light on the widely watched 1.30 level, reinforced by demand coming in from 1.2977/1.3000.This demand is considered significant on this timeframe, due to it representing an area where a decision was made to break above 1.30.
Structures of Interest:
Partially altered from previous analysis –
Monthly breaking trendline resistance emphasises an optimistic tone for GBP this month. Daily price is attempting to secure a bullish position following a retest at daily demand from 1.3021/1.2844, though it appears buyers were recently chased off ahead of daily resistance at 1.3201.
H4 demand at 1.2945/1.2989 is likely watched by many traders, along with connecting H4 demand at 1.2948/1.2910. Noting the 1.30 figure inhabits territory just above H4 demand at 1.2945/1.2989 could see a whipsaw through the round number into the aforesaid demand (as well as H1 demand at 1.2977/1.3000). This, assuming a H1 close back above 1.30, may appeal to intraday buyers.
In addition to the above, keep eyes peeled for a break of the H4 head and shoulder’s neckline, drawn from 1.2981. This will be interpreted as a bearish signal among the technical community.

DISCLAIMER:
The information contained in this material is intended for general advice only. It does not take into account your investment objectives, financial situation or particular needs. FP Markets has made every effort to ensure the accuracy of the information as at the date of publication. FP Markets does not give any warranty or representation as to the material. Examples included in this material are for illustrative purposes only. To the extent permitted by law, FP Markets and its employees shall not be liable for any loss or damage arising in any way (including by way of negligence) from or in connection with any information provided in or omitted from this material. Features of the FP Markets products including applicable fees and charges are outlined in the Product Disclosure Statements available from FP Markets website, www.fpmarkets.com and should be considered before deciding to deal in those products. Derivatives can be risky; losses can exceed your initial payment. FP Markets recommends that you seek independent advice. First Prudential Markets Pty Ltd trading as FP Markets ABN 16 112 600 281, Australian Financial Services License Number 286354.


 Access +10,000 financial
instruments
Access +10,000 financial
instruments