
Patterns produced on candlestick (or bar) charts are created via underlying supply and demand.
- Demand represents buying
- Supply represents selling
While several interpretations exist concerning structure, technical supply, and demand zones on charts can be defined as noticeable price moves to leave behind a fresh untouched base.
Supply and Demand
The law of supply and demand is a theory explaining the interaction between sellers of a product and buyers for that product. According to market theory, the relationship between supply and demand balances out at a point in the future – the equilibrium price.
On charts, on all timeframes and in all markets, supply and demand can be viewed by way of zones, or sometimes referred to as turning points. It is believed supply and demand areas work due to unfilled orders left by institutional traders at the base.
Two primary groups of supply and demand zones are traded:
- Rally-Base-Rally (RBR) and Drop-Base-Drop (DBD)
- Rally-Base-Drop (RBD) and Drop-Base-Rally (DBR)
Unfortunately, exploring each in detail is beyond the scope of this article. Therefore, the focus will be directed to RBR and DBD zones, as displayed in figure 1.A, an H1 GBP/JPY chart.
A demand zone, or an RBR area, is best formed in an uptrend (or at the beginning of one). A trending market, in this case, can be identified via higher peaks/troughs.
As its name implies, an RBR takes on the shape of an initial advance (bullish). This should be prominent in the timeframe traded. A tight consolidation then forms (a base) followed by a strong continuation move to the upside. It is the base demand traders take interest in for buying opportunities.
A DBD area, a supply zone (bearish) formed within a downtrend (or the beginning of one), offers a similar structure, only reversed.
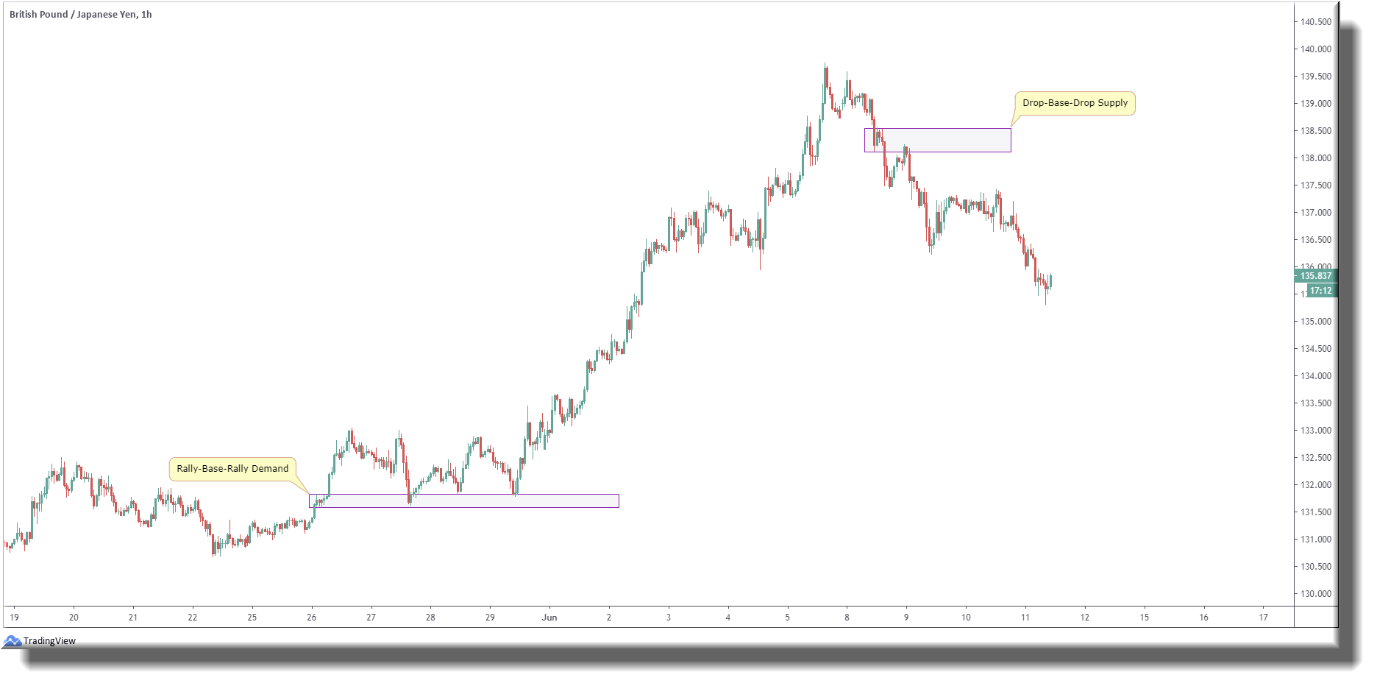
(FIGURE 1.A)
High-Probability Zones
While each trader has their own process to identify supply and demand, three established standards are shared.
Strength:
Traders watch for robust momentum to form out of the base, demonstrating one-sided control of the market at the time of formation: a healthy zone.
As you can see in figure 1.B, both the RBR and DBD areas generated sizeable moves out of their base (blue).
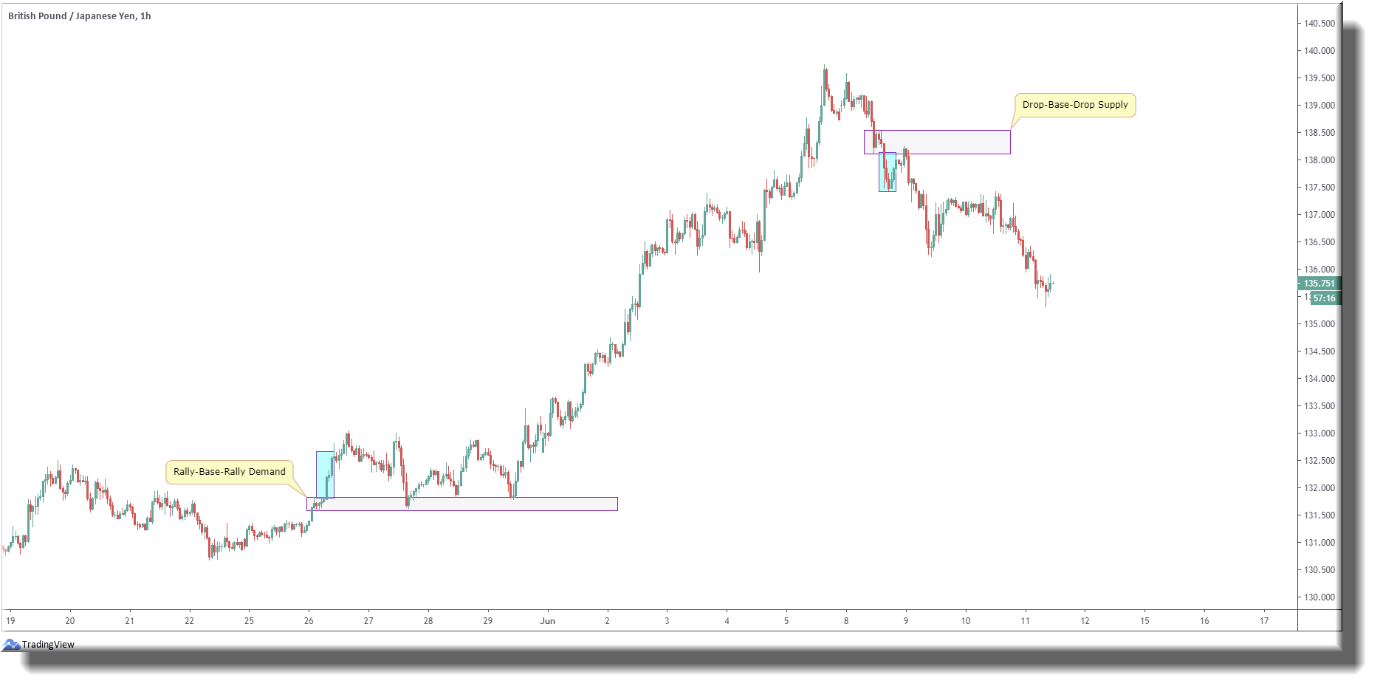
(FIGURE 1.B)
Context:
Although an area may display strength, the overall picture must be taken into consideration.
As illustrated in figure 1.C, traders will note the RBR demand area overthrew a relatively notable high to the left of price action, representing strong intent from buyers and lack of enthusiasm from sellers. The same is seen for our DBD supply setup, only reversed.
The key point here is to be aware of the local surroundings. If momentum out of the base fails to penetrate the local structure, this may be a zone worthy of the sidelines.
Traders can also benefit from knowing what’s going on higher up on the curve. Entering long from a sound demand on the H1 timeframe that formed under the walls of an H4 supply is unlikely to produce much upside as higher-timeframe areas usually take precedence. This is where multi-timeframe analysis helps.

(FIGURE 1.C)
Time away from the zone:
RBR and DBD zones usually form in line with the current trend.
Therefore, if price spends considerable time away from the zone after completing its final leg, when, or indeed if, movement returns to the base, market sentiment (the trend) is likely to be against the area possibly causing an unnecessary loss.
Figure 1.D shows an example of an RBR area that formed on the GBP/JPY H4 chart. Price returned to the base after a lengthy period and failed in dramatic fashion. Just to be clear, though, this is not to say all areas visited following a lengthy duration away from the zone will fail.
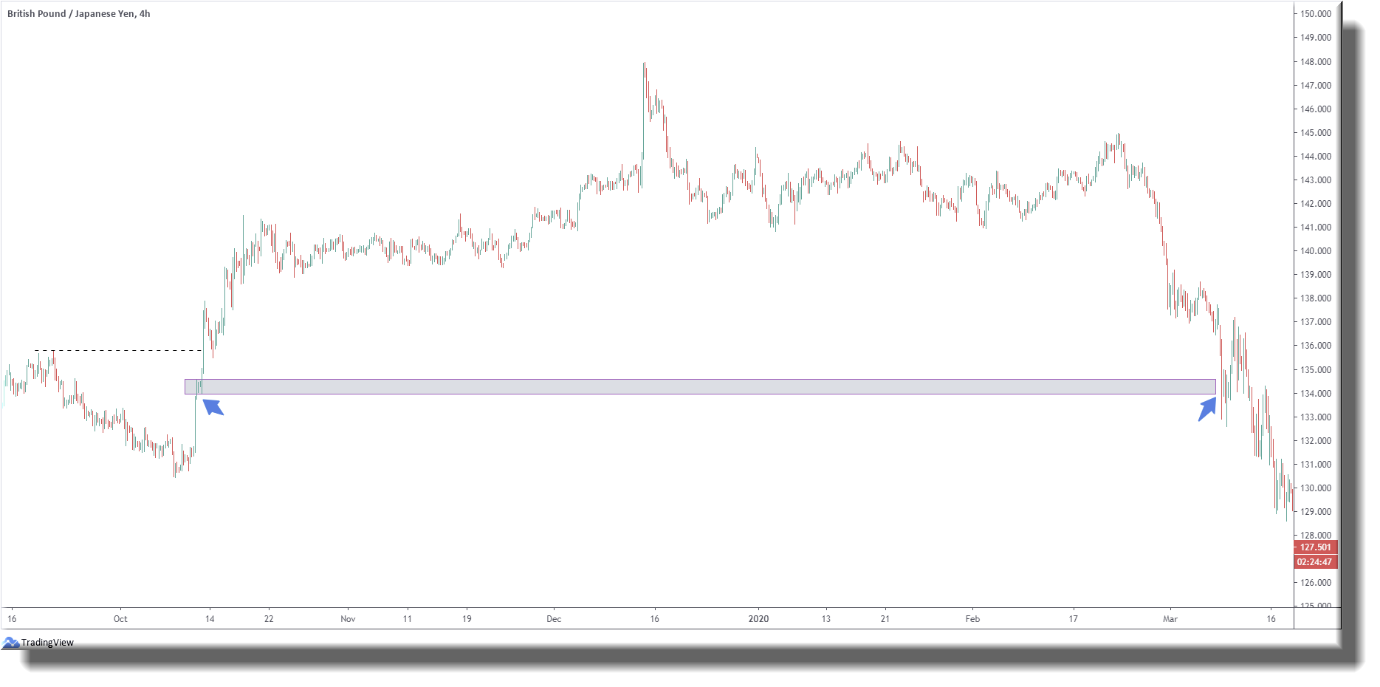
(FIGURE 1.D)
Trading Supply and Demand
RBR or DBD areas that include the three standards presented above provide high-probability zones to consider.
While the selection of a zone is important, how we trade the base is just as crucial.
A zone that’s fresh is desirable. Two conditions must be met in order to confirm an area’s freshness. The zone should be isolated, meaning void of assistance from the surrounding structure. Secondly, the base must be untouched upon forming the final leg out of the base. Figure 1.C (above) displays fresh RBR and DBD zones.
The first time back to an area is also considered the most optimal time to trade. Subsequent tests may hold, of course, though likely with less probability as orders may have weakened.
Although trader specific, entry orders at the base, either market or limit, are generally set around the edge, with protective stop-loss orders plotted beyond the opposite edge. As for take-profit targets, again trader specific, taking aim at supply/demand areas visible in the opposite direction might be a logical place to begin.
For example, an RBR demand area will have buy orders congregating around the upper portion of its base, with stops located under the area’s opposite edge and take-profit targets set at the next visible supply. This enables traders to confidently calculate risk/reward metrics before each trade is executed.
Moving Forward
Supply/demand zones remain popular trading strategies, suitable for Forex trading as well as CFD trading.
You will often find traders merge supply and demand areas with other methods found within the field of technical analysis, such as support and resistance levels, trendlines, and indicators. Combined, this is a formidable trading system.
If you found this article helpful, be sure to let us know. Additionally, feel free to check out our in-depth daily technical analysis, focusing on supply and demand areas via a multi-timeframe approach.
Why not also consider experimenting with supply and demand on one of our cutting edge demo accounts.
DISCLAIMER: The information contained in this material is intended for general advice only. It does not take into account your investment objectives, financial situation, or particular needs. FP Markets has made every effort to ensure the accuracy of the information as at the date of publication. FP Markets does not give any warranty or representation as to the material. Examples included in this material are for illustrative purposes only. To the extent permitted by law, FP Markets and its employees shall not be liable for any loss or damage arising in any way (including by way of negligence) from or in connection with any information provided in or omitted from this material. Features of the FP Markets products including applicable fees and charges are outlined in the Product Disclosure Statements available from FP Markets website, www.fpmarkets.com, and should be considered before deciding to deal with those products. Derivatives can be risky; losses can exceed your initial payment. FP Markets recommends that you seek independent advice. First Prudential Markets Pty Ltd trading as FP Markets ABN 16 112 600 281, Australian Financial Services License Number 286354.


 Access +10,000 financial
instruments
Access +10,000 financial
instruments