
Reading Time: 14 Minutes
Numerous CFD trading strategies are littered across the internet, ranging from simple for beginner traders to more complex for experienced traders. CFDs function as derivative trading instruments, offering access to global markets, such as stocks, foreign exchange (Forex), commodities, and other financial instruments like indices, and cryptocurrencies (bitcoin and Ethereum, for example). This enables the trader to buy and sell without owning the underlying asset.
In Australia, countless Contract for Difference (CFD) brokerages exist. Most include desktop and mobile apps for your PC, smartphone, or tablet that are compatible with Android and iOS. Ensure you choose a regulated Forex broker by ASIC (Australian Securities and Investments Commission).
CFD traders in Australia, and around the world, employ trading strategies to navigate the financial markets to generate trading decisions based on predefined rules and criteria.
What strategy suits you and your investment style, irrespective of where you are based worldwide? This article highlights some of the top trading strategies used in 2022.
Top Trading Strategies
It is important to acknowledge that there are four trading styles: scalping and day trading (both short-term in nature), swing trading, and position trading (longer-term approaches). Trading strategies generally fall under the umbrella of one of these trading styles.
Scalping:
As a scalper, numerous trading strategies exist. Scalping involves taking multiple positions throughout the trading session to generate more winning than losing trades. With scalping, we work with an inverse reward-to-risk ratio. For example, on average, the trades produce winning positions of 70 USD, but when they lose, they lose by 100 USD. The losses tend to be contained with a protective stop-loss order (risk management).
A popular trading strategy in the scalping bucket involves using the relative strength index (RSI) and trend studies. The trend is identified in the 5-minute timeframe, and the strategy is traded in the 1-minute timeframe.
As an example, figure 1.A demonstrates the 5-minute trend on the GBP/JPY, which shows the trend facing higher (higher highs and higher lows). This is the first requirement.
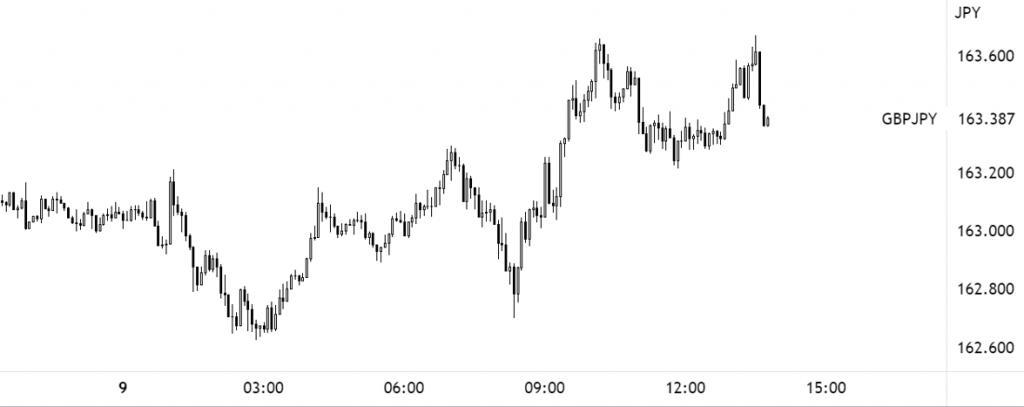
Figure 1.A (5-Minute GBP/JPY Chart – TradingView)
The second step requires the trader to look for buying opportunities as the RSI exits oversold space (30.00) on the 1-minute chart. As shown in figure 1.B, the GBP/JPY 1-minute chart shows the indicator departed oversold and offered a buy signal (red arrow), with another buy entry displayed following positive divergence (blue arrow-line).
Protective stop-loss orders are generally placed below (above) the respective low (highs) formed prior to the signal.
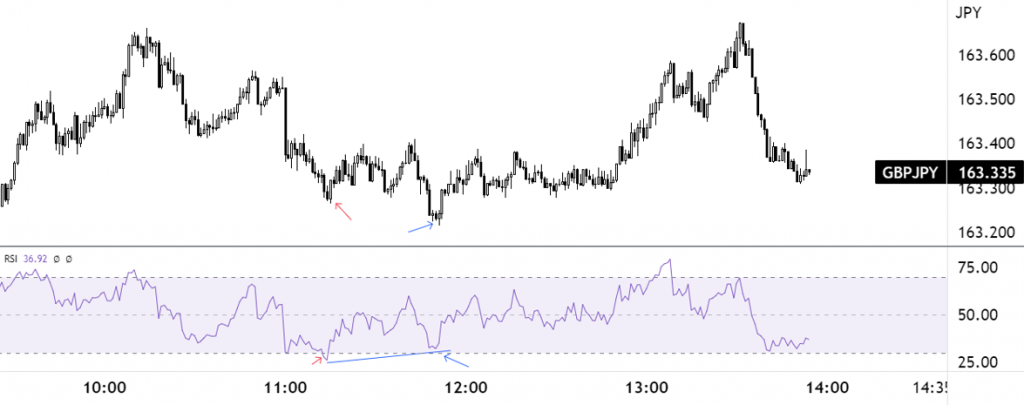
Figure 1.B (1-Minute GBP/JPY Chart – TradingView)
Day Trading:
Breakout trading is one of the main methods employed by day traders.
A common breakout approach occurs when the stock market price climbs beyond previous resistance or support. Breakout trading can be as simple as buying at the close of the breakout candle; other strategies seek additional filters, such as waiting for a (successful) retest of the breached support or resistance level, while another strategy may want to see price close not only beyond the support or resistance but also a short-term moving average. Volume is another filter used to help confirm a breakout; higher volume on the breakout tends to suggest follow-through action is likely to unfold. It is more challenging to profit from lower-volume breakouts since they are more likely to fizzle out as there’s limited interest seen in the move.
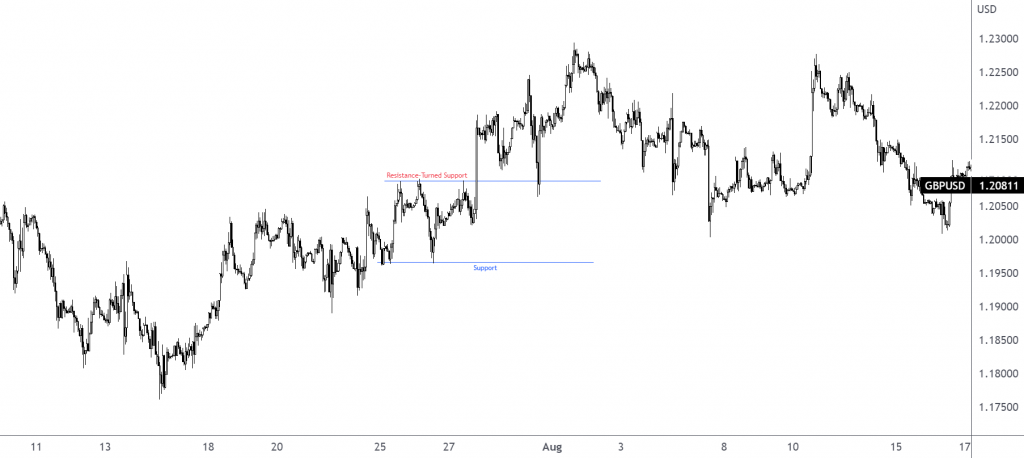
Figure 1.C—GBP/USD H1 chart—shows a bullish breakout on 27th July that followed up with a retest as support on 1st August to continue higher.
How the trader confirms a retest is trader dependent. If a Japanese candlestick pattern is used, then the entry and stop-loss order are governed by that candlestick pattern’s arrangement.
Figure 1.C. (1-Hour GBP/USD Chart – TradingView)
Swing Trading:
Bollinger Bands, created by John Bollinger, is a popular trading indicator used by swing traders.
To make conceptual and strategic trading decisions, the Bollinger Bands technique is frequently employed, usually in conjunction with other indicators. An upper band, a middle band, and a lower band make up the Bollinger Band indicator, with the upper and lower bands generally set to two standard deviations.
The outer bands are intended to draw attention to price movements away from the mean, and can therefore open up mean reversion strategies.
The higher band denotes overbought equities (or currencies, for example), the lower band denotes oversold securities, and the center band functions as a moving average, the mean.
As a swing trading strategy, market participants look to fade the outer bands, and target either the mean value (mean reversion) or the opposing band. While other technical tools are often used to confirm the Bollinger Bands, trend direction is a primary note for many traders and investors.
As an example, figure 2.A, the H4 timeframe’s GBP/USD chart, shows the currency pair in a downtrend. Therefore, traders will often look to initiate sell positions when the price tests the upper band. Do note that at times you will see the price close above the upper band, which can be considered a bullish breakout signal. However, to help, traders often wait for bearish Japanese candlestick formations to emerge before pulling the trigger (helps set entry and risk). An example of a bearish scenario unfolding is seen marked with a blue arrow in the example below on 4th May 2022.
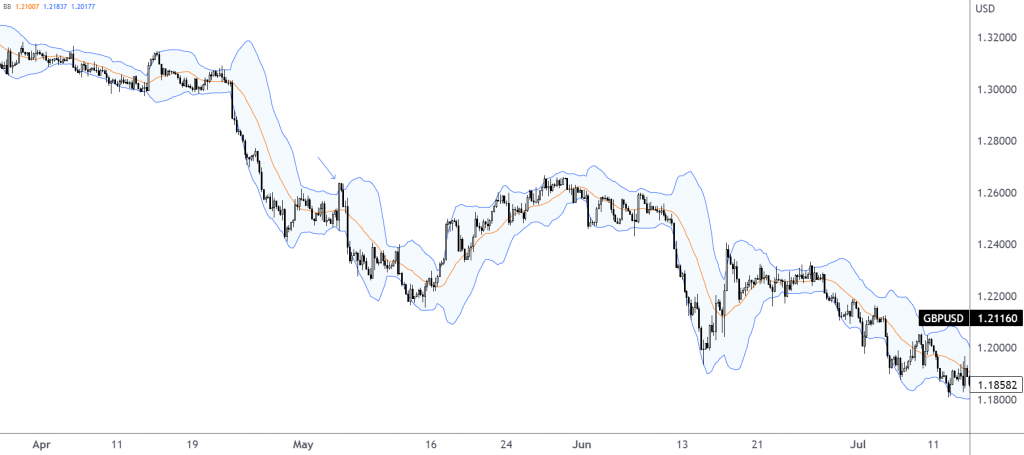
Figure 2.A (H4 GBP/USD Chart – TradingView)
Position Trading:
Trend following, or trend trading, is a trading method in which an investor attempts to identify and profit from trends in the market.
A common trend-following strategy involves the 200-day simple moving average and the 50-day simple moving average: a crossover strategy between the two moving averages.
The calculation of the 50-Day Simple Moving Average involves summing up the previous 50 daily closing prices and dividing the result by 50 (the total number of observations), whilst the calculation of the 200-Day Simple Moving Average involves adding the last 200 daily closing prices and dividing the result by 200.
Figure 2.B shows the EUR/USD on the daily timeframe with the 200-day Simple Moving Average and the 50-Day Simple Moving Average applied. Traders tend to trade the crossover of the said moving averages. So, when the 50-Day Simple Average crosses above the 200-Day Simple Moving Average, this is considered a bullish signal—buy signal. Conversely, when the 50-Day Simple Moving Average crosses below the 200-Day Simple Moving Average, this tends to be viewed as a longer-term sell signal (bearish).
The ‘cross’ offers trend traders a signal to potentially enter a market that could witness a long-term trend unfold. Traders tend to HOLD their position for the long term until they receive an opposing signal (if long, this would be the 50-day Simple Moving Average crossing back under the 200-day Simple Moving Average). Generally, you will find the initial protective stop-loss order is positioned according to market structure: nearby support and resistance.
Another way position traders view the market with moving averages is to look to the direction of the 200-day Simple Moving Average. When the 200-Day Simple Moving Average turns higher, this is generally a signal to buy and hold until the Simple Moving Average turns lower.
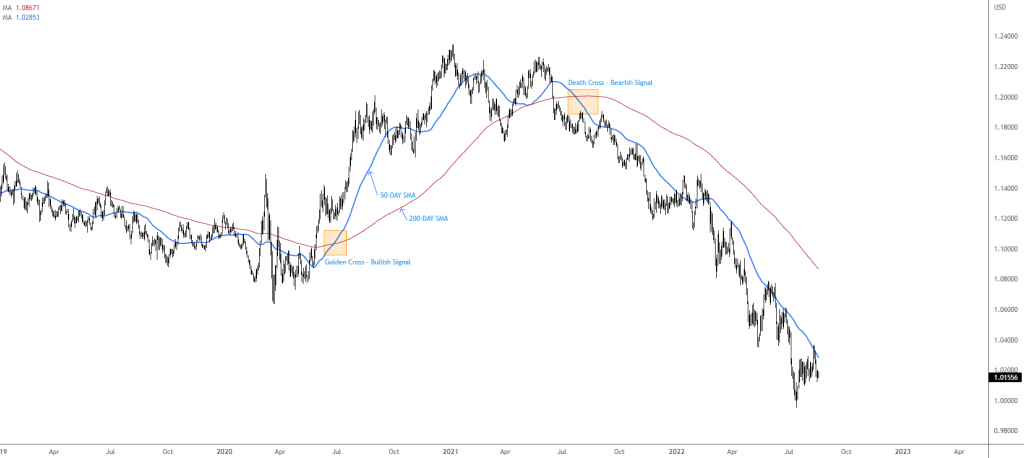
Figure 2.B (Daily Timeframe GBP/USD Chart – TradingView)
FAQ
Are CFDs Regulated in Australia?
They can be regulated by ASIC, for example. https://asic.gov.au/
Is CFD Trading Taxable in Australia?
Traders should include any profits in their taxable income, though traders are encouraged to seek tax advice.
The Best Forex Trading Broker In Australia?
There is no one top CFD broker in Australia; nevertheless, FP Markets, CMC Markets, eToro, and Avatrade, four prominent providers, all offer retail investor accounts. Trading fees are clearly described but subject to variation, including inactivity fees.
Addendum
With FP Markets, a fully regulated broker that’s regulated by the Australian Securities and Investments Commission (ASIC), why not practice your CFD trading strategies with a risk-free demo account offering virtual funds? For European traders, FP Markets is also regulated by the Cyprus Securities and Exchange Commission (CySEC).
FP Markets offer a number of CFD products and financial services. They are known for top-rate customer support, choice of CFD trading platforms with numerous technical analysis tools available, and different trading account types and platforms, such as MetaTrader 4 (MT4) and (MT5) Iress and web trader.
FP Markets offers over 60+ FX currency pairs in all major currency pairs, including the US dollar (USD) as the base or counter currency. Majors include pairs like the GBP/USD, EUR/USD, and AUD/JPY with tight spreads, social trading, and transparent trading costs. In addition, an array of funding options are available, including credit card, debit card, bank transfer, PayPal, and many more.


 Access +10,000 financial
instruments
Access +10,000 financial
instruments