
Your weekly review of technical patterns and structure.
The research team scans the financial markets for you, highlighting clear and actionable technical structures.
Forex: Anyone for a Death Cross?
Daily Timeframe –
The US Dollar Index recently chalked up what’s referred to as a Death Cross in technical circles. The 50-day simple moving average (105.69 – red) crossing beneath the 200-day simple moving average (106.37 – blue) indicates that a long-term bear market could be on the table for the USD. However, note that false signals are common should the market transition into a consolidatory phase.
Check out the Golden Cross (opposite of a Death Cross) forming in July 2021 and the resulting uptrend.

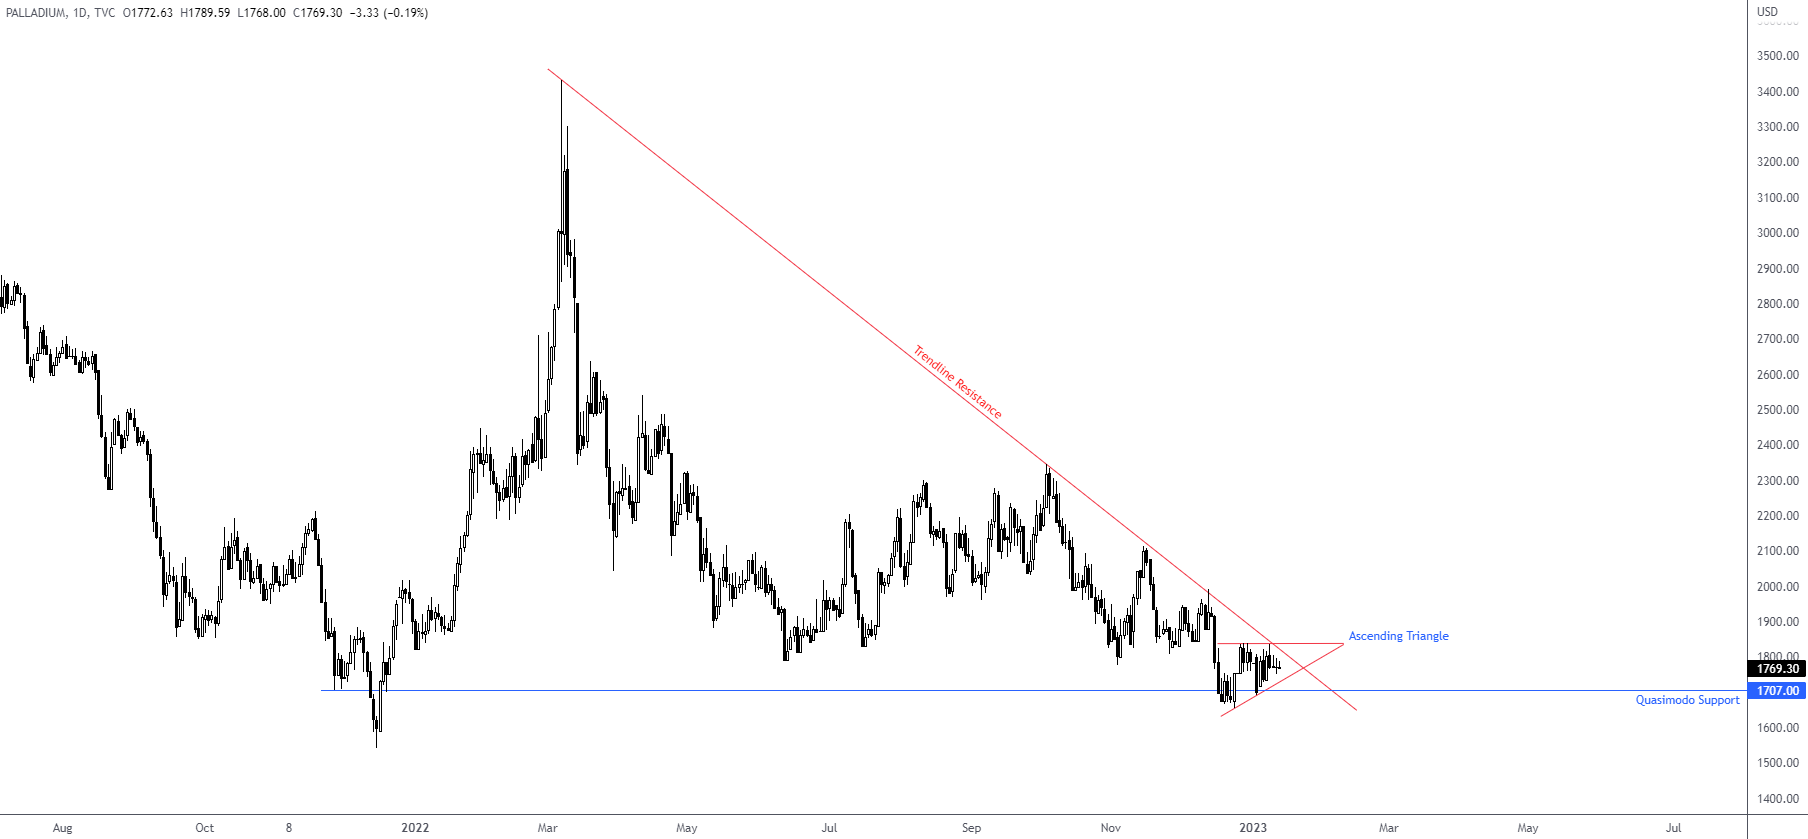
Commodities: Palladium Compressing within an Ascending Triangle
Daily Timeframe –
Palladium, one of the four major precious metals, is showing signs of bottoming, according to an ascending triangle (taken from $1,655 and $1,840) forming off the $1,707 support. While this pattern is generally categorised as a continuation structure—usually found in an uptrend—it can also print a reversal formation.
Therefore, a breakout above the upper boundary of the noted triangle pattern, coupled with a break of a longer-term trendline resistance, extended from the high $3,433, could stir countertrend traders and underpin movement higher.
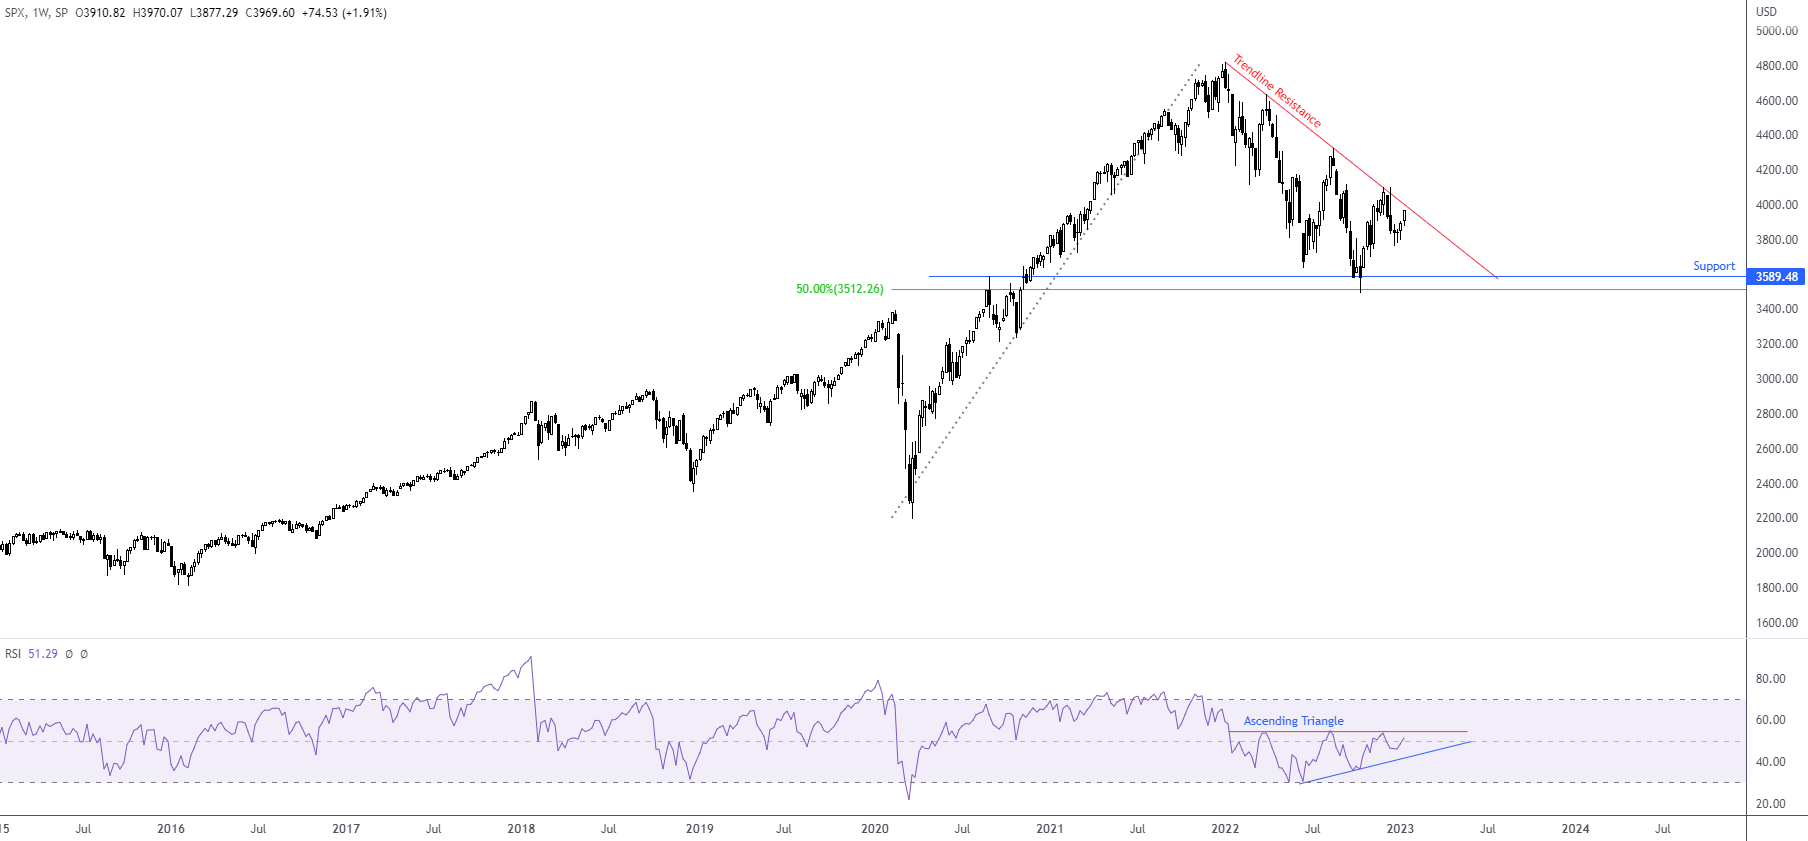
Equities: RSI Ascending Triangle enough to Breach Trendline on the S&P 500?
Weekly Timeframe –
The relative strength index (RSI), a widely popular momentum gauge among technical analysts, is pencilling in an ascending triangle pattern on the weekly timeframe as a potential reversal formation (between 30.47 and 53.72). Should a breakout north materialise here, trading beyond the indicator’s 50.00 centreline, this informs market participants that average gains exceed average losses (positive momentum). Consequently, such movement may raise the S&P 500’s weekly price north of trendline resistance, drawn from the high of 4,818, and signal a possible trend reversal.
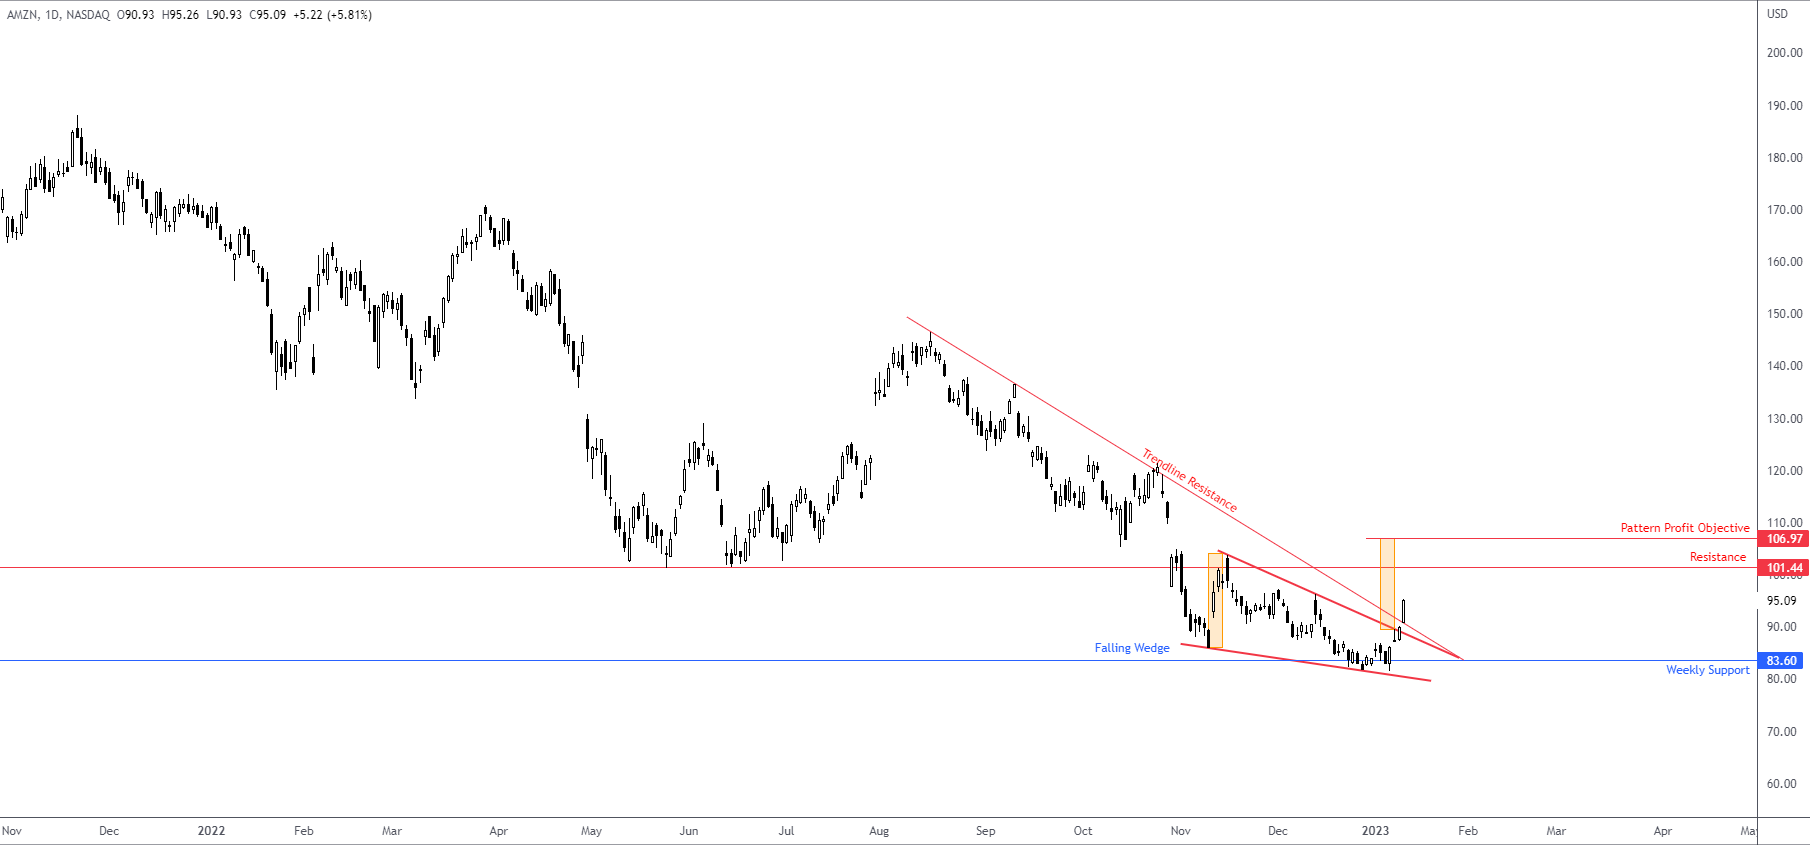
Amazon (AMZN): Breaking Out to the Upside?
Daily Timeframe –
Following a 50.0% slump last year, could things be on the up for Amazon?
After the price bottomed at weekly support from $83.60, Wednesday witnessed a breakaway gap that forged a breakout above trendline resistance, taken from the high $146.57. Technicians will see that a breakout above a falling wedge also occurred, drawn from between $103.79 and $85.87. This is a reversal structure, with many traders often taking the base value and adding this to the breakout point (orange rectangles) to calculate a profit objective, which, in this case, is set at $106.97, fixed above resistance at $101.44.
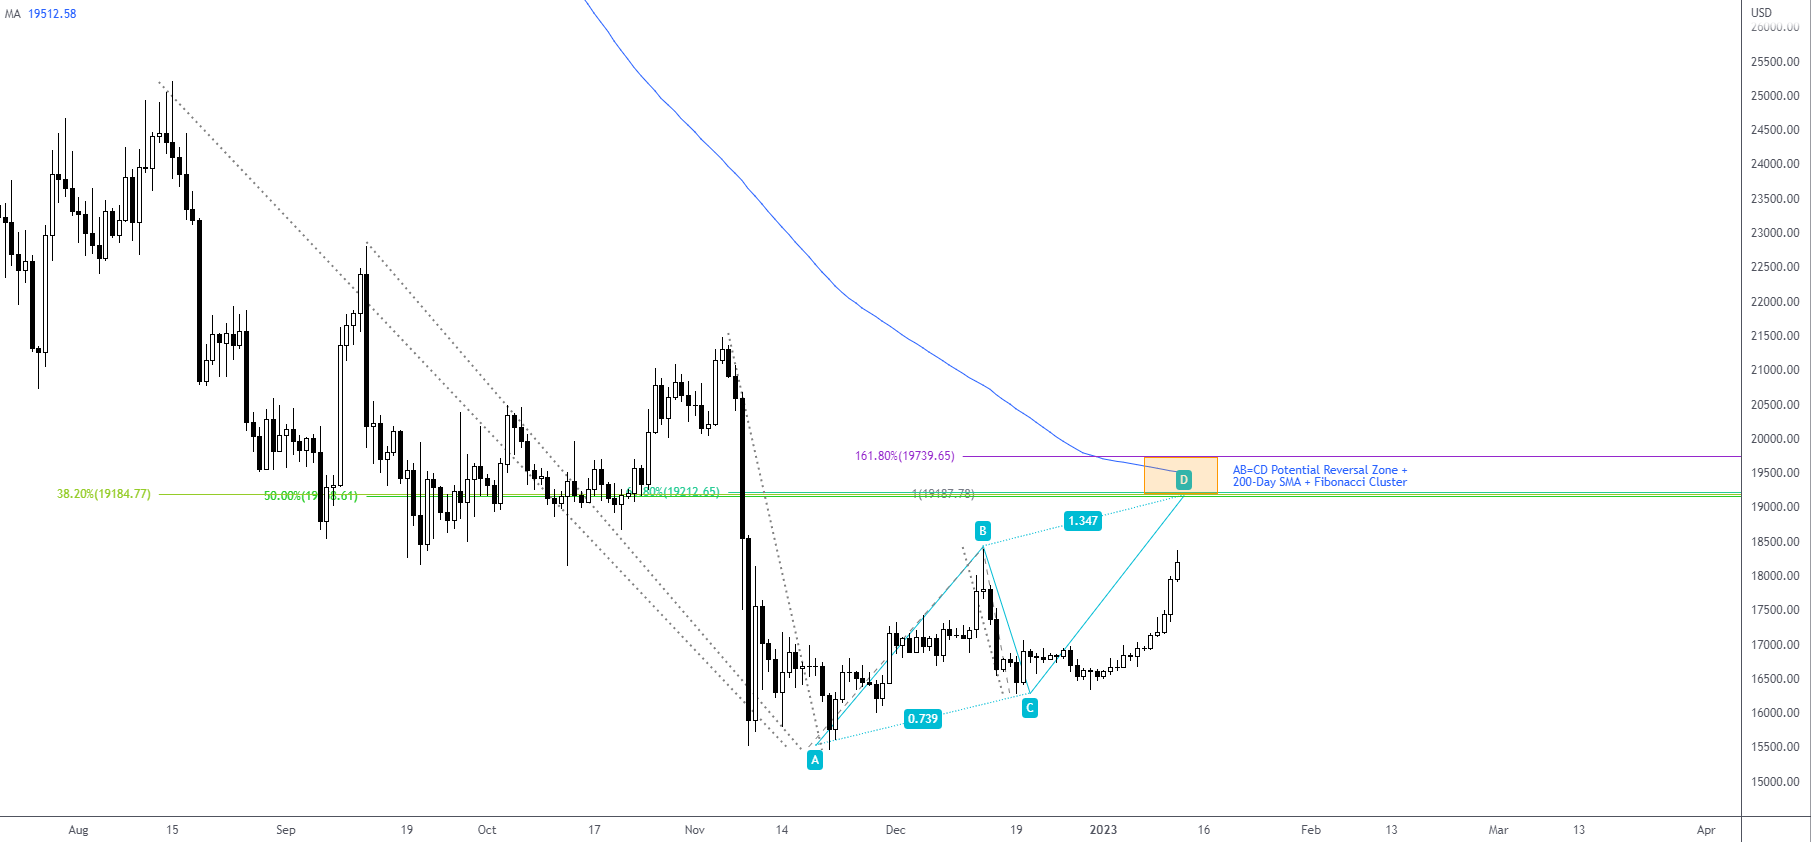
Cryptocurrency: BTC/USD AB=CD Bearish Formation in Sight
Daily Timeframe –
Bitcoin against the US dollar (BTC/USD) has recently broken out to the upside and drawn attention to an AB=CD Potential Reversal Zone (PRZ) between $19,739 and $19,187. You may note that this area converges with a 200-day simple moving average, currently trading at $19,512. Note that a moderate Fibonacci cluster also formed around the lower boundary of the PRZ. Overall, then, a break above the $18,385 14 December high could be interesting.
 Charts: TradingView


 Access +10,000 financial
instruments
Access +10,000 financial
instruments