
Your weekly review of technical patterns and structure.
The research team scans the financial markets for you, highlighting clear and actionable technical structures.
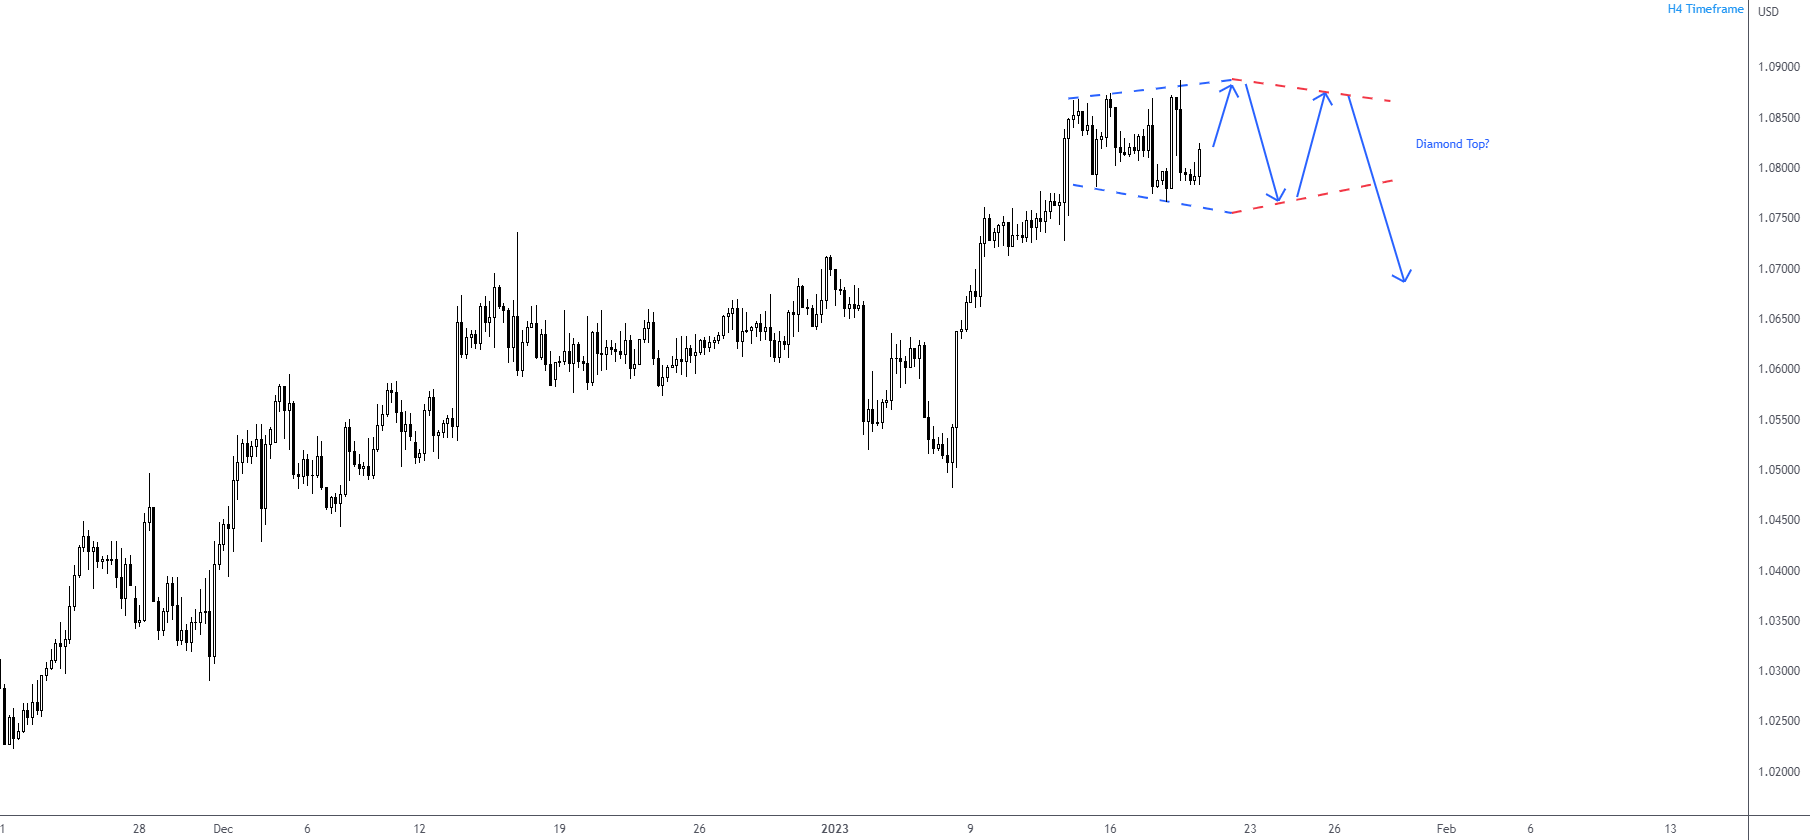
Forex: EUR/USD Diamond Top?
H4 Timeframe –
Although one of the less frequent pattern formations, it is considered a high-probability structure when it forms.
The chart shows a broadening pattern between $1.0867 and $1.0780, which could subsequently develop into a symmetrical triangle (coil) to create a diamond top reversal pattern.
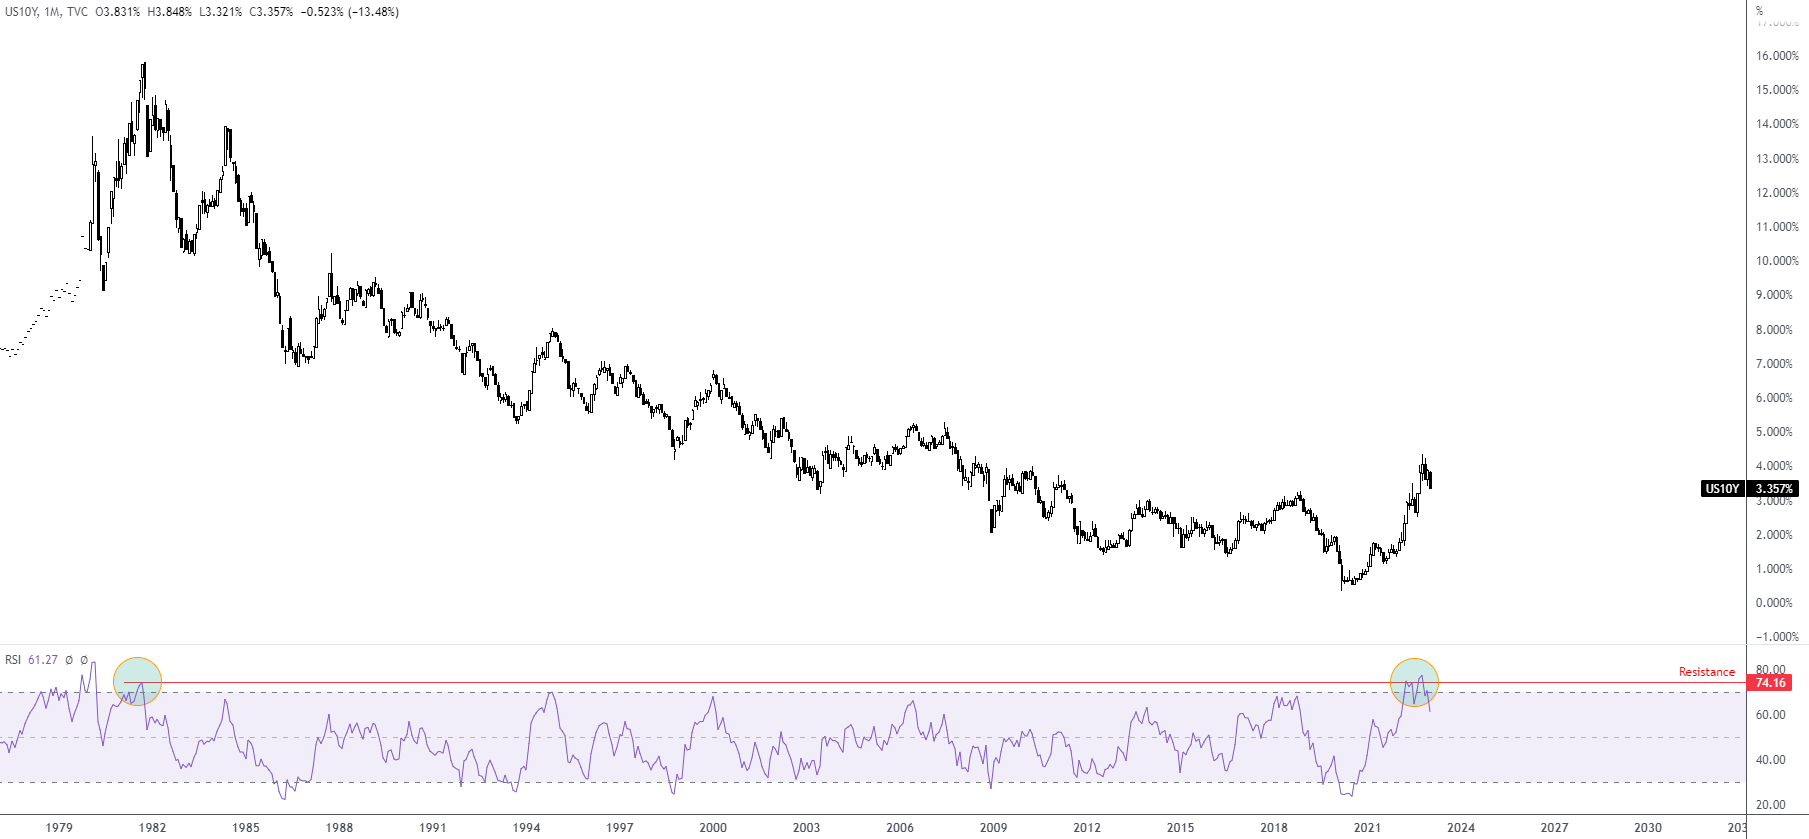
 Bonds: Overbought Conditions for the 10-Year Yield
Monthly Timeframe –
The benchmark 10-year US Treasury yield is down 48 basis points (nearly 14%) month to date. This, as evident from the chart below, is accompanied by the Relative Strength Index (RSI) testing overbought levels (77.31) not seen since the 1980s. Note that the RSI has also reacted from a neighbouring resistance of 74.16.
 Commodities: Copper Futures Crossing Swords with Resistance
Daily Timeframe –
The daily chart of copper futures has hit the pause button on its recent surge, reacting from a clear-cut Fibonacci Cluster, pencilled in between $4.31 and $4.26. Note that the area draws additional confluence from an ascending channel resistance, extended from the high of $3.96, and overbought conditions out of the Relative Strength Index (RSI).
Moderate Fibonacci support is visible nearby the ascending channel support (drawn from the low $3.36) at circa $3.87.
 Equities: Common Upside Gap Visible on the S&P 500
H1 Timeframe –
The H1 chart revealed a common gap between 3,919 and 3,928 in recent trading, which may serve as possible support. The gap area is joined by 38.2% and 61.8% Fibonacci retracement ratios at 3,919 and 3,930, respectively. Perhaps most importantly, though, is the H1 gap also converges with daily support at 3,921.
 Cryptocurrency: BTC/USD Weekly Falling Wedge Completion
Weekly Timeframe –
Bitcoin against the US dollar (BTC/USD) has recently broken out to the upside and pushed through the upper limit of a falling wedge pattern (reversal structure), drawn between $25,214 and $17,567. You will note this was accompanied by the Relative Strength Index (RSI) chalking up positive divergence ahead of oversold territory (the indicator also recently crossed above its 50.00 centreline [positive momentum]).
The profit objective can be derived from taking the base value and projecting this from the breakout point to achieve approximately $25,698.
 Charts: TradingView


 Access +10,000 financial
instruments
Access +10,000 financial
instruments