
Charts provided by Trading View
EUR/USD:
Monthly timeframe:
(Technical change on this timeframe is often limited, though serves as guidance to potential longer-term moves)
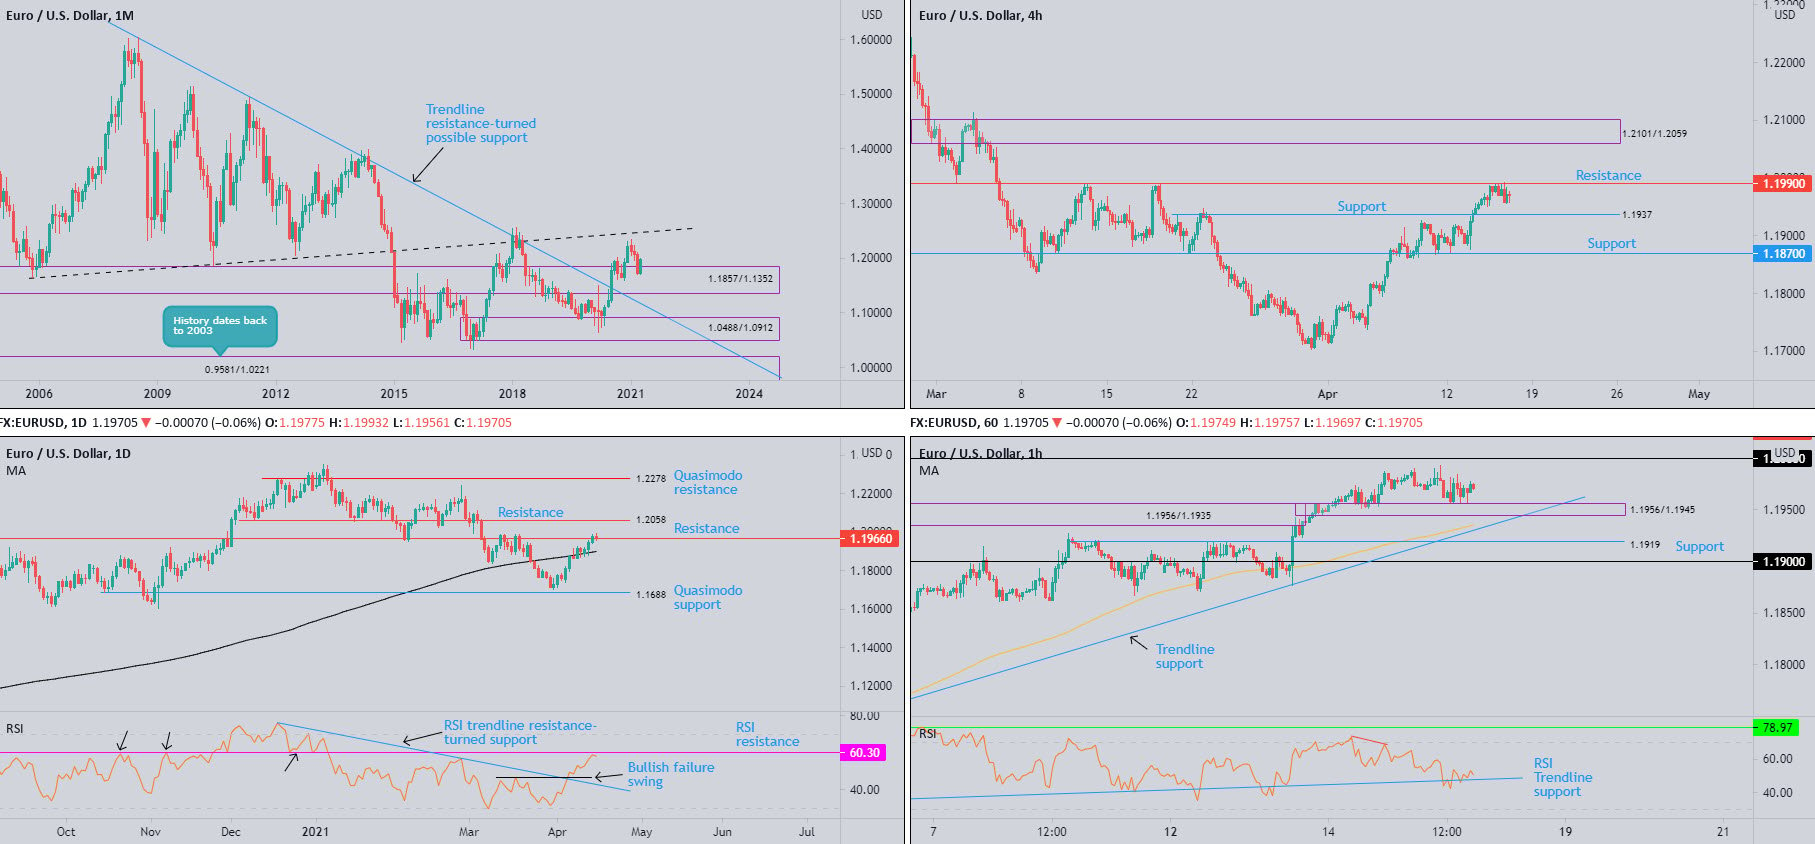
March carved out a third consecutive loss, extending the 2021 retracement slide by 2.8 percent. Recent underperformance, as you can see, pulled EUR/USD into the upper range of demand at 1.1857-1.1352.
April’s 2.1 percent rebound from the aforesaid demand thus far shifts attention to the possibility of fresh 2021 peaks and a test of ascending resistance (prior support – 1.1641). Extending lower, on the other hand, shines the technical spotlight on trendline resistance-turned support, taken from the high 1.6038.
Based on trend studies, the primary uptrend has been underway since price broke the 1.1714 high (Aug 2015) in July 2017.
Daily timeframe:
Partly modified from previous analysis.
Despite US retail sales surging 9.8 percent in March, and US unemployment claims totalling 576,000 (consensus: 703,000), the US dollar index concluded Thursday unmoved.
EUR/USD, as you can see, engages with resistance drawn from 1.1966. Additional bullish sentiment directs the technical radar to another layer of resistance at 1.2058.
Despite the 2021 retracement slide, trend studies reveal the pair has been trending higher since early 2020.
RSI analysis has the value hovering within TOUCHING distance of resistance at 60.30. This follows a trendline resistance breach last week (taken from the peak 75.97) as well as a bullish failure swing.
H4 timeframe:
Although the pair left behind a muted tone on Thursday, resistance at 1.1990 made an entrance.
Traders will be looking to 1.1937 to provide support should a modest decline materialise. A 1.1990 breach, on the other hand, shines the technical spotlight on supply at 1.2101-1.2059, which happens to rest on top of daily resistance at 1.2058.
H1 timeframe:
1.1956-1.1945 demand is an area of technical importance on the H1 scale, representing a decision point to break through remaining offers within supply at 1.1956-1.1935.
South of demand, analysts will note trendline support, extended from the low 1.1738, aligning with the 100-period simple moving average at 1.1935. Equally important, of course, is potential resistance residing around the 1.20 figure, a widely watched psychological level.
RSI action dipped to trendline support, taken from the low at 20.57.
Observed levels:
Longer-term flow reveals monthly price showing signs of bullish life out of demand at 1.1857-1.1352, potentially placing upside pressure on daily resistance at 1.1966.
Across the page on the shorter-term charts, we can see that although H1 demand is respected structure at 1.1956-1.1945, H1 trendline support and the 100-period simple moving average at 1.1935 could be the more appealing supports, having seen a convergence with H4 support at 1.1937.
AUD/USD:
Monthly timeframe:
(Technical change on this timeframe is often limited, though serves as guidance to potential longer-term moves)
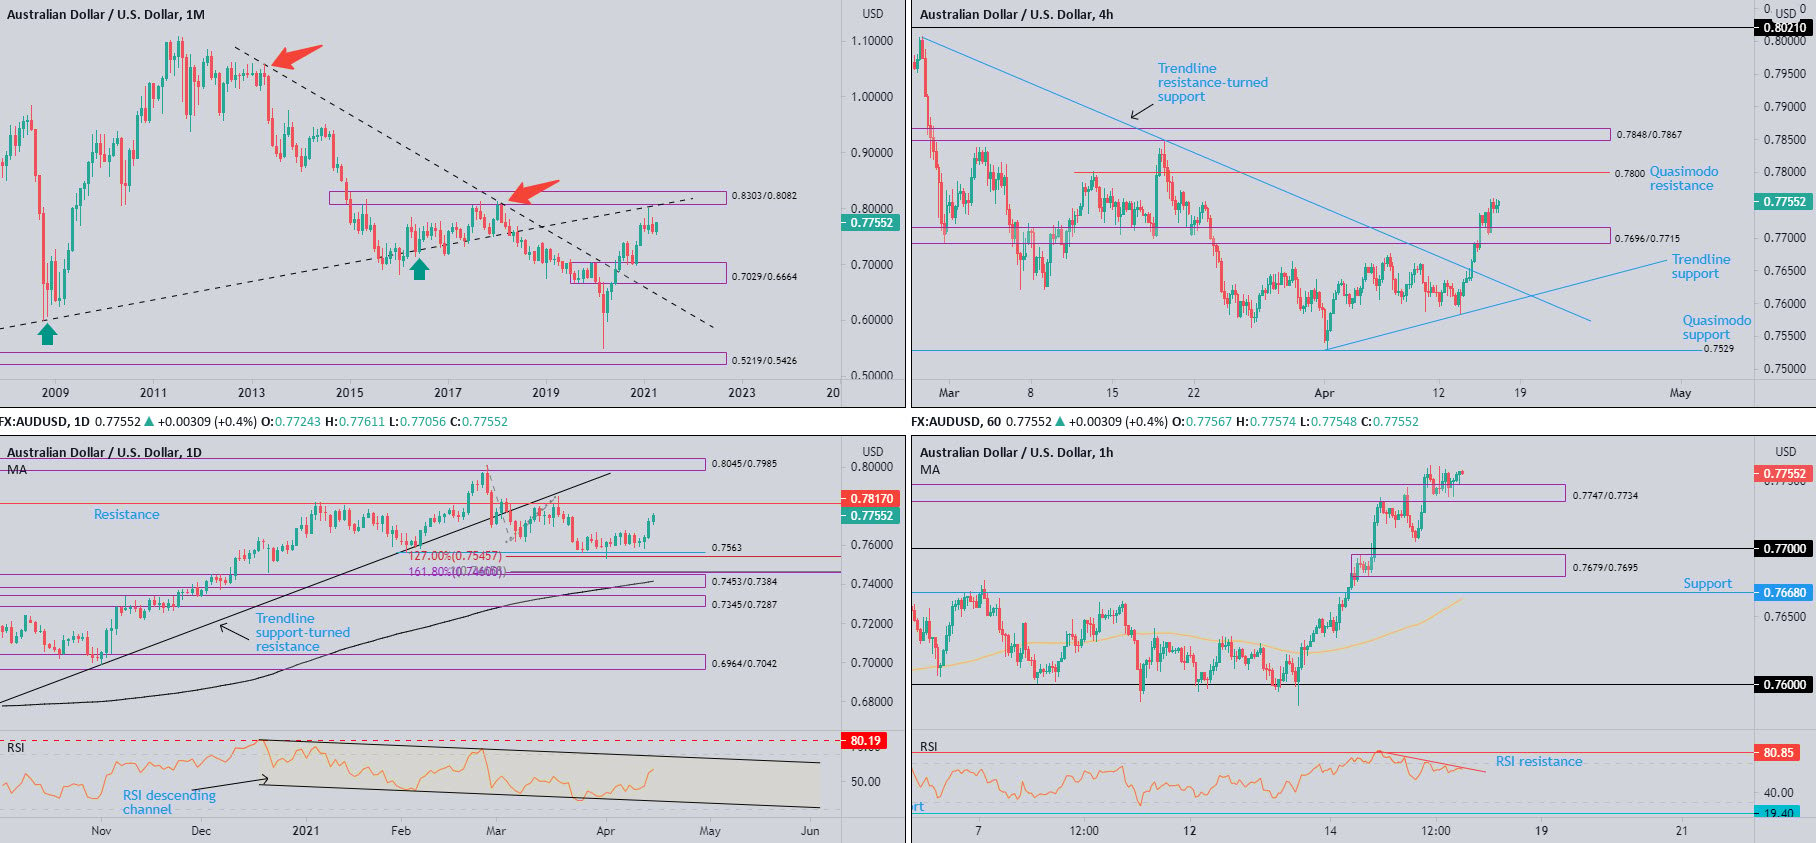
February finished considerably off best levels, establishing what many candlestick fans call a shooting star pattern—a bearish signal found at peaks. What’s interesting was February also came within striking distance of trendline resistance (prior support – 0.4776 high), sheltered under supply from 0.8303-0.8082.
March subsequently erased 1.5% over the Month and probed February’s lows. Any follow-through selling shines light on demand at 0.7029-0.6664 (prior supply).
With respect to trend (despite the trendline resistance [1.0582] breach in July 2020), the primary downtrend (since mid-2011) remains in play until breaking 0.8135 (January high [2018]).
Daily timeframe:
Partly modified from previous analysis.
Functioning as a proxy for global risk sentiment, the Australian dollar extended recovery gains against the US dollar on Thursday.
Up by 0.4 percent at the time of writing, increased interest to the upside shifts focus to resistance at 0.7817.
It’s also worth noting that since 25th March, buyers and sellers squared off around the 0.7563 February low, aided by a 1.272% Fib extension at 0.7545.
Trend studies reveal the unit has been higher since early 2020.
Momentum, as measured by the RSI oscillator, recently scaled the 50.00 centreline after discovering a floor off channel support at the end of March, taken from the low 43.70.
H4 timeframe:
The technical landscape on the H4 scale shows price retested 0.7696-0.7715 as demand yesterday and established short-term buying. Quasimodo resistance at 0.7800 deserves notice as the next potential ceiling, closely stationed by demand-turned supply from 0.7848-0.7867.
H1 timeframe:
Supply at 0.7747-0.7734, despite sparking moderate bearish flow in early trade on Thursday, stepped aside and served as demand heading into US hours. North of 0.7747-0.7734, the path appears relatively clear to 0.78.
In spite of the bullish tone, momentum, according to the RSI oscillator, is levelling off in the form of bearish divergence out of overbought territory. Note Wednesday also shook hands with resistance at 80.85.
Observed levels:
The daily timeframe displays scope to approach resistance at 0.7817, a level sharing space with Quasimodo resistance on the H4 timeframe at 0.7800 which, of course, also represents 0.78 psychological resistance on the H1.
The above, therefore, informs technicians that a short-term bullish wave may come about from H1 demand at 0.7747-0.7734 today, targeting 0.78.
USD/JPY:
Monthly timeframe:
(Technical change on this timeframe is often limited, though serves as guidance to potential longer-term moves)
Following January’s bullish engulfing candle and February’s outperformance, March concluded up by 3.9 percent and marginally cut through descending resistance, etched from the high 118.66.
April, currently down 1.8 percent, is seen retesting the breached descending resistance, movement that may eventually entice bullish flow. With respect to long-term upside targets, supply at 126.10-122.66 calls for attention.
Daily timeframe:
Largely unchanged from previous analysis.
USD/JPY shed 0.2 percent on Thursday, nearing three-week troughs in the shape of four consecutive bearish candles
Despite supply at 110.94-110.29 limiting upside since the beginning of April, the monthly timeframe testing descending resistance-turned support questions further selling. Consequently, the collection of lows around 108.36ish (green oval) could limit downside moves.
Structure beyond said lows show demand coming in at 107.58-106.85, alongside trendline support, etched from the low 102.59.
In terms of trend on the daily scale, we have been decisively higher since early 2021.
RSI action journeyed beneath support at 57.00, and recently dipped a toe under the 50.00 centreline. This implies momentum remains to the downside for the time being.
H4 timeframe:
Recent downside action pulled H4 candles into a Fib cluster between 108.44 and 108.66 (blue), glued to the upper side of demand at 108.31-108.50. Note the area also holds lows highlighted on the daily scale around 108.36.
H1 timeframe:
Early London and early US hours probed demand at 108.60-108.71 (shares a connection with the H4 Fib cluster at 108.44-108.66). To the upside, 109 calls for attention, while any bearish flow could lead to support at 108.39.
RSI movement shows the value bottoming north of oversold space, forming what technicians call bullish divergence.
Observed levels:
Monthly action testing descending resistance-turned possible support, alongside daily price testing a possible area of support around the 108.36 lows and H4 crossing swords with a Fib cluster at 108.44-108.66, could have H1 buyers attempt to make a show from demand at 108.60-108.71.

GBP/USD:
Monthly timeframe:
(Technical change on this timeframe is often limited, though serves as guidance to potential longer-term moves)
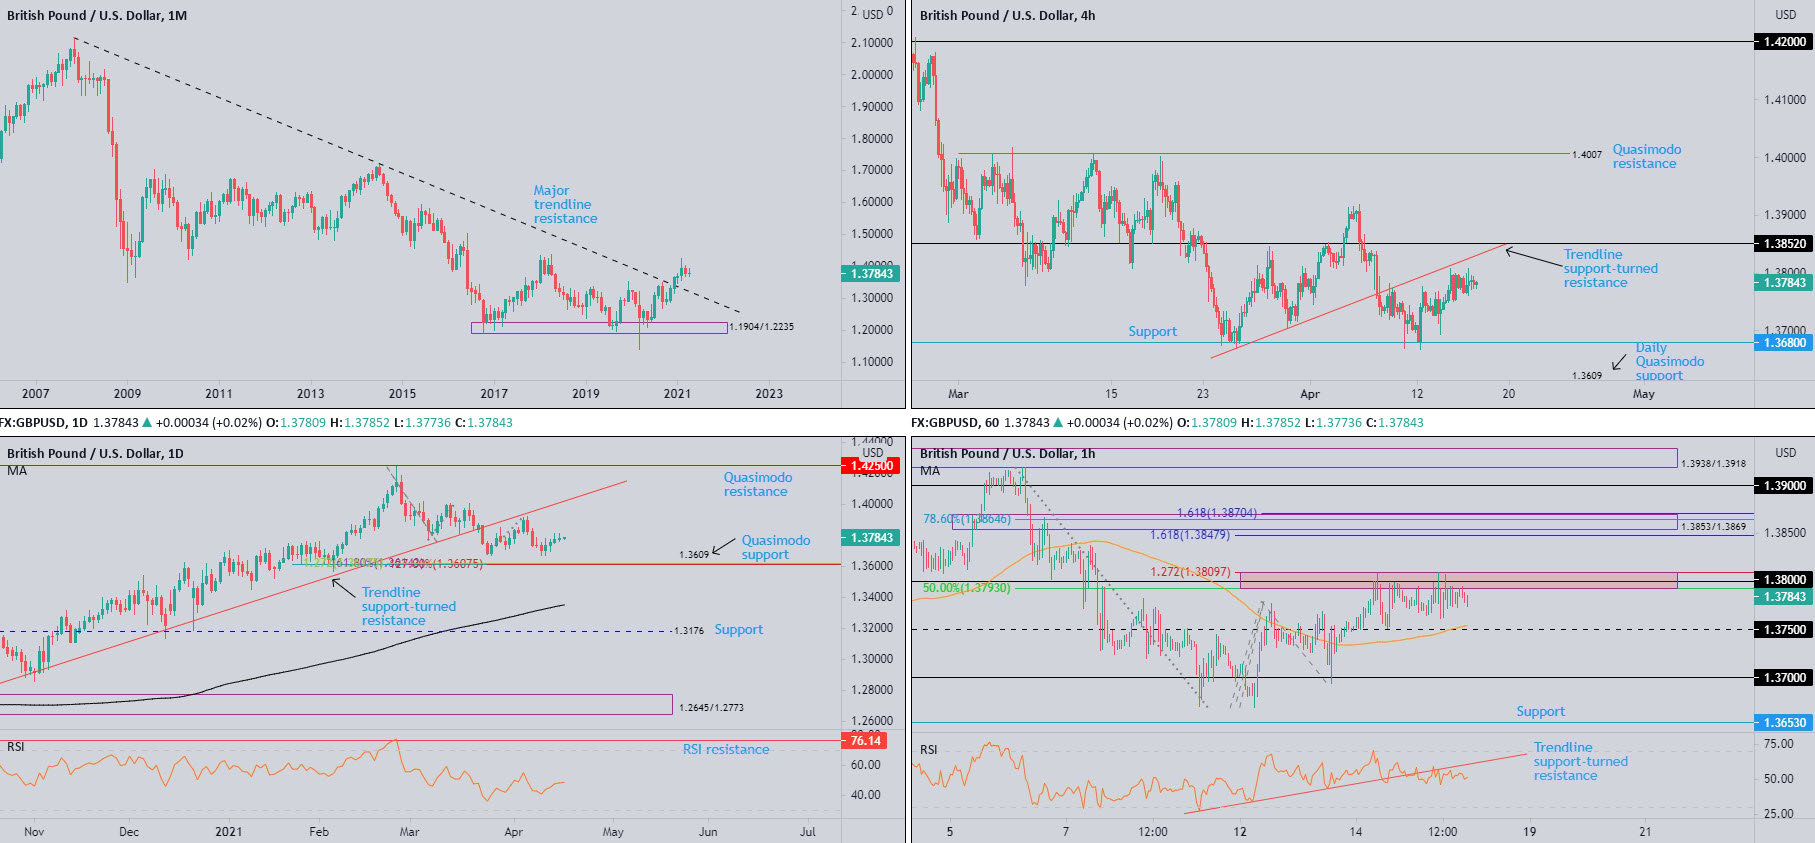
The pendulum swung in favour of buyers following December’s 2.5 percent advance, stirring major trendline resistance (2.1161).
February followed through to the upside (1.7 percent) and refreshed 2021 highs at 1.4241, levels not seen since 2018. Contained within February’s range, however, March snapped a five-month winning streak and formed what candlestick enthusiasts call an inside candle pattern (represents a short-term consolidation with low volatility). A breakout lower in subsequent months would generally be viewed as a bearish signal.
Despite the trendline breach, primary trend structure has faced lower since early 2008, unbroken (as of current price) until 1.4376 gives way (April high 2018).
Daily timeframe:
Largely unchanged from previous analysis.
GBP/USD ended another session off peaks.
The technical arrangement present on the daily chart remains unchanged. Quasimodo support at 1.3609 is seen, a level connected with a 1.272% Fib expansion at 1.3617, as well as 1.618% and 1.272% Fib extension levels at 1.3614 and 1.3607, respectively.
With reference to trend, GBP/USD has been trending higher since early 2020.
RSI movement is seen closing in on the underside of the 50.00 centreline, following 40.00 lows formed on 9th April.
H4 timeframe:
Unchanged from previous analysis.
Action out of the H4 chart remains focussed on support at 1.3680, as well as trendline support-turned resistance, taken from the low 1.3670.
Additional areas to be cognisant of are 1.3852 resistance and Quasimodo support mentioned above on the daily timeframe at 1.3609.
H1 timeframe:
Unchanged from previous analysis.
The 1.38 figure, surrounded by a 1.272% Fib expansion at 1.3809 and a 50.0% retracement level at 1.3793, continued to deliver resistance on Thursday. 1.3750 support remains in sight to the downside, sharing chart space with the 100-period simple moving average at 1.3754.
Demand-turned supply at 1.3853-1.3869, along with a number of Fib studies between 1.3870 and 1.3847, is an area worth noting higher on the curve. Below 1.3750, technical eyes will likely be drawn to 1.37.
Interestingly, the RSI nudged beneath trendline support, taken from the low 27.58, and subsequently retested the lower side of the ascending line around the 55.00ish region.
Observed levels:
With higher timeframe levels showing limited support and resistance nearby, GBP/USD traders are likely monitoring 1.3750 support on the H1, along with 1.3809-1.3793 resistance.
A H1 close above 1.3809-1.3793 may spark breakout buying, with many taking aim at H1 supply from 1.3853-1.3869. Not only does this base align with numerous Fib levels, the area also joins with H4 resistance at 1.3852.
A H1 close beneath 1.3750, on the other hand, signals a bearish scenario to 1.37.
DISCLAIMER:
The information contained in this material is intended for general advice only. It does not take into account your investment objectives, financial situation or particular needs. FP Markets has made every effort to ensure the accuracy of the information as at the date of publication. FP Markets does not give any warranty or representation as to the material. Examples included in this material are for illustrative purposes only. To the extent permitted by law, FP Markets and its employees shall not be liable for any loss or damage arising in any way (including by way of negligence) from or in connection with any information provided in or omitted from this material. Features of the FP Markets products including applicable fees and charges are outlined in the Product Disclosure Statements available from FP Markets website, www.fpmarkets.com and should be considered before deciding to deal in those products. Derivatives can be risky; losses can exceed your initial payment. FP Markets recommends that you seek independent advice. First Prudential Markets Pty Ltd trading as FP Markets ABN 16 112 600 281, Australian Financial Services License Number 286354.


 Access +10,000 financial
instruments
Access +10,000 financial
instruments