
Charts: Trading View
EUR/USD:
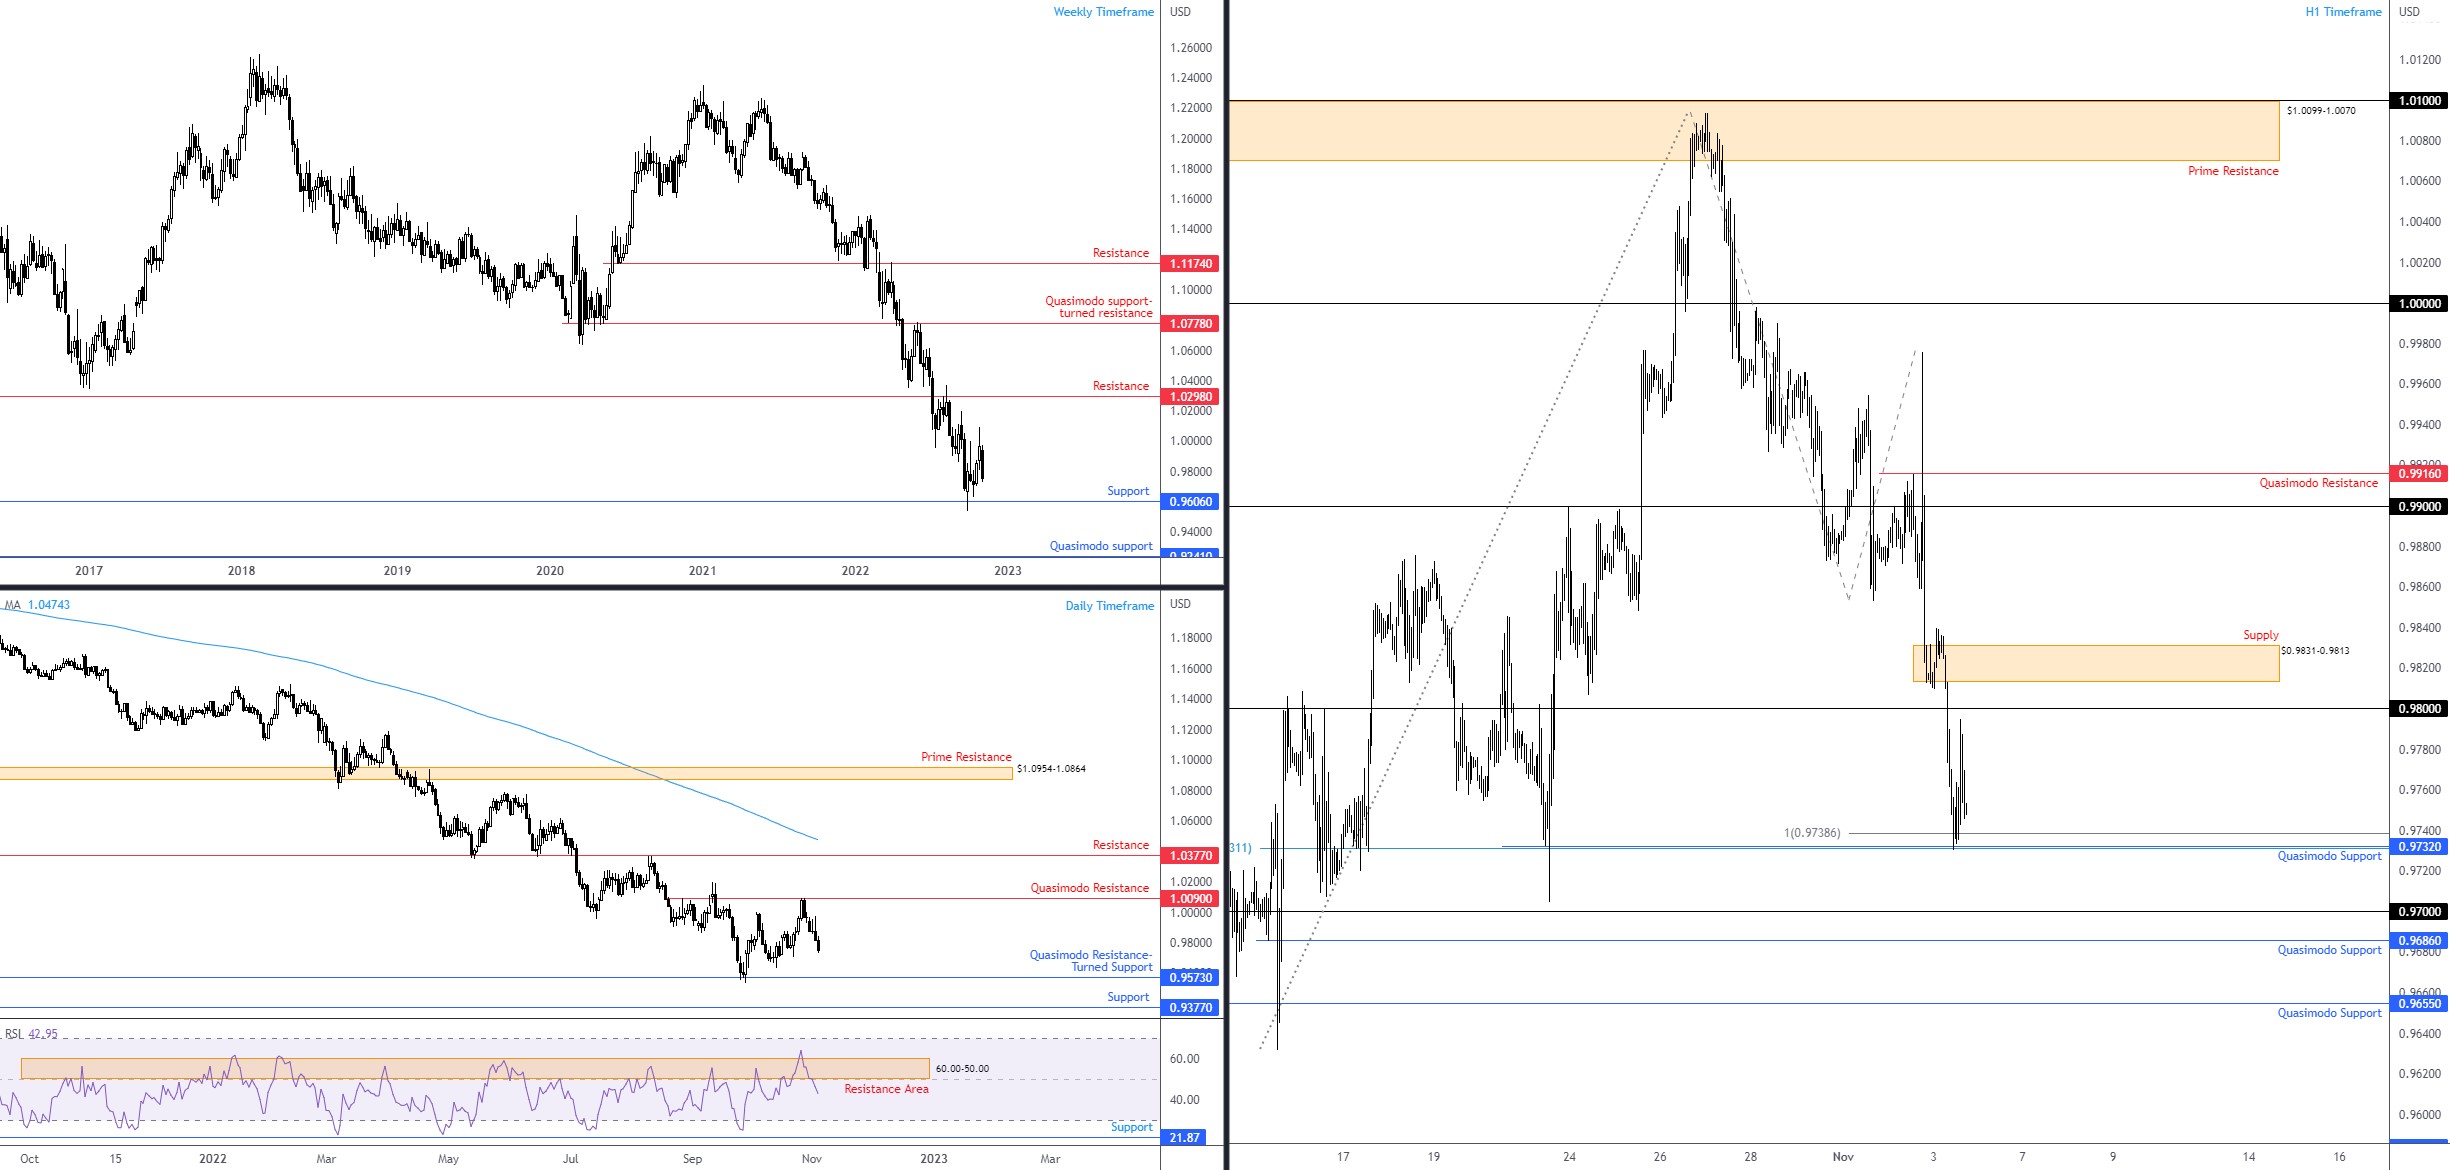
Thursday saw EUR/USD wrap up another session on the ropes, recording a fourth successive daily loss. This is unlikely to surprise technical traders who adopt basic trend and support/resistance studies across timeframes. The weekly timeframe has exhibited a dominant downside bias since 2021 and support at $0.9606, albeit welcoming buyers in late September, echoes a vulnerable tone. Weekly Quasimodo support from $0.9241 calls for attention should current support give way.
Supporting the bearish vibe is the daily timeframe recently denying the underside of Quasimodo resistance at $1.0090, aided by the relative strength index (RSI) rejecting long-term indicator resistance between 60.00 and 50.00. Familiar Quasimodo resistance-turned support consequently remains on the radar at $0.9573.
Meanwhile on the H1 timeframe, price recoiled from Quasimodo support at $0.9732, a level accompanied by a 100% projection at $0.9739 (AB=CD bullish pattern) and a 78.6% Fibonacci retracement at $0.9731. Venturing south of here throws light on $0.97 and another Quasimodo support base from $0.9686, while directly above $0.98 has supply to work with at $0.9831-0.9813. This area, assuming a retest of $0.98, communicates the possibility of a whipsaw above $0.98 unfolding.
Technical Expectation:
According to the higher timeframe, sellers remain in the driving seat. One possible bearish scenario to have on the watchlist, therefore, is a whipsaw above $0.98 into H1 supply at $0.9831-0.9813. Failure to reach that far north, a H1 close below H1 Quasimodo support at $0.9732 opens the door to short-term breakout selling opportunities to at least $0.97.
 AUD/USD:
Amid USD demand, the Australian dollar suffered further losses on Thursday, shedding 0.8%.
Short-term price action tunnelled through $0.63 and touched a low of $0.6272 before returning to retest the underside of the aforementioned round number as well as a neighbouring Quasimodo support-turned resistance at $0.6313 and channel support-turned resistance, taken from the low $0.6369. In light of this and scope to approach H1 Quasimodo support at $0.6229, sellers could continue to control things today.
The bearish tone is supported on the bigger picture. Like the EUR/USD, the AUD/USD has demonstrated a clear downtrend since early 2021 and weekly demand from $0.5975-0.6166 appears vulnerable (houses a 1.618% Fibonacci projection ratio at $0.6024 [an ‘alternate’ AB=CD pattern]). From the daily timeframe, downside appears free until support at $0.6212, sitting just south of the H1 Quasimodo formation mentioned above at $0.6229.
Technical Expectation:
Considering the weekly and daily timeframes, sellers on the H1 may continue to hold the underside of $0.6313/0.6300, targeting H1 Quasimodo support from $0.6229.
 USD/JPY:
USD/JPY has been quiet these past few days.
Given the lacklustre performance, here is where I left the weekly and daily charts in previous analysis (italics):
Weekly price scraped the lower side of Quasimodo resistance at ¥151.90 almost to the pip during October and formed a weighty upper candle shadow. While scope to record additional losses is seen to as far south as support from ¥137.23, action has been somewhat subdued since the test of the Quasimodo resistance noted above. This could have something to do with the trend, which has been higher since 2021.
Out of the daily timeframe, last week witnessed a rebound just shy of a Quasimodo resistance-turned support from ¥144.95 (just south of here we can see another Quasimodo support set at ¥141.60). Interestingly, though, the daily chart’s relative strength index (RSI) double-top at 79.94 was recently dragged into the fight. The pattern’s neckline can be seen at 56.73 (blue line) which was engulfed to confirm the pattern’s validity in late October. If the indicator crosses under 50.00, this will help further confirm the pattern’s existence and potentially see follow-through downside to oversold territory.
¥147.79-147.88 prime support is in sight on the H1 scale, an area, albeit small in range, that offers a possible platform to facilitate a whipsaw south of ¥148. Should price voyage below the said prime support, dropping back to ¥147 is on the table.
Technical Expectation:
In line with the longer-term uptrend, a test of the H1 prime support at ¥147.79-147.88 may call in short-term buyers to attempt to reach ¥149.
 GBP/USD:
A clear laggard on the day, the pound dropped nearly 2.0% against the US dollar on Thursday amid warnings from the Bank of England (BoE) of a prolonged recession. Chalking up its largest one-day loss since late September, the GBP/USD currency pair is on course for further pain, according to the weekly scale as price rejects a decision point at $1.1751-1.1413, in a market demonstrating an unmistakable downtrend since forming a double-top pattern between February and May of 2021. Furthermore, the daily chart’s relative strength index (RSI) resistance between 60.00 and 50.00 has, once again, stood ground, with the indicator now cementing position under the 50.00 centreline (negative momentum). Price movement on the daily (and weekly) timeframe is also void of any meaningful support until the (Feb) 1985 low at $1.0520.
Processing short-term flow on the H1 chart, limited support is evident until around the $1.11 after the pair recently cleared support from $1.1270 (now resistance) and bids from $1.12.
Technical Expectation:
Keeping things simple, all three timeframes suggest further underperformance in this market in the direction of $1.11. Therefore, short-term sellers are likely to be short from the retest at the underside of $1.12, with additional bearish interest likely to drill down to lower timeframes to pursue shorting opportunities.
 DISCLAIMER:
The information contained in this material is intended for general advice only. It does not take into account your investment objectives, financial situation or particular needs. FP Markets has made every effort to ensure the accuracy of the information as at the date of publication. FP Markets does not give any warranty or representation as to the material. Examples included in this material are for illustrative purposes only. To the extent permitted by law, FP Markets and its employees shall not be liable for any loss or damage arising in any way (including by way of negligence) from or in connection with any information provided in or omitted from this material. Features of the FP Markets products including applicable fees and charges are outlined in the Product Disclosure Statements available from FP Markets website, www.fpmarkets.com and should be considered before deciding to deal in those products. Derivatives can be risky; losses can exceed your initial payment. FP Markets recommends that you seek independent advice. First Prudential Markets Pty Ltd trading as FP Markets ABN 16 112 600 281, Australian Financial Services License Number 286354.


 Access +10,000 financial
instruments
Access +10,000 financial
instruments