
Charts: Trading View
(Italics: Previous Analysis)
EUR/USD:
It was a subdued session for EUR/USD—as well as other major currency pairs—on Wednesday as investors brace for the beginning of the Jackson Hole Symposium, held for three days. We also look forward to the US Q2 GDP print today, although it is expected to remain unchanged at -0.9 per cent.
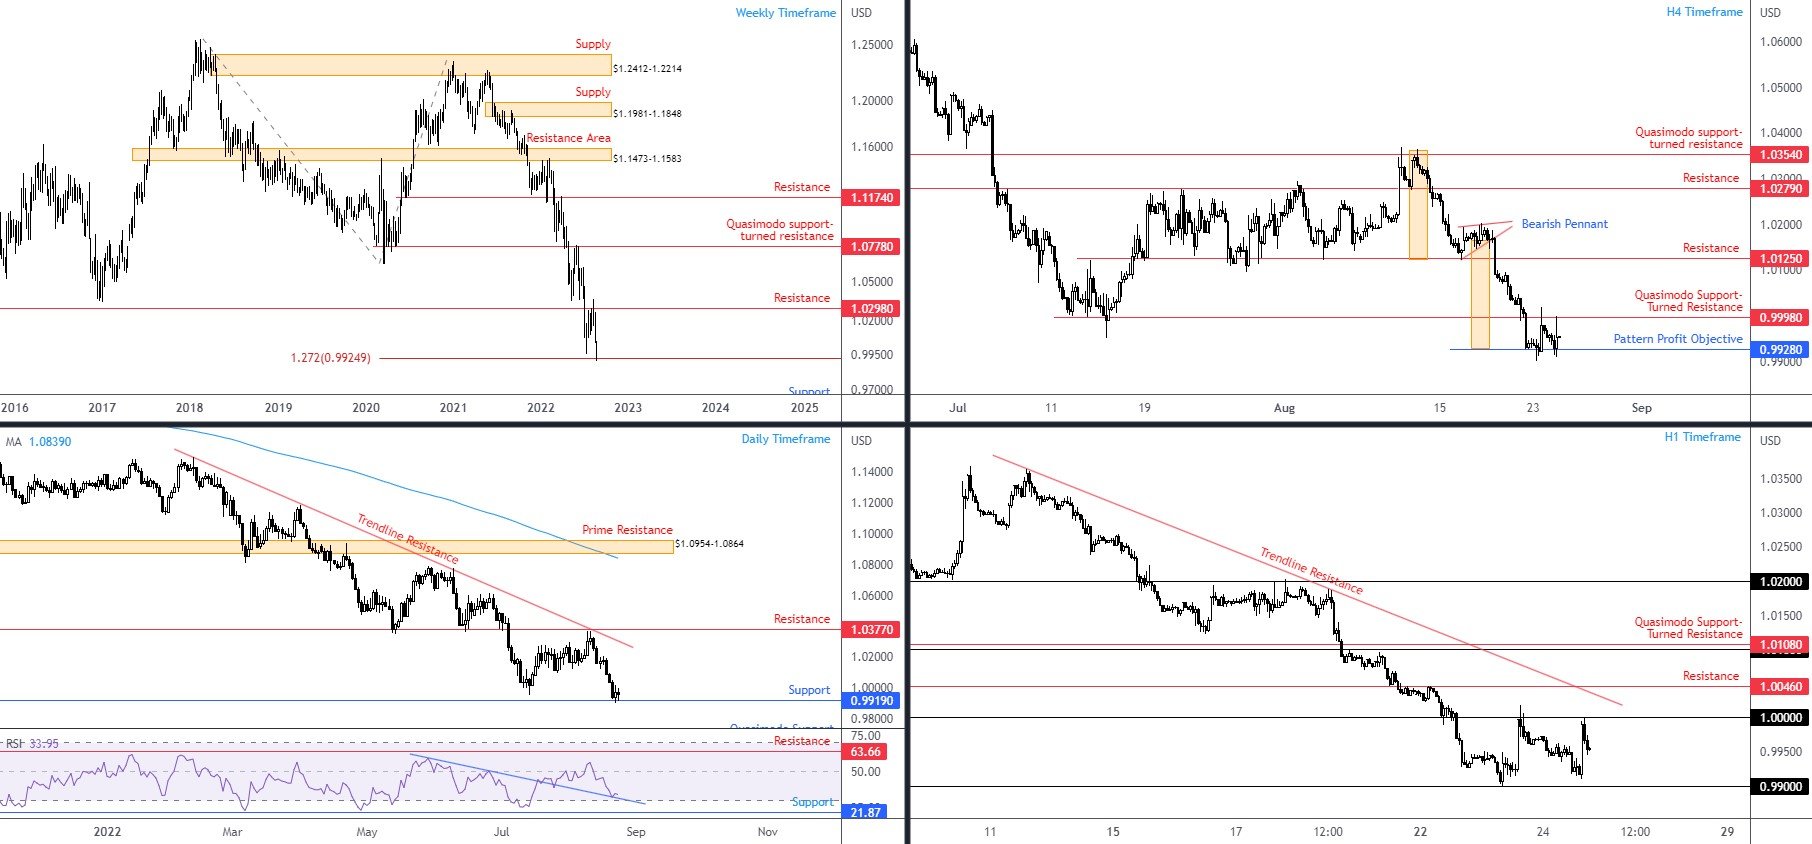
The technical environment on the bigger picture remains toying with support: weekly support in the shape of a 1.272% Fibonacci projection at $0.9925 (alternate AB=CD bullish formation), a daily support coming in from $0.9919, and the daily chart’s relative strength index (RSI) shaking hands with indicator trendline resistance-turned-support (drawn from the high 58.91), situated just ahead of oversold territory.
While the noted supports offer technical confluence, direction in this market continues to favour sellers. The currency pair has chalked up a dominant primary bear trend since pencilling in a top around $1.2350 in early 2021. Secondary trends, as you can see, have been short-lived, though provided willing sellers ample opportunity to get involved. If the weekly timeframe steps under $0.9925, limited (obvious) support is not visible until $0.9606, while the daily timeframe’s downside support target rests at $0.9668 (Quasimodo support).
Meanwhile on the H4 timeframe, buyers and sellers are seen battling for position between H4 Quasimodo support-turned resistance at $0.9998 and the bearish pennant pattern’s profit objective drawn at $0.9928. Drilling lower to the H1 timeframe, however, price has discovered willing sellers at the lower side of parity ($1.00), with $0.99 still calling for attention as support, and H1 resistance seen above at $1.0046. This is the lowest the euro has been against the US dollar since 2002, and now the euro is WORTH LESS than the US dollar.
Technical Expectation:
I noted the following in Wednesday’s technical briefing, and given the lacklustre performance on Wednesday, the analysis remains valid heading into Thursday’ sessions (italics):
It’s an interesting situation for the EUR/USD currently. On the one hand, the currency pair has been entrenched within a dominantly bearish downtrend since the beginning of 2021, yet on the other hand, support emerged from weekly, daily and H4 timeframes and, for now, has offered a floor to work with.
I feel attention, therefore, will be directed to $1.00 on the H1 scale. As highlighted above, price on the H1 chart is retesting the underside of the noted psychological figure. Sellers defending this number places a question mark on the higher timeframe supports and essentially trades in line with the overall downtrend (and could be viewed as a bearish cue back to $0.99). A break above $1.00, nonetheless, signals bullish strength and reinforces current support structure, opening the door to short-term breakout buying opportunities towards H1 resistance at $1.0046.
 AUD/USD:
The Australian dollar eked out modest losses against the buck on Wednesday, yet doing little in the way of damage to higher timeframe technical structure.
The daily timeframe’s support at $0.6901 continues to welcome price movement as buyers and sellers square off for position.
I noted the following in Wednesday’s report regarding the daily and weekly structure (italics):
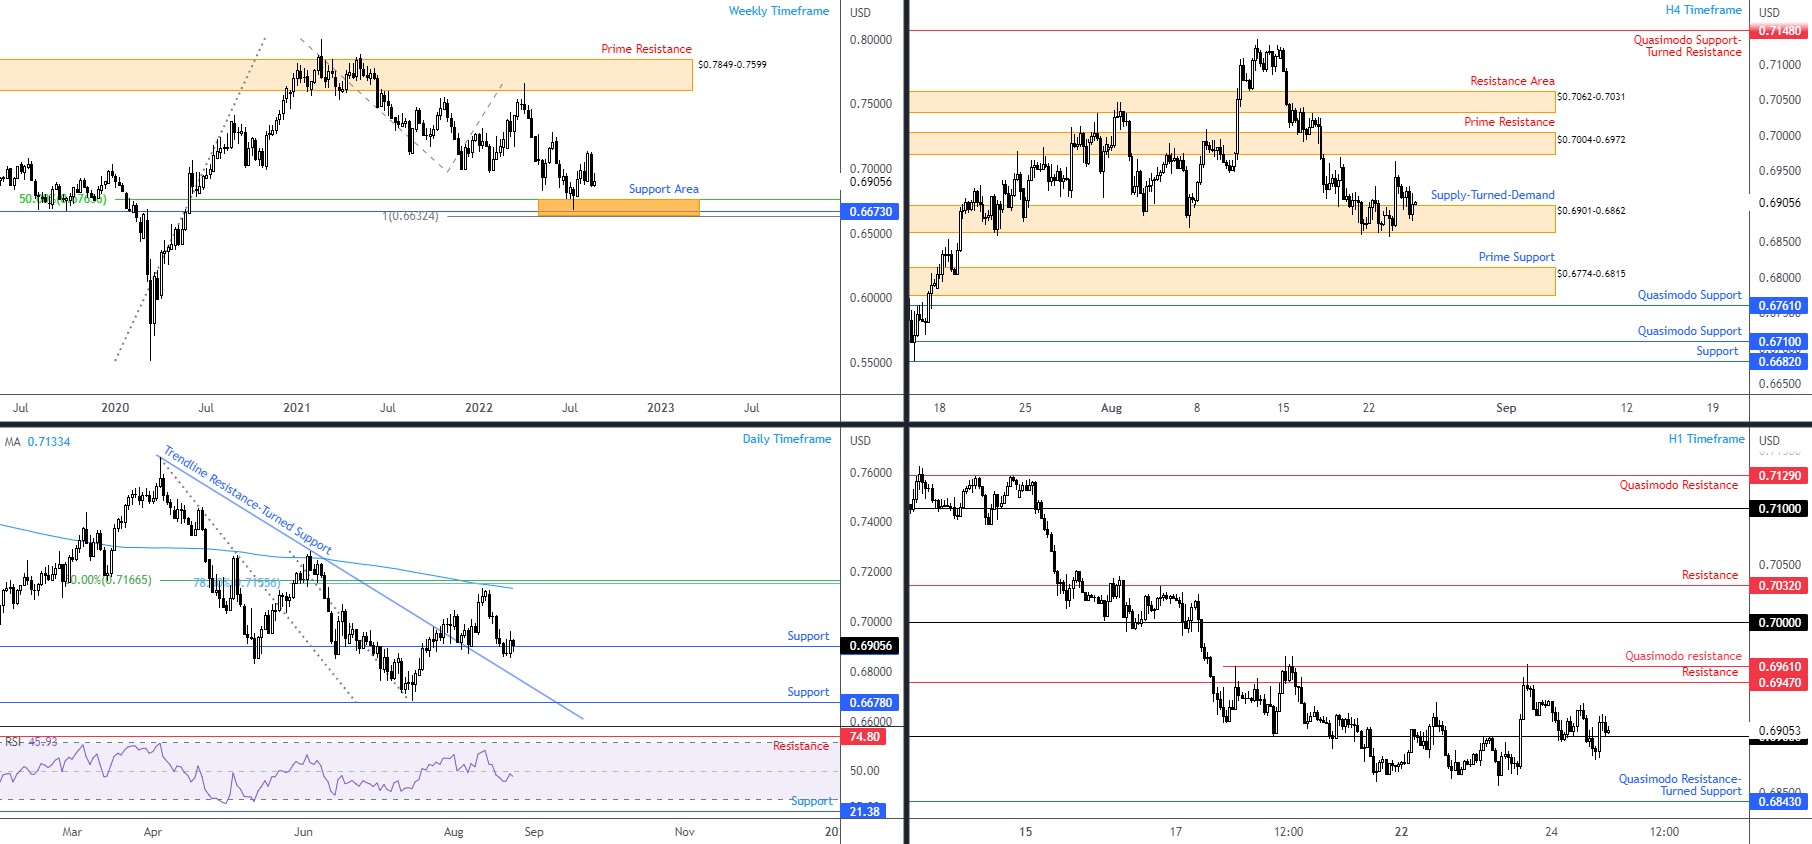
Buyers gaining ground here shines the technical spotlight on the 200-day simple moving average, currently circling $0.7133 (accompanied by a 50.0% retracement value at $0.7167 and a 78.6% Fibonacci retracement at $0.7156). Assuming buyers lack fuel above $0.6901, this swings the pendulum in favour of reaching trendline resistance-turned support, drawn from the high $0.7661, as well as support at $0.6678. Interestingly, the daily chart’s relative strength index (RSI) is testing space just under the 50.00 centreline (resistance). Until we breach this value, this timeframe (according to the indicator) reflects negative momentum.
The weekly timeframe’s support likely remains on the radar for longer-term players between $0.6632 and $0.6763, built from a 100% Fibonacci projection, horizontal price support, and a 50% retracement. This follow’s last week’s 3.5 per cent tumble, in a market that’s been entrenched within a primary bear trend since $0.8007 (22nd Feb high [2021]).
Leaving prime resistance at $0.7004-0.6972 unchallenged on the H4 chart, supply-turned demand at $0.6901-0.6862 is under pressure once again. Overthrowing the aforementioned demand zone unearths prime support from $0.6774-0.6815. From the H1 timeframe, price reclaimed $0.69+ territory during the early hours of US trading on Wednesday; resistance is seen between Quasimodo resistance at $0.6961 and resistance from $0.6947. Assuming a lack of grip above $0.69, dropping to Quasimodo resistance-turned support at $0.6843 could unfold.
Technical Expectation:
With the overall trend facing southbound (in spite of daily price climbing above resistance at $0.6901) and the H4 supply-turned demand at $0.6901-0.6862 echoing weakness (the recent rebound from here failed to reach H4 prime resistance at $0.7004-0.6972), this places a bold question mark on buyers holding ground north of $0.69 on the H1 timeframe.
As a result, a close back under $0.69 could be viewed as a cue to begin seeking bearish scenarios.
 USD/JPY:
A mild bout of dip-buying materialised on Wednesday amid rising US Treasury yields—benchmark 10-year yield cemented position above 3.0 per cent following a low of 2.516 per cent in early August.
Volatility has clearly hit the decline button as traders await the beginning of Jackson Hole. Consequently, analysis drawn from the weekly and daily timeframes echo a similar tone as Wednesday’s report (italics):
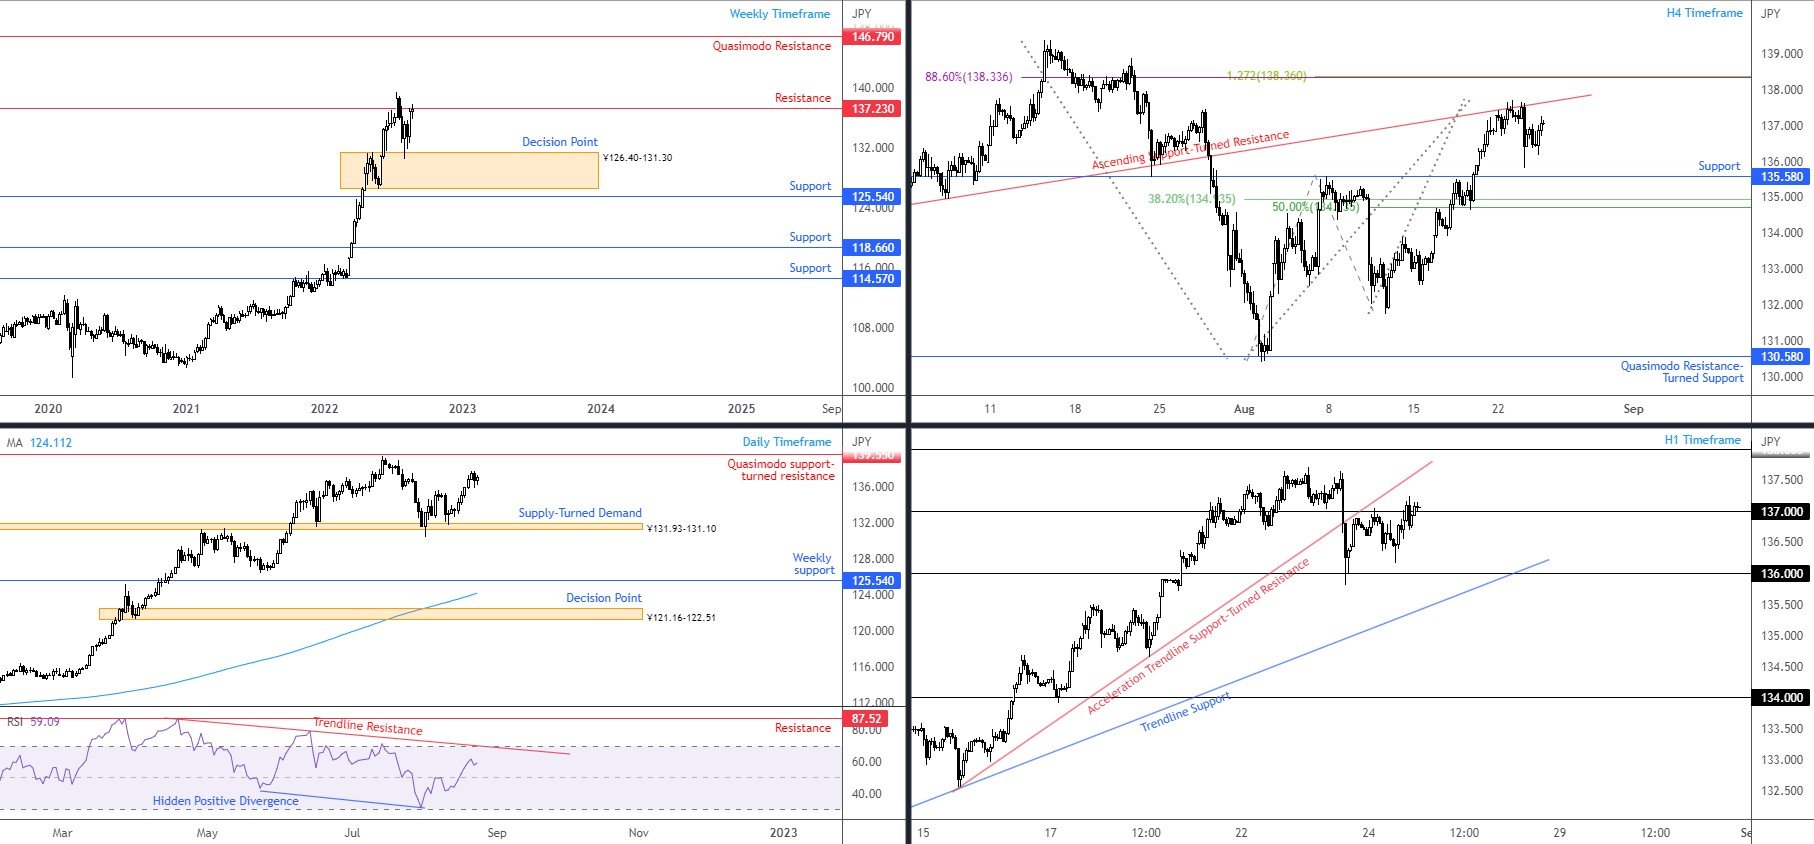
From the weekly timeframe, resistance remains a key talking point at ¥137.23, in a market that’s emphasised a dominant primary bull trend since 2021. The weekly decision point from ¥126.40-131.30 is also a worthwhile note in the event sellers make a show on this timeframe.
Technical studies on the daily chart has price chalking up a range after an earlier defence formed from supply-turned demand at ¥131.93-131.10. Quasimodo support-turned resistance at ¥139.55 serves as the next upside target. I also noted the following in Monday’s weekly technical briefing in terms of the relative strength index (RSI) (italics):
The daily timeframe’s relative strength index (RSI) ventured above its 50.00 centreline after coming within an inch of testing oversold space and forming hidden positive divergence at the beginning of August. Dethroning the 50.00 base adds weight to last week’s push, informing market participants that average gains are exceeding average losses (positive momentum). Upside targets are seen at the indicator trendline resistance, etched from the high 87.44, and indicator resistance at 87.52.
H4 ascending support-turned resistance, taken from the low ¥134.27, is likely still on the radar for many traders after price failed to connect with neighbouring support at ¥135.58, closely shadowed by a 38.2% Fibonacci retracement at ¥134.94 and a 50.0% retracement value from ¥134.72.
The H1 timeframe deserves notice; price is seen attempting to find some acceptance above ¥137 after forging a low just ahead of ¥136 (in the shape of a hammer candle pattern). Is ¥138 on the table now?
Technical Expectation:
Weekly resistance at ¥137.23 and the H4 ascending support-turned resistance should be noted. However, whether the aforesaid levels are sufficient to hold back buyers is difficult to estimate. We are not only dealing with a dominant uptrend (the rebound from the weekly decision point was clearly a location buyers entered into a dip-buying phase), the daily timeframe also demonstrates scope to push for ¥139.55 and the H1 is threatening to hold ¥137 as support.
Are we looking at a run higher from ¥137 to ¥138 is the question.
 GBP/USD:
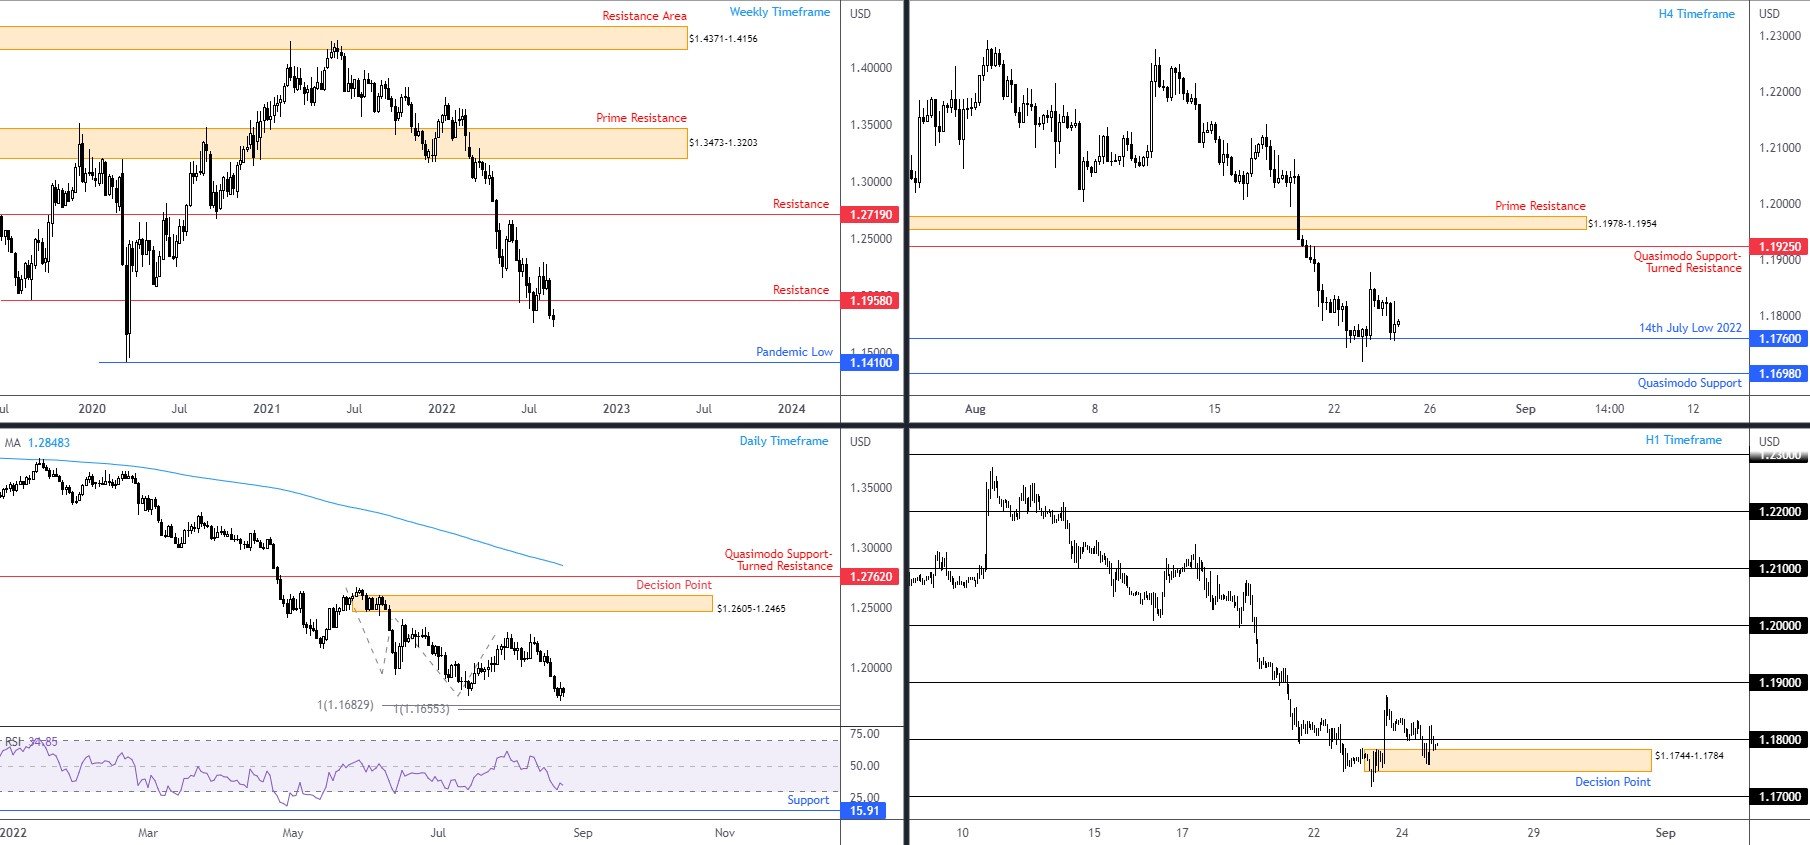
It was a sluggish session for sterling on Wednesday, gently grinding lower against its US counterpart and reclaiming a portion of Tuesday’s upside. Limited change is evident on the bigger picture, as you would imagine, though the H4 timeframe is retesting the spirit of support in the form of 14th July low at $1.1760. The H1 timeframe is also currently working with a decision point at $1.1744-1.1784 after manoeuvring (whipsawing) beneath $1.18. As of writing, however, buyers are unwilling to commit and hold things above $1.18.
The higher timeframe picture, taken from recent writing (italics):
GBP/USD put in a bottom just ahead of daily support between $1.1655 and $1.1683 (two 100% Fibonacci projection ratios). In terms of the daily chart’s relative strength index (RSI), we can see that the indicator has marginally bottomed ahead of oversold.
$1.1958 remains a key resistance level to be mindful of on the weekly timeframe, following last week’s dominant push lower. This is not a surprise as GBP/USD has chalked up an unmistakable primary bear trend since early 2021. And, as I wrote in recent analysis, the breach of $1.1958 reopens the risk of a return to the pandemic low of $1.1410.
Technical Expectation:
Longer term, GBP/USD remains bearish until at least the daily timeframe’s 100% Fibonacci projection levels at $1.1683 and $1.1655.
Short term, assuming H1 price maintains position south of $1.18, could see the currency pair take aim at $1.17, in line with the bigger picture’s direction. However, this would involve engulfing $1.1760 on the H4.
 DISCLAIMER:
The information contained in this material is intended for general advice only. It does not take into account your investment objectives, financial situation or particular needs. FP Markets has made every effort to ensure the accuracy of the information as at the date of publication. FP Markets does not give any warranty or representation as to the material. Examples included in this material are for illustrative purposes only. To the extent permitted by law, FP Markets and its employees shall not be liable for any loss or damage arising in any way (including by way of negligence) from or in connection with any information provided in or omitted from this material. Features of the FP Markets products including applicable fees and charges are outlined in the Product Disclosure Statements available from FP Markets website, www.fpmarkets.com and should be considered before deciding to deal in those products. Derivatives can be risky; losses can exceed your initial payment. FP Markets recommends that you seek independent advice. First Prudential Markets Pty Ltd trading as FP Markets ABN 16 112 600 281, Australian Financial Services License Number 286354.


 Access +10,000 financial
instruments
Access +10,000 financial
instruments