
Charts: TradingView
EUR/USD
Subdued trading conditions were evident for the EUR/USD on Wednesday as buyers and sellers squared off around the upper portion of Tuesday’s range.
Through the lens of a technical analyst, charts studies continue to imply sellers will likely remain in the driving seat until around the $1.06ish region. My rationale out of the bigger picture was defined in the recent Weekly Briefing (italics):
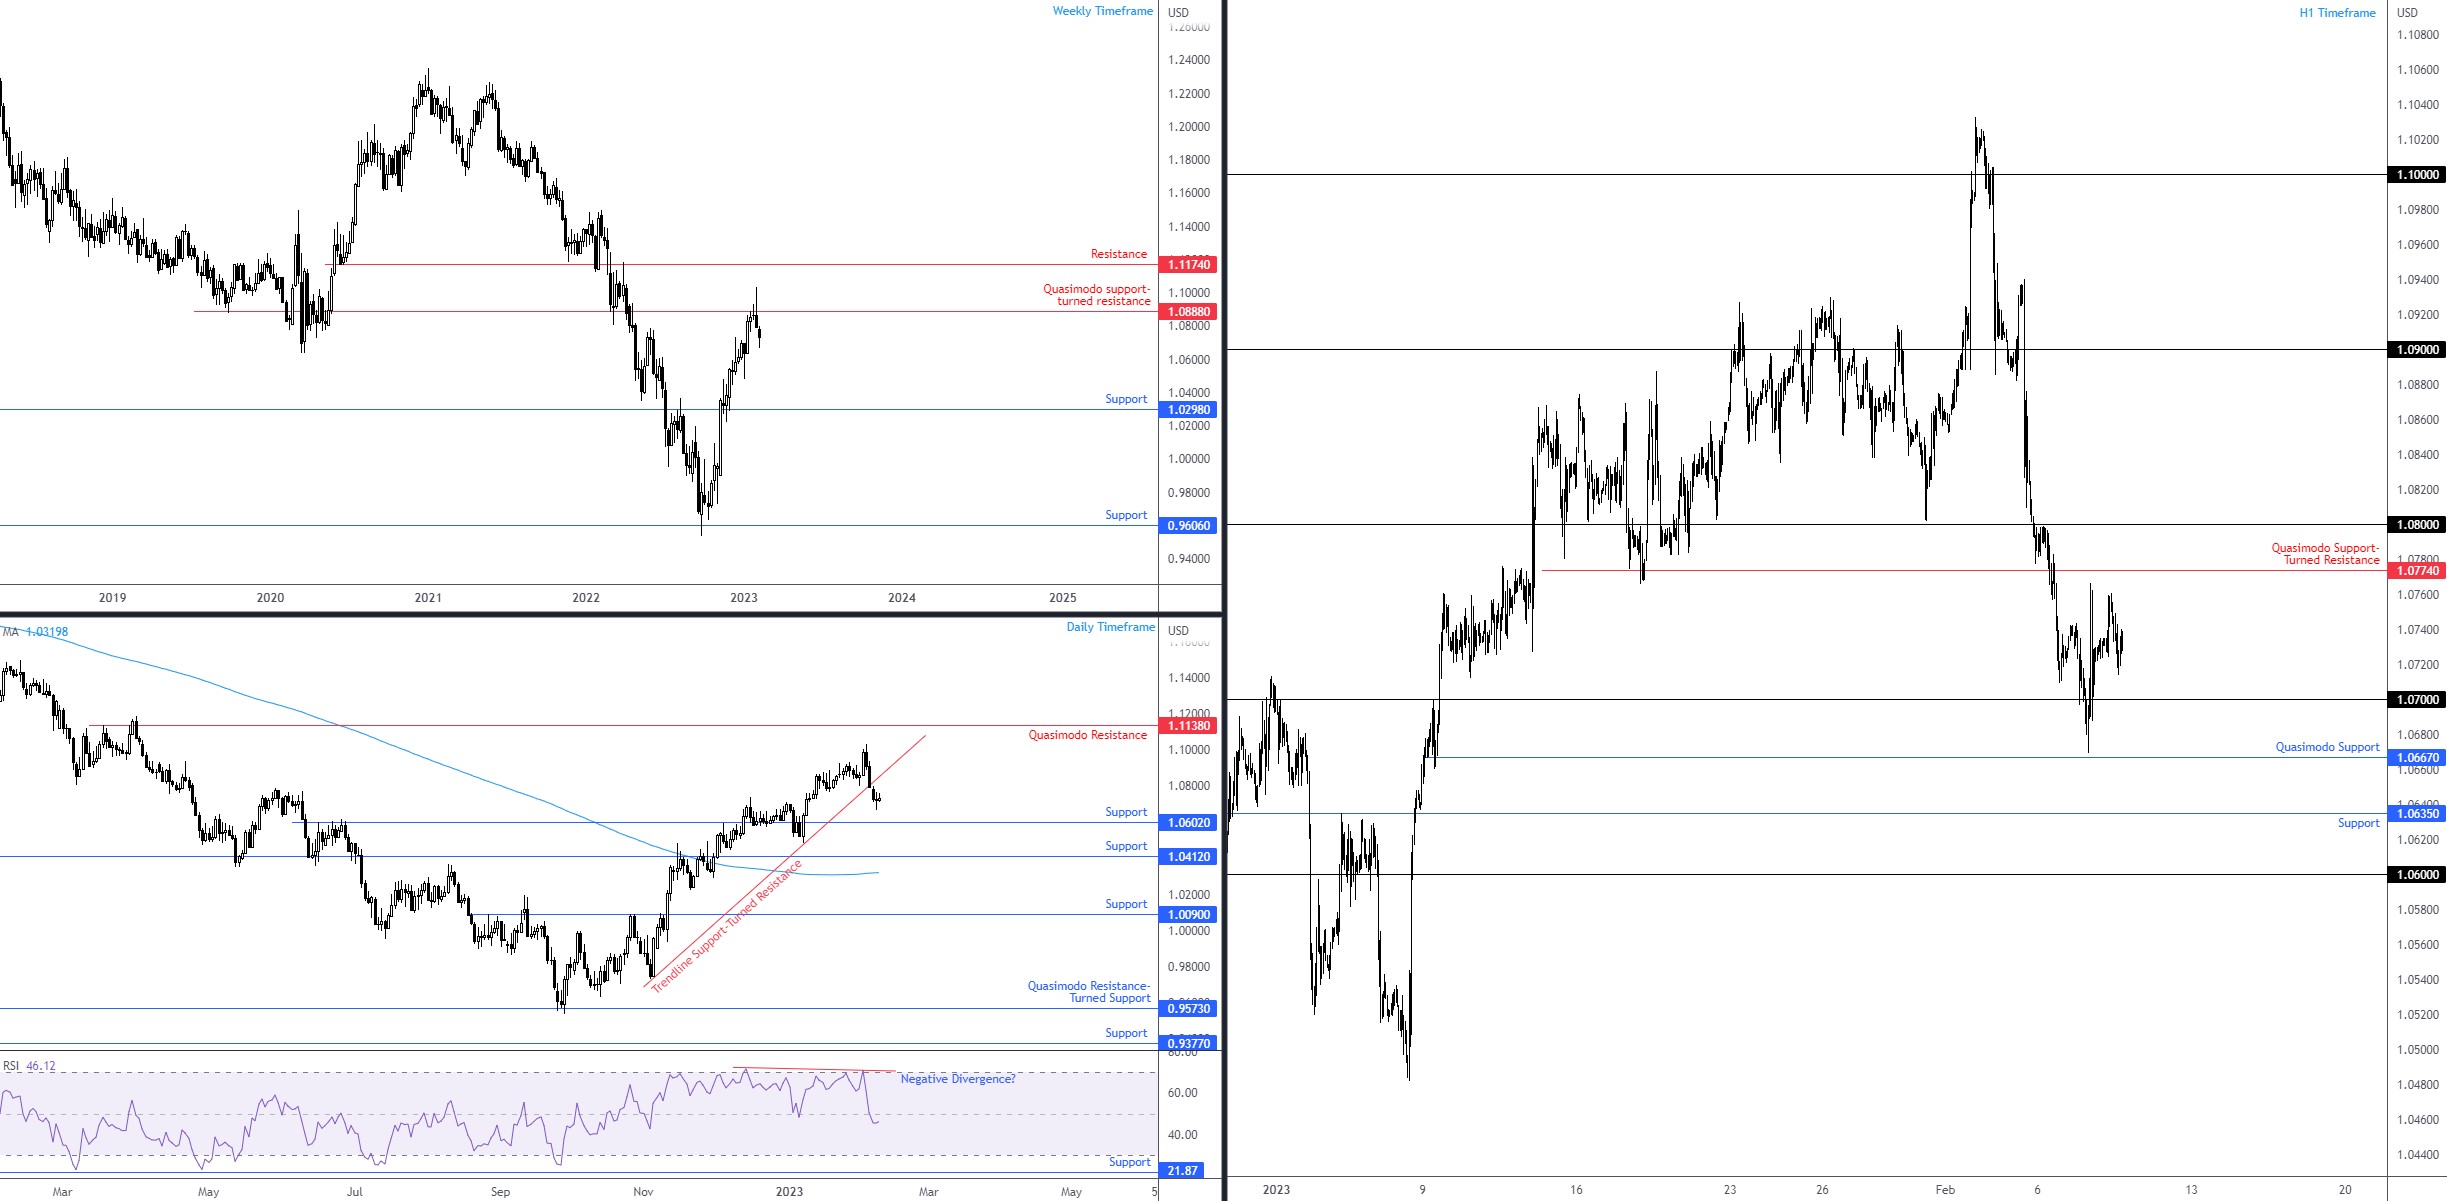
The weekly timeframe recently joined hands with Quasimodo support-turned resistance at $1.0888 and chalked up what is referred to as a shooting star. This bearish combination, together with the prospect of investors welcoming a sell-on-rally scenario based on the pullback from the late September lows at $0.9536, proposes a robust technical headwind for buyers to compete with. Adding to the weekly chart’s bearish representation, price action on the daily timeframe voyaged through trendline support, extended from the low $0.9730. Rupturing the aforementioned line, along with the daily chart’s Relative Strength Index (RSI) elbowing through its 50.00 centreline (negative momentum), unmasks daily support coming in at $1.0602. As a note, while the daily timeframe has emphasised an uptrend (series of higher highs/lows since $0.9536), current (daily) price forging a lower high followed by a fresh lower low will undoubtedly question this uptrend and begin the development of an early downtrend.
Consequently, $1.0602 continues to warrant attention on the daily scale, meaning short-term players on the H1 chart may eventually navigate beneath $1.07 to take on Quasimodo support from $1.0667 and H1 support at $1.0635 which would unlock the door to the $1.06 figure: the downside objective on the daily timeframe. This, for that reason, poses two possible scenarios going forward: H1 Quasimodo support-turned resistance at $1.0774 offers a ceiling for sellers to work with to push lower, or failure to reach the aforementioned resistance could spark a breakout scenario beneath $1.07 towards H1 supports mentioned above at $1.0667 and $1.0635.
 S&P 500
Major US equity indices were on the ropes during the US morning session, with the S&P 500 trading as low as 1.0%.
The technical picture for the monthly, weekly and daily timeframes, however, remains interesting and largely supportive of further outperformance. The following is a reminder of where I left the bigger picture in recent analysis, albeit slightly modified to reflect current price movement (italics):
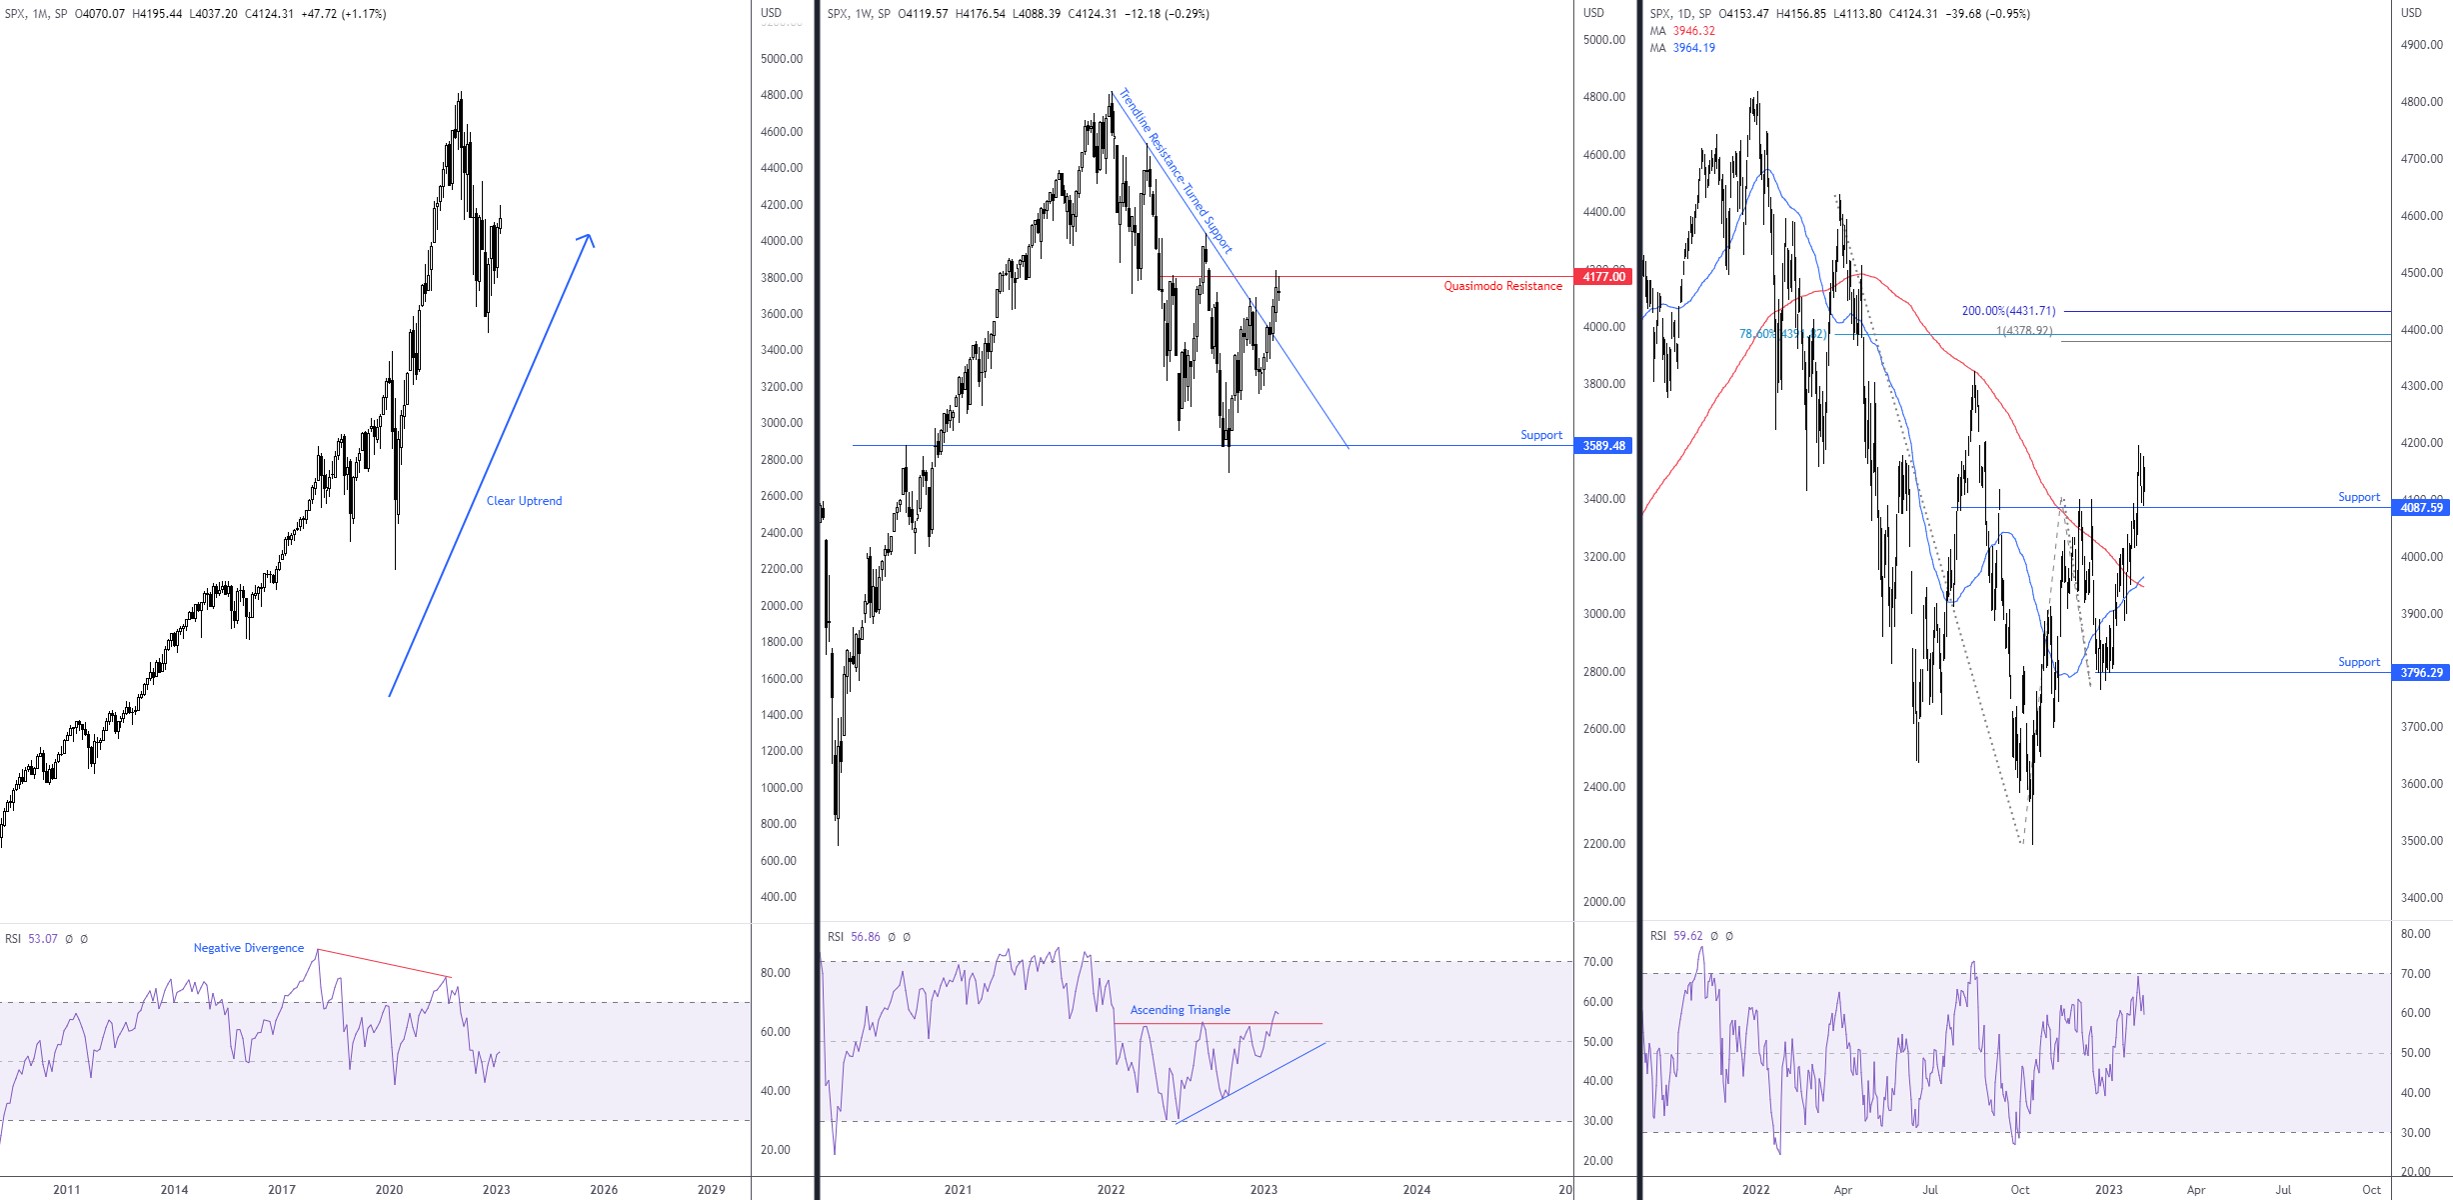
The monthly chart has remained in a dominant uptrend since early 2009. We had two notable corrections in that time, one in early 2020 (COVID), dropping 35%, and one in play since early 2022 (27% from 4,818, as of writing) which was accompanied by negative divergence out of the Relative Strength Index (RSI).
The weekly chart connected with Quasimodo resistance at 4,177, closely shadowed by the 4,325 15 August high (2022). Should sellers take hold, a retest of the recently breached trendline resistance (taken from the high at 4,818) could unfold and offer support. However, backing further buying on this timeframe, the Relative Strength Index (RSI) ventured above the upper boundary of an ascending triangle between 53.72 and 30.47. This emphasises positive momentum until reaching the overbought threshold (70.00). While these triangles are generally found in uptrends, they can also forge reversal signals.
Out of the daily timeframe, 4,087 support had its upper space tested this week, a level that delivered strong resistance between September 2022 and January 2023. Given we are still holding ground north of the support, and a Golden Cross presented itself: the 50-day simple moving average (3,964) crossing above the 200-day simple moving average (3,946), price recoiling from its current location and running for the 4,325 15 August high mentioned on the weekly scale could materialise, closely followed by a daily 100% projection (AB=CD harmonic resistance) at 4,378.
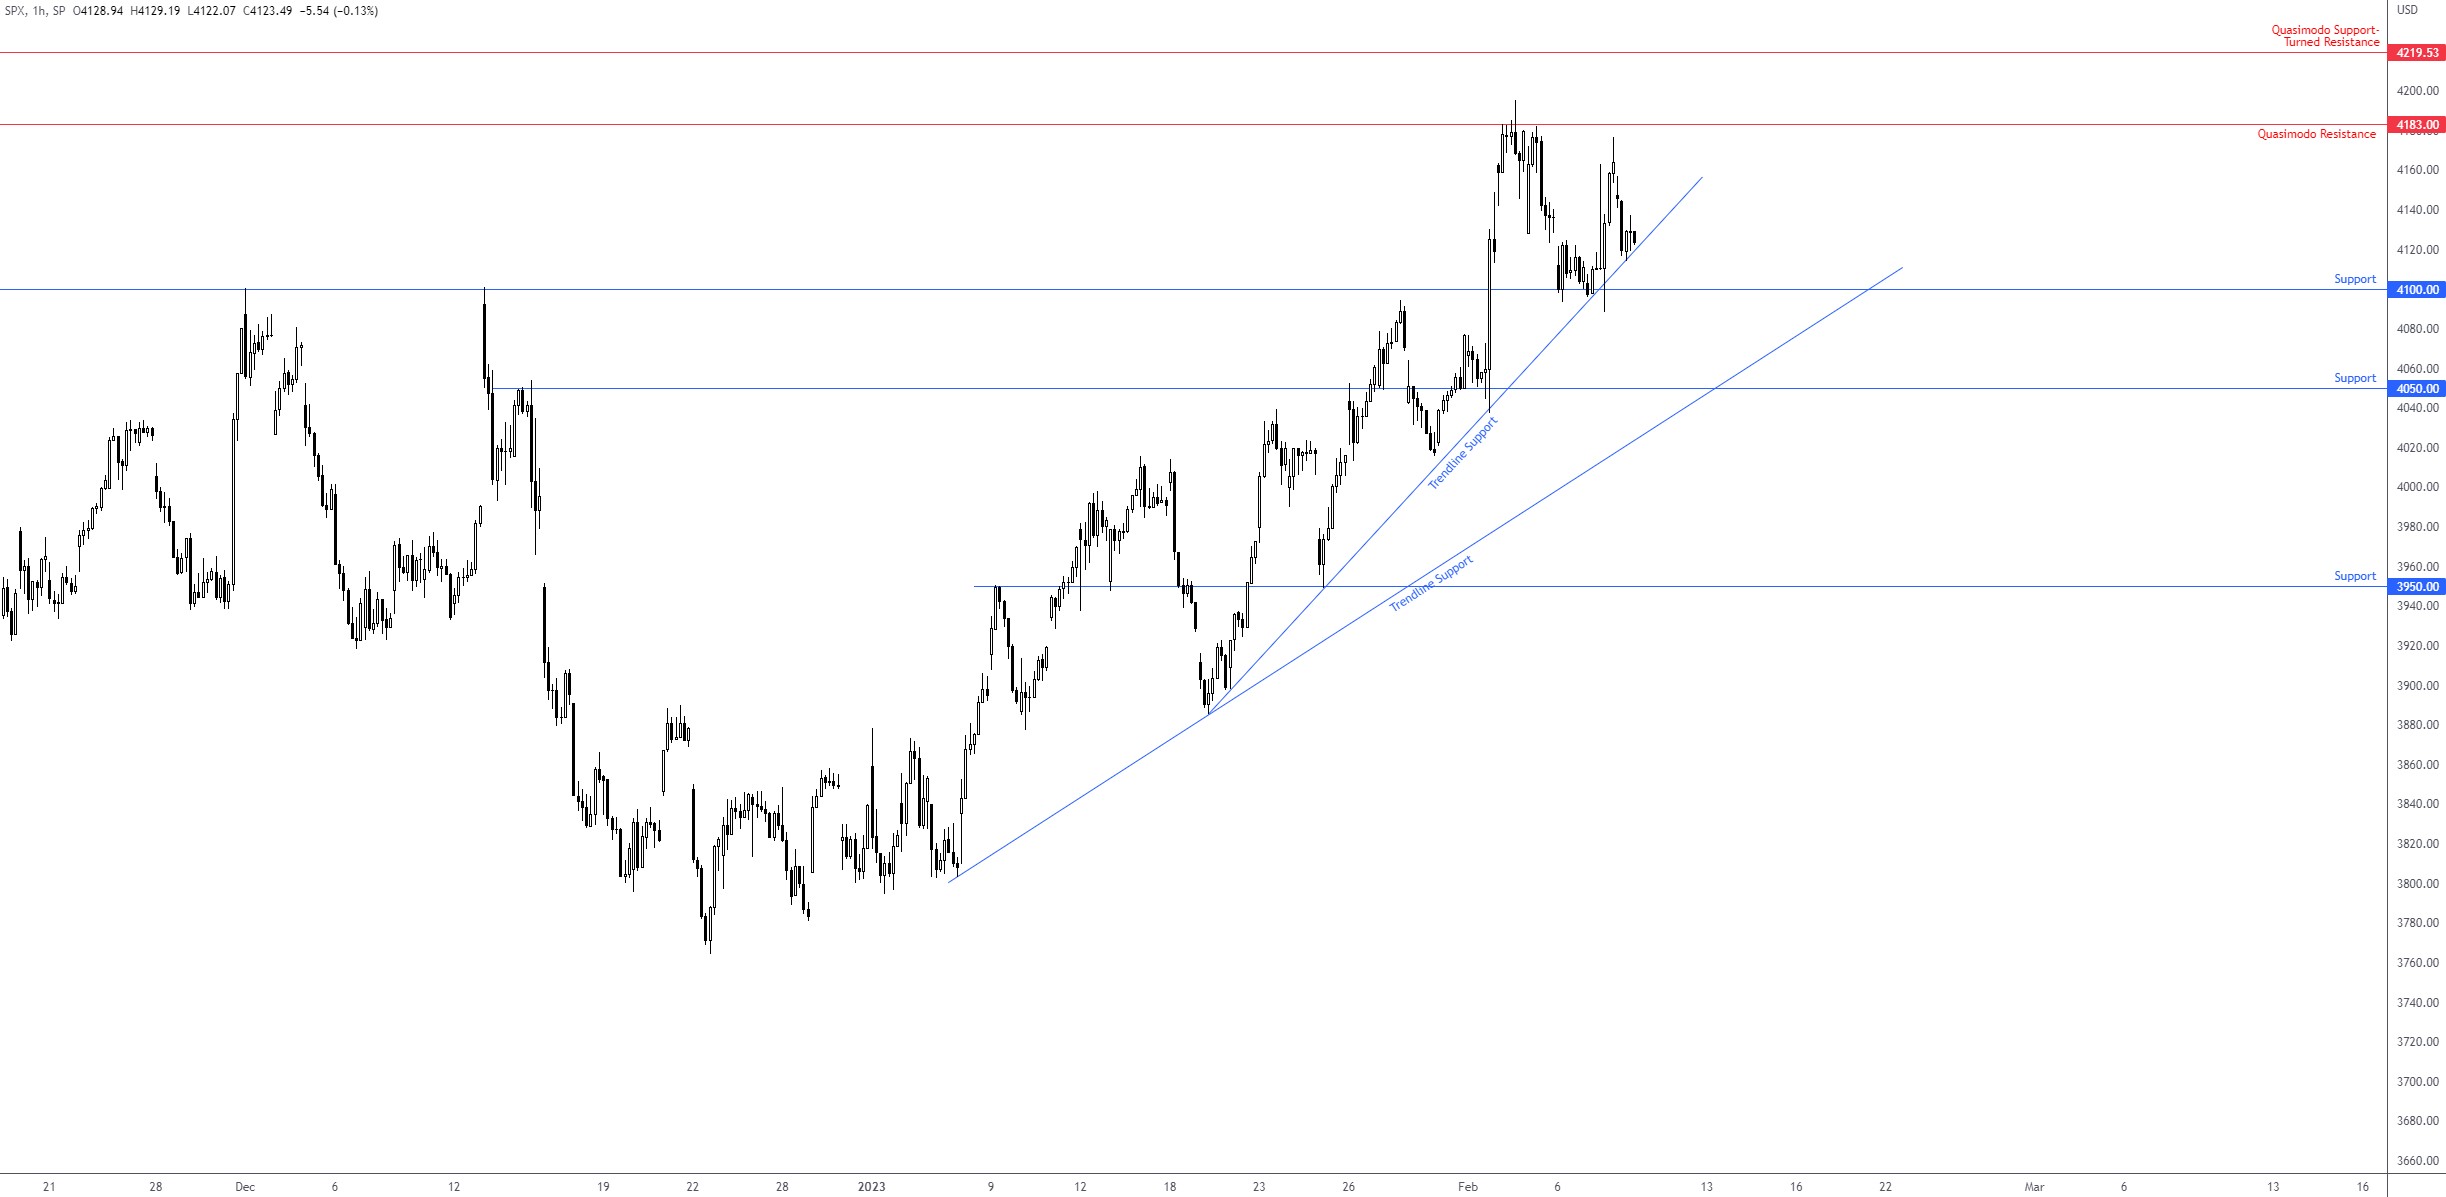
H1 support from 4,100 and trendline support, drawn from the low 3,885, have withstood downside efforts. Beyond these levels point to support from 4,050 and a neighbouring trendline support, taken from the low 3,803, while pursuing higher ground focusses on Quasimodo resistance at 4,183, followed by a Quasimodo support-turned potential resistance at 4,219.
Ultimately, this is a market STILL favouring buyers.
Monthly, Weekly and Daily Charts:
 H1 Chart:
 XAU/USD (Gold)
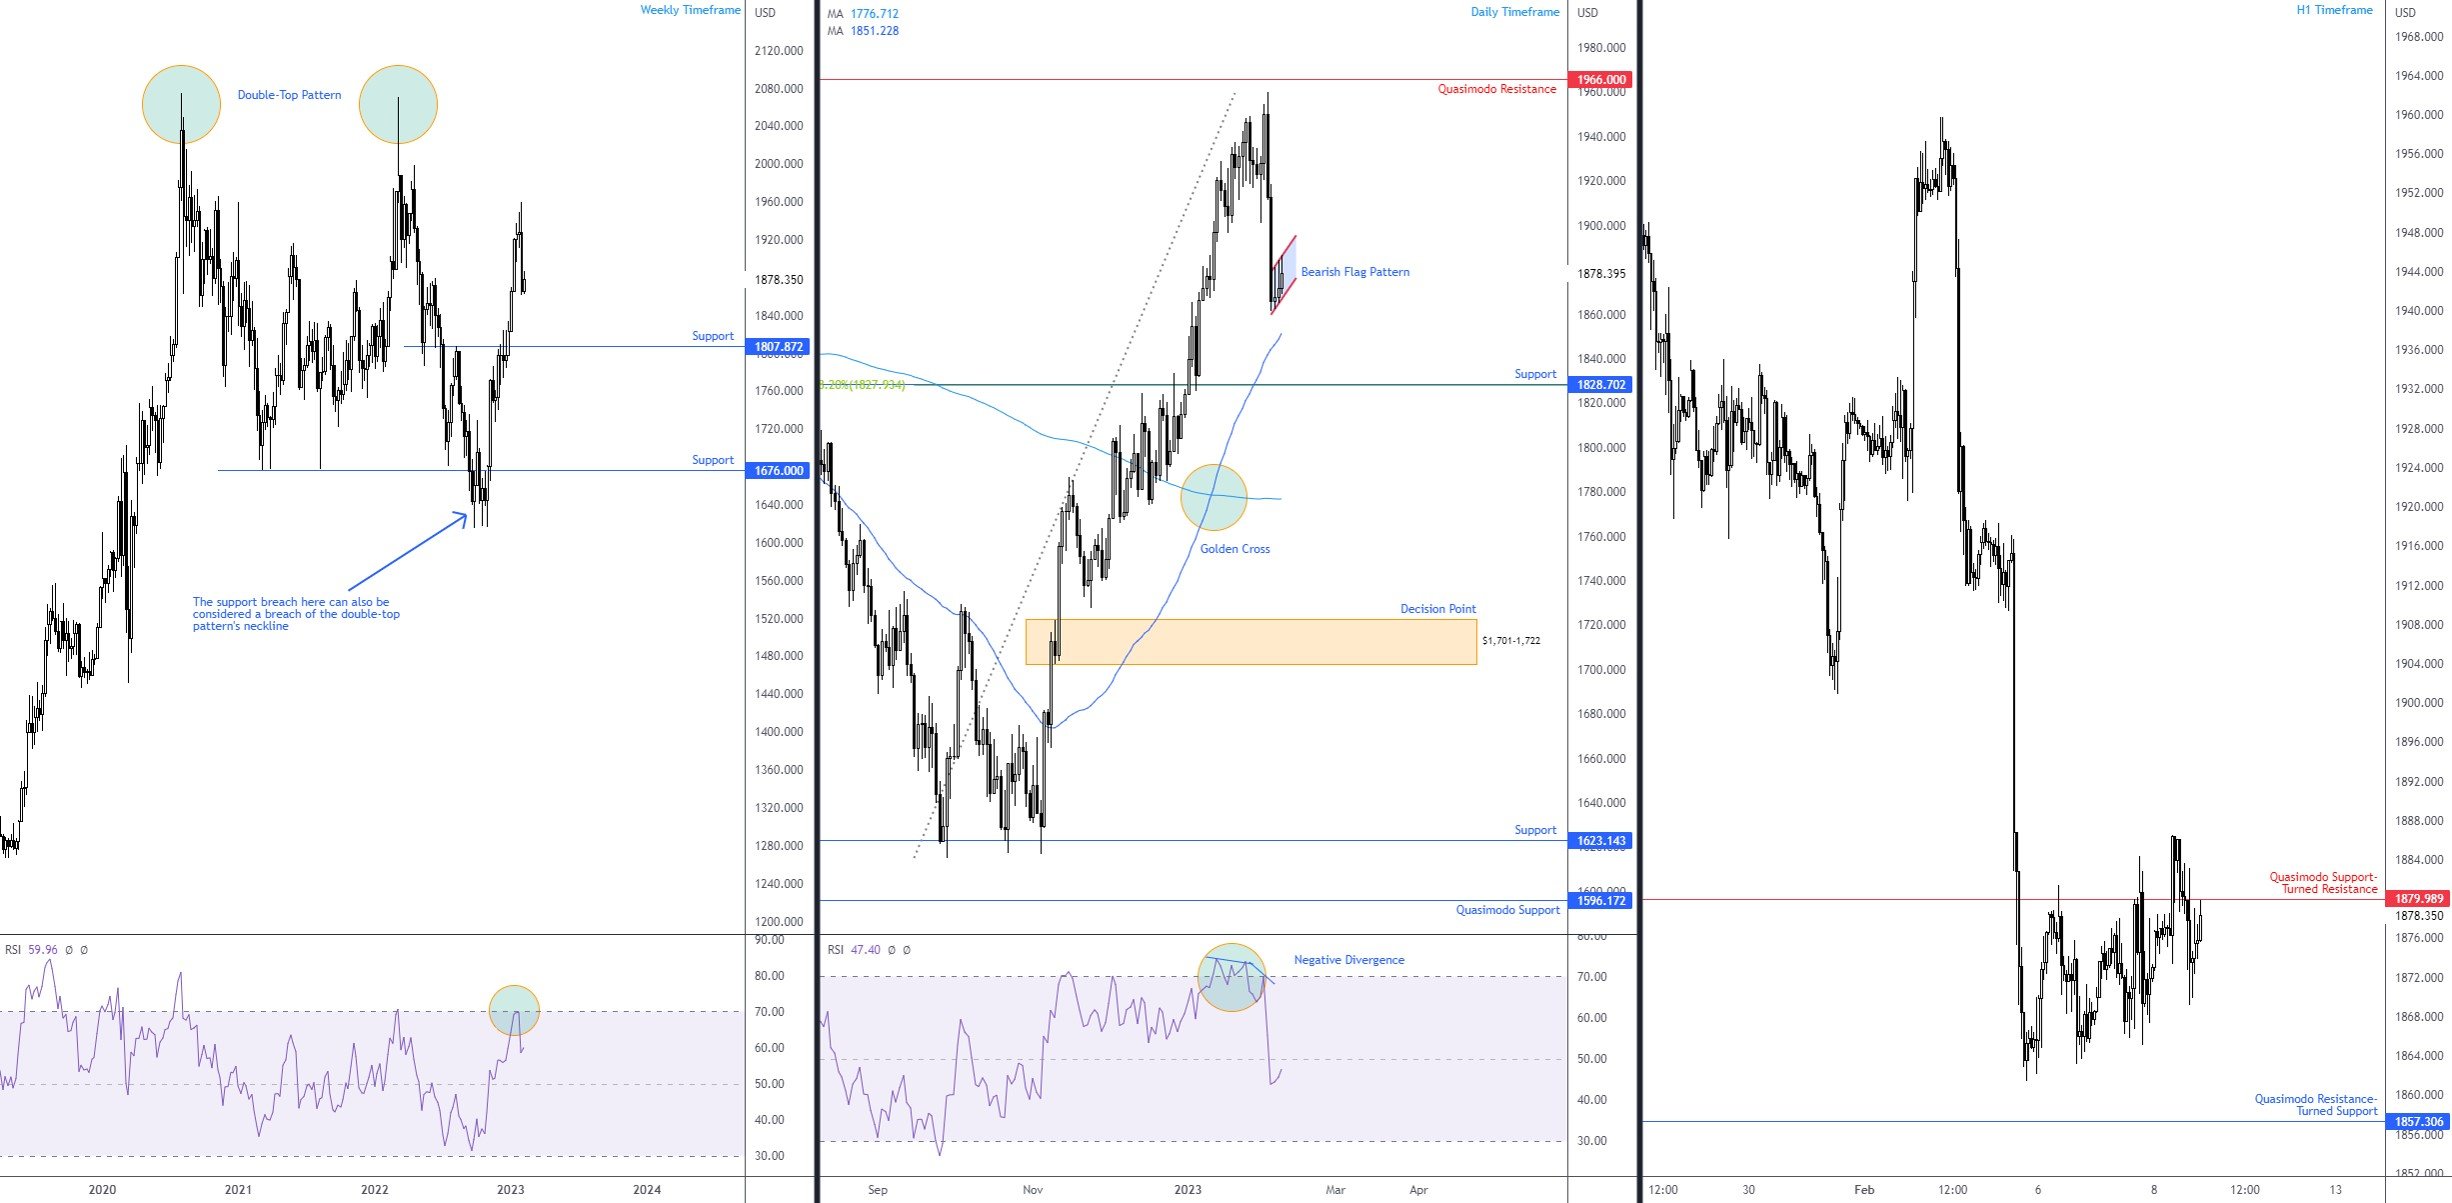
Although the price of gold is higher this week, momentum has been sluggish, consequently establishing a potential bearish flag pattern on the daily chart between $1,881 and $1,862. Rupturing the lower boundary, the said pattern not only permits chart pattern traders to project the pattern’s profit objective, it also exposes the 50-day simple moving average at $1,851 and support coming in at $1,828, which happens to join hands with a 38.2% Fibonacci retracement ratio at $1,827. Also of technical significance on the daily timeframe is the Relative Strength Index (RSI), establishing negative divergence and exploring space below the 50.00 centreline (negative momentum).
In terms of trend structure for the daily scale, here is where I left the charts in recent analysis (italics):
The trend is technically higher. The trend reversal presented itself in early December last year following the break of the $1,786 previous high in November 2022. Since then, the precious metal also recently welcomed what is known as a Golden Cross, which is the 50-day simple moving average crossing above the 200-day simple moving average ($1,776). However, should the daily chart develop a lower high and a subsequent lower low, this will inform the market that the precious metal has established a bearish trend reversal. The test for this market, therefore, is at the daily support from $1,828.
Having seen the weekly timeframe’s technical position exhibiting scope to drop lower and cross swords with support at $1,807, a breakout below the daily chart’s bearish flag pattern is in the offing. This is reaffirmed on the H1 scale; price responded to a Quasimodo support-turned resistance at $1,879 and further selling could haul the yellow metal as far south as H1 Quasimodo resistance-turned potential support at $1,857.
 BTC/USD
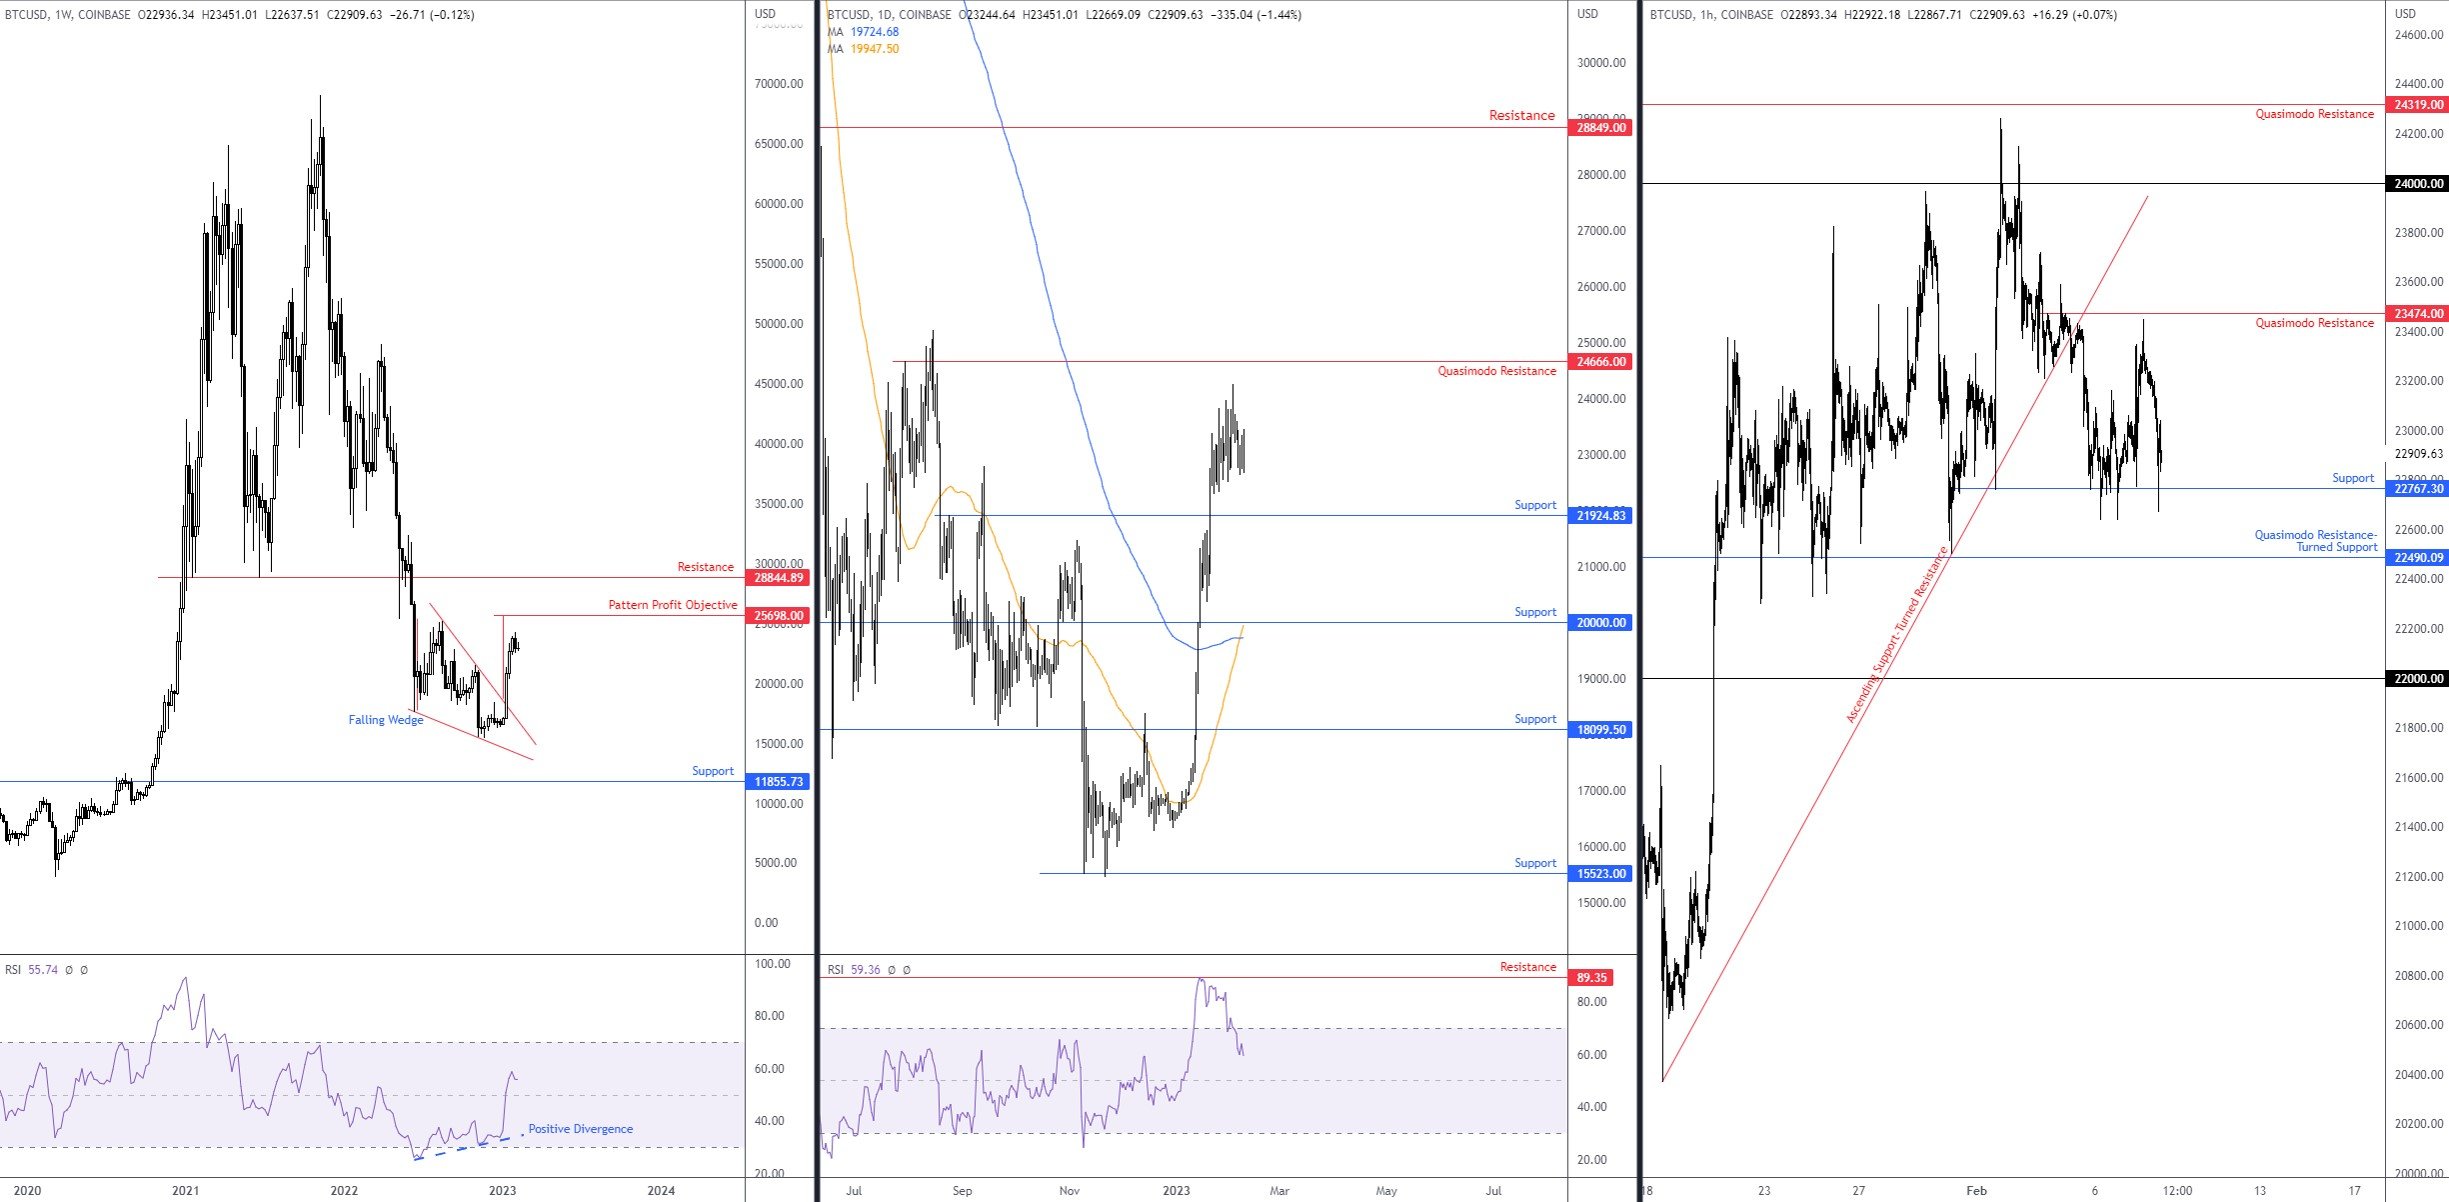
Short-term flow for the major crypto has been working with space between H1 Quasimodo resistance at $23,474 and H1 support from $22,767. Outside of this area, technical elements draw focus to $24,000 and Quasimodo resistance-turned support at $22,490. In view of the recent ranging movement, much of the following analysis will echo thoughts put forward in previous research (italics):
The weekly timeframe:
In the company of the weekly timeframe’s RSI voyaging north of its 50.00 centreline (followed by positive divergence), BTC/USD appears poised to target a falling wedge (between $25,214 and $17,567) pattern’s profit objective at $25,698, closely trailed by resistance at $28,844.
The daily timeframe:
In light of last week’s bout of selling (down 3.4% and snapping a 4-week winning streak), the support level at $21,924 is a reasonable downside objective on the daily chart and might be enough to prompt dip buying. The fact that the Relative Strength Index (RSI) exited overbought space after reacting from overbought resistance at 89.35 supports selling towards the daily support. An additional technical (bullish) observation on the daily chart bolstering $21,924, of course, is the Golden Cross (the 50-day simple moving average [$19,949] crossing above the 200-day simple moving average [$19,725]) which signals that bulls might seek control and a longer-term uptrend may be on the table.
On account of the noted analysis, the daily timeframe informs investors that sellers could remain in command until joining hands with daily support at $21,924. This places a favourable light on the H1 resistance from $23,474 and breakout selling under H1 support at $22,767 towards at least H1 Quasimodo resistance-turned support at $22,490. However, further downside could materialise beyond $22,490 in the direction of $22,000 as this psychological barrier shares a connection with daily support noted above at $21,924.
 DISCLAIMER:
The information contained in this material is intended for general advice only. It does not take into account your investment objectives, financial situation or particular needs. FP Markets has made every effort to ensure the accuracy of the information as at the date of publication. FP Markets does not give any warranty or representation as to the material. Examples included in this material are for illustrative purposes only. To the extent permitted by law, FP Markets and its employees shall not be liable for any loss or damage arising in any way (including by way of negligence) from or in connection with any information provided in or omitted from this material. Features of the FP Markets products including applicable fees and charges are outlined in the Product Disclosure Statements available from FP Markets website, www.fpmarkets.com and should be considered before deciding to deal in those products. Derivatives can be risky; losses can exceed your initial payment. FP Markets recommends that you seek independent advice. First Prudential Markets Pty Ltd trading as FP Markets ABN 16 112 600 281, Australian Financial Services License Number 286354.


 Access +10,000 financial
instruments
Access +10,000 financial
instruments