
In his first public appearance of 2023, US Federal Reserve Chair Jerome Powell participated in a panel discussion (Central bank independence and the mandate – evolving views) on Tuesday and reiterated the Fed’s commitment to contain inflation. Powell added that ‘restoring price stability when inflation is high can require measures that are not popular in the short term as we raise interest rates to slow the economy’. However, comments on upcoming policy moves were minimal.
Early trading on Wednesday saw Aussie retail sales jump in November as inflation surprised markets to the upside, climbing to 7.3% in the 12 months to November, up from 6.9%. The Reserve Bank of Australia will meet for the first time this year on 7 February, projected to increase the Cash Rate by 25 basis points.
Today’s inflation data out of the US serves as the macro highlight for the week. The consensus heading into the event forecasts a 6th deceleration to 6.5% in the 12 months to December, with a forecast range spanning between a 6.8% high and a 6.3% low, down from 7.1% in November.
Technical View for Key Markets
Charts: TradingView
EUR/USD Resistance in View
As seen from the weekly timeframe, the late pullback from the $0.9536 low at support from $0.9606 has seen the currency pair come within striking distance of Quasimodo support-turned resistance at $1.0778 this week. This represents healthy resistance, though a break higher could clear the path for a test of weekly resistance from $1.1174.
Meanwhile on the daily timeframe, price action eventually discovered a floor around the support level at $1.0602, aided by the relative strength index (RSI) rebounding from the 50.00 centreline support. The unit is now poised to shake hands with prime resistance coming in from $1.0954-1.0864, arranged above the noted weekly resistance level.
Across the page, the H1 timeframe shows price connected with a Quasimodo resistance at $1.0764 in recent hours, sheltered just beneath the $1.08 psychological handle. To the downside, $1.07 calls for attention, followed by Quasimodo resistance-turned support at $1.0691. Thus, between the two aforementioned resistance levels is an area sellers could welcome, considering the connection this zone has with weekly resistance noted above at $1.0778.
 Amazon Breakaway Gap North
Daily Timeframe:
Following a 50.0% slump last year, could things be on the up for Amazon?
After price bottoming at a weekly Quasimodo support from $83.60, just ahead of a daily AB=CD bullish pattern (the 100% projection at $77.21), Wednesday witnessed a breakaway gap higher, one that forged a breakout above trendline resistance, taken from the high $146.57. Up 4.5% as of current trading, the share price has scope to extend recovery gains until meeting with resistance priced in at $101.44.
Technicians may acknowledge a breakout above a falling wedge also occurred, drawn from between $103.79 and $85.87. This is a reversal structure, with many traders often taking the base value and adding this to the breakout point (orange rectangles) to calculate a profit objective, which, in this case, is set at $106.97, fixed just north of the resistance noted above at $101.44.
 Interesting Technical Structure on Ripple (XRP/USD)
Kicking off with the H4 timeframe, it is clear to see the altcoin has run into familiar resistance in recent trading at $0.3722. To reach this level, you will see that a descending resistance was consumed, drawn from the high $0.4183.
On the M15 timeframe, we have a potential AB=CD bullish structure forming off the H4 resistance which could draw price movement to retest the breached descending resistance-turned support mentioned above. Assuming bulls remain in control, further buying in this market could pull the action beyond $0.3722 to a H4 Quasimodo resistance at $0.3900.
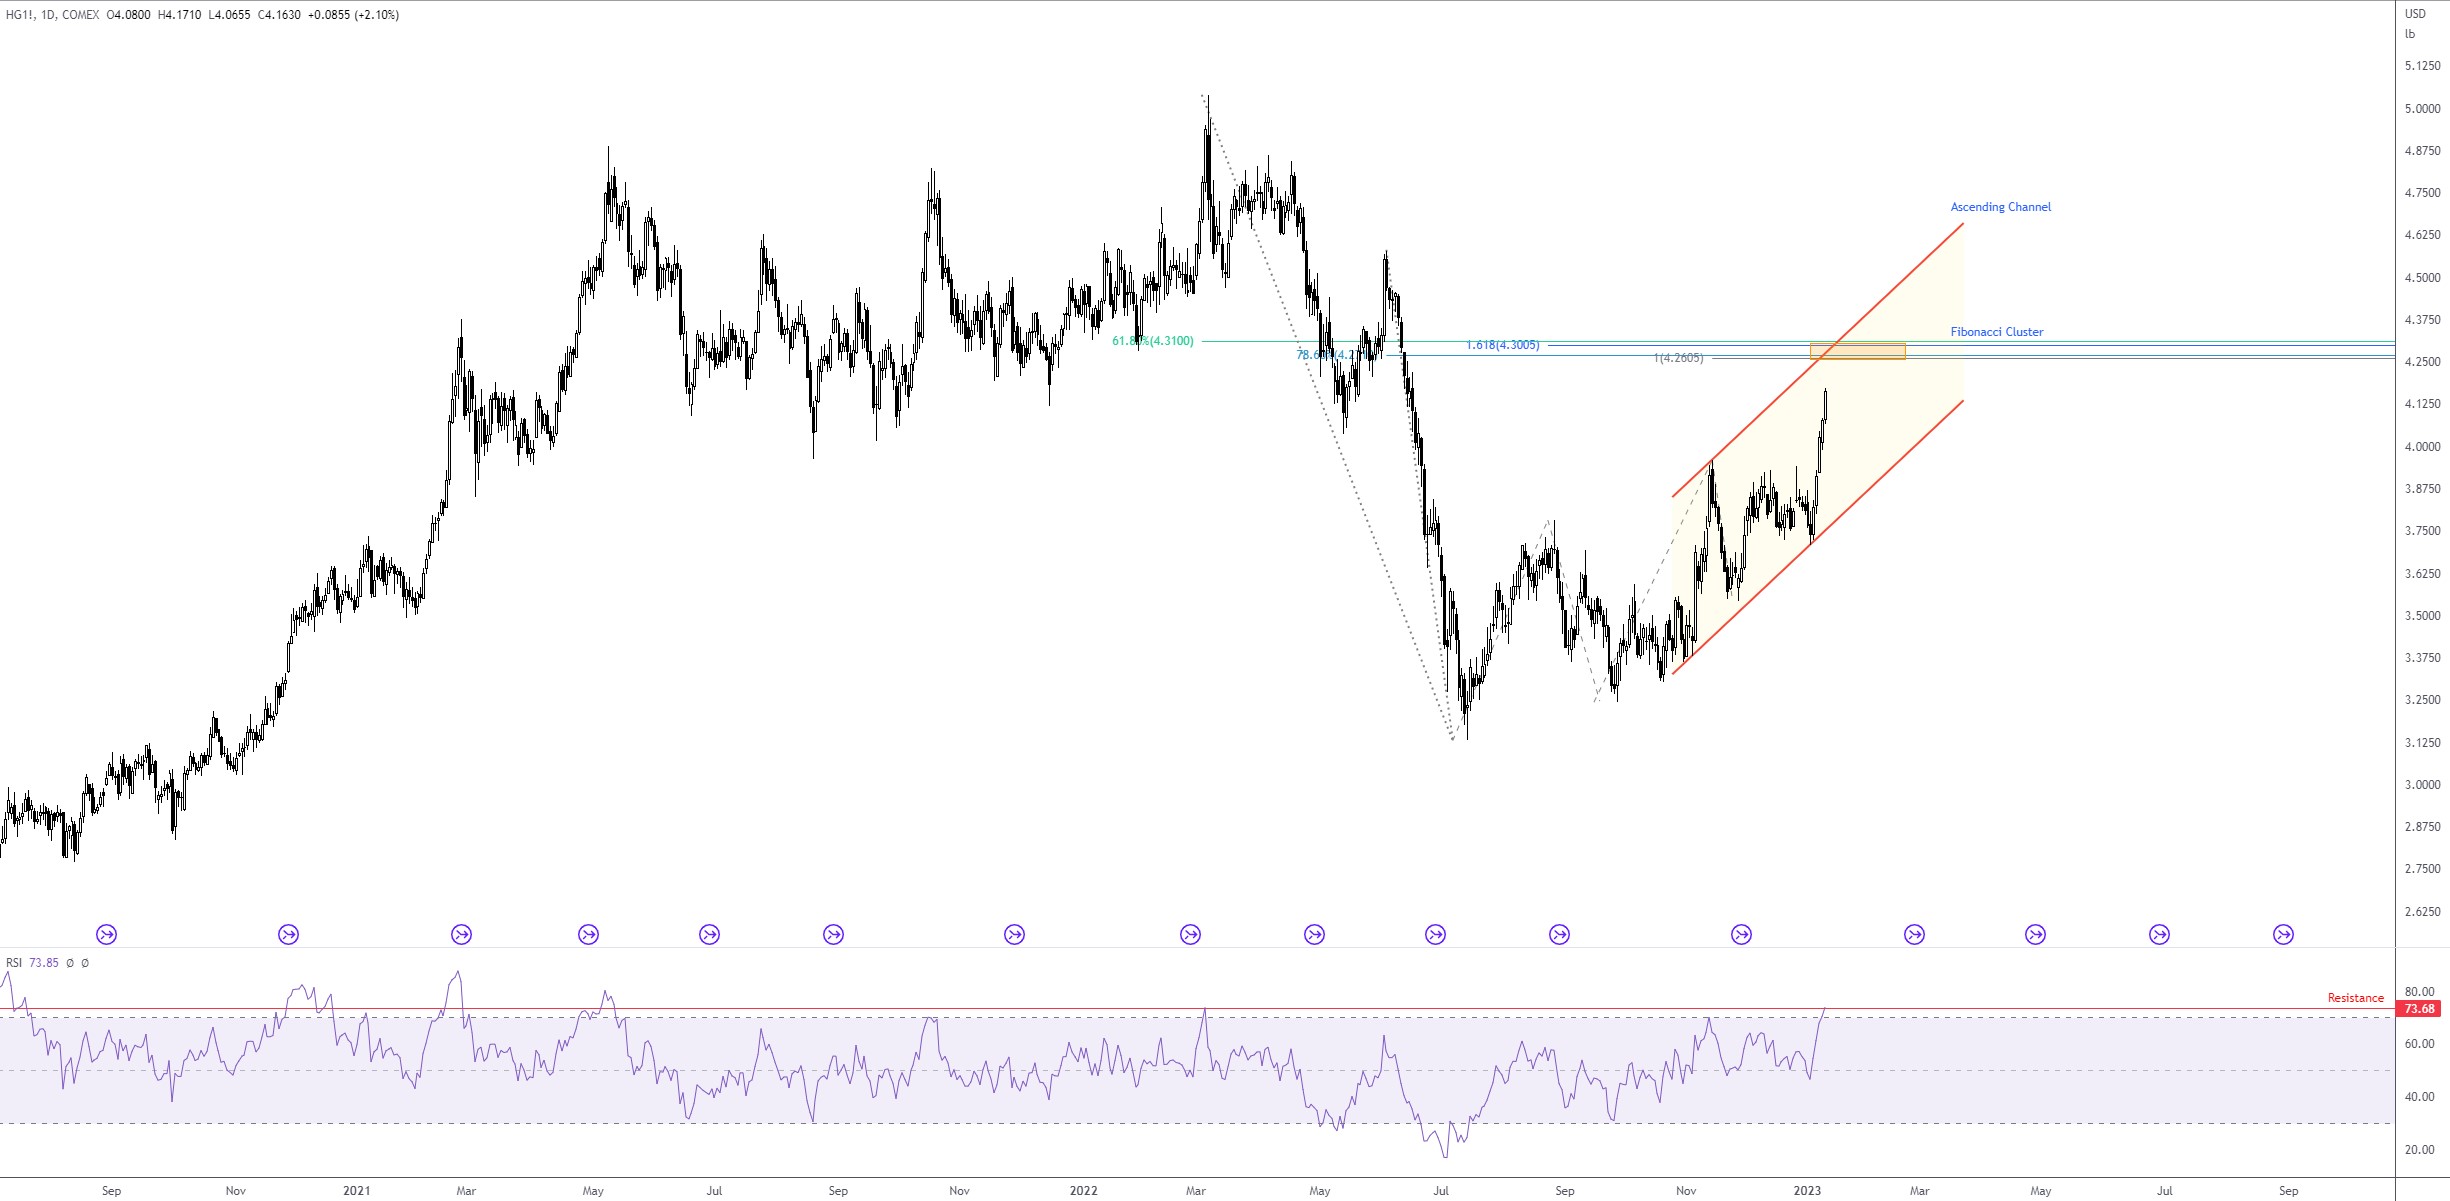
 Copper Futures Tearing Higher
Daily Timeframe:
Trading higher for a 5th consecutive daily session, copper futures recently broke to the upside in dominant fashion. Given the base metal’s ability to forecast economic health (Doctor Copper), a rise in copper prices is generally viewed as a positive for the economy. Technically, however, trouble could be overhead. A Fibonacci cluster is positioned between $4.31 and $4.26, which happens to share space with a channel resistance, taken from the high $3.96.
The relative strength index (RSI) also displays overbought conditions, testing indicator resistance at 73.68 (its highest level since March 2022).
Therefore, given the position of price on the daily scale, buyers could remain at the wheel for the time being, at least until the noted Fibonacci cluster.
 DISCLAIMER:
The information contained in this material is intended for general advice only. It does not take into account your investment objectives, financial situation or particular needs. FP Markets has made every effort to ensure the accuracy of the information as at the date of publication. FP Markets does not give any warranty or representation as to the material. Examples included in this material are for illustrative purposes only. To the extent permitted by law, FP Markets and its employees shall not be liable for any loss or damage arising in any way (including by way of negligence) from or in connection with any information provided in or omitted from this material. Features of the FP Markets products including applicable fees and charges are outlined in the Product Disclosure Statements available from FP Markets website, www.fpmarkets.com and should be considered before deciding to deal in those products. Derivatives can be risky; losses can exceed your initial payment. FP Markets recommends that you seek independent advice. First Prudential Markets Pty Ltd trading as FP Markets ABN 16 112 600 281, Australian Financial Services License Number 286354.


 Access +10,000 financial
instruments
Access +10,000 financial
instruments