
Charts: Trading View
EUR/USD:
Monthly timeframe:
(Technical change on this timeframe is often limited, though serves as guidance to potential longer-term moves)
South of ascending support-turned resistance, taken from the low $1.1641, June’s 3.0 percent loss persuaded EUR/USD to retest support from $1.1857-1.1352. A bullish revival shines light on 2021 peaks at $1.2349.
Month to date, September trades 0.5 percent higher.
Based on trend studies, a primary uptrend has been underway since price broke the $1.1714 high (Aug 2015) in July 2017. Further adding to this, price penetrated major trendline resistance, taken from the high $1.6038, in July 2020.
Daily timeframe:
Analysis largely unchanged from previous writing.
Monday observed the greenback trim losses sustained on Friday, following disappointing headline US non-farm payrolls. Ultimately, though, markets welcomed a narrow range as a result of US banks closing in observance of Labour Day.
Buyers and sellers, as you can see, remain squaring off around late July tops at $1.1909ish. Cementing a close north of the latter seats resistance between $1.2033 and $1.1994 in the firing range, organised by way of a 61.8% Fib, the 200-day simple moving average and Quasimodo support-turned resistance. What’s interesting here is a break of $1.1909 highs likely trips buy-stops, perhaps generating enough upside oomph to fill $1.2033-1.1994 offers.
With regards to long-term trend, 2021 has been directionless, despite healthy gains in 2020.
As for momentum, the relative strength index (RSI) is on the verge of crossing swords with trendline resistance just ahead of overbought territory. Also of note is resistance plotted at 80.39. This shows momentum is perhaps gearing up to level off.
H4 timeframe:
Analysis unchanged from previous writing.
$1.1907 resistance, a level holding back buyers since late June, called for attention Friday, with Monday touching $1.1856. The interesting feature, however, is the stops above $1.1907, and the zone of resistance at $1.1955-1.1933. Also seen is Quasimodo resistance at $1.1956.
Buy-stops above $1.1907 may be enough to fuel offers at $1.1955-1.1933, creating a short-term bearish phase back to at least $1.1907.
H1 timeframe:
Monday shook hands with a minor Fibonacci cluster, made up of a 100% Fib projection at $1.1860 and a 61.8% Fib retracement at $1.1863. Buyers established a tentative defence off the noted floor amid London hours and remains supportive ahead of the closing bell.
Pursuing higher levels shifts focus back to $1.19, a psychological barrier aligned with a 100% Fib projection at $1.1904, a longer-term 38.2% Fib retracement at $1.1896 (taken from the $1.2266 May 25th high) as well as a 1.618% Fib expansion at $1.1913.
From the standpoint of the relative strength index (RSI), the indicator grasped the lower limits of its two-week range between 40.00 and 50.00 in recent movement. It is common to watch the 40.00-50.00 region serve as a temporary oversold threshold during rising markets. And this is what we’re seeing here.
Observed levels:
Seeing H1 defending the $1.1860ish zone—reinforced by a H1 RSI oversold signal and monthly support from $1.1857-1.1352—puts forth a bullish vibe, targeting north of $1.19 to H4 resistance at $1.1955-1.1933.

AUD/USD:
Monthly timeframe:
(Technical change on this timeframe is often limited, though serves as guidance to potential longer-term moves)
Month to date, September is higher by 1.6 percent, consequently trimming a portion of the recent three-month decline.
Long-term areas to be mindful of are support at $0.6305-0.6872 and supply coming in at $0.8303-0.8082, along with trendline support-turned resistance, taken from the low $1.4776.
Trend studies (despite the trendline resistance [drawn from the high $1.0582] breach in July 2020) show the primary downtrend (since mid-2011) is in play until breaking $0.8135 (January high 2018).
Daily timeframe:
Analysis unchanged from previous writing.
AUD/USD bulls strengthening their grip and overthrowing Quasimodo resistance at $0.7414 emphasises a bullish setting.
Addressing resistance between $0.7665 and $0.7590, therefore, is possible, an area made up of a 61.8% Fib retracement at $0.7665, a Quasimodo support-turned resistance at $0.7621, the 200-day simple moving average at $0.7605 and another 61.8% Fib retracement at $0.7590.
Interestingly, in conjunction with the resistance breach, the relative strength index (RSI) climbed above trend line resistance, taken from the high 80.12. This places overbought space in range, in particular resistance at 80.19.
H4 timeframe:
Analysis unchanged from previous writing.
Short-term volatility thinned Monday thanks to US banks shutting for Labour Day. In light of the muted start to the week, the technical background remains unaltered.
Under the influence of channel resistance, drawn from the high $0.7271, Friday concluded a touch off best levels. Earlier, however, commanded a bullish presence and formed a clear-cut decision point at $0.7393-0.7410 to drive through daily Quasimodo resistance mentioned above at $0.7414 (now a serving support).
Dip-buyers are likely to show interest in $0.7393-0.7410 should a test form, aided by channel support, taken from the low $0.7107, and neighbouring daily support at $0.7414. A realistic upside objective resides at $0.7494: a Quasimodo resistance joined by a 1.618% Fib projection at $0.7497.
H1 timeframe:
The decision point underlined in Monday’s technical briefing at $0.7429-0.7438 had its limits challenged yesterday, possibly concerning longs at this base.
Below the area is $0.74, which shares chart space with the 100-period simple moving average at $0.7392. North of the decision point, nonetheless, draws attention to Quasimodo resistance at $0.7472 and the $0.75 region.
The relative strength index (RSI) is seen crawling along the lower edge of its range between overbought and the 50.00ish level. The 40.00-50.00 area acting as oversold is common during lengthy moves higher. Therefore, it’s worth keeping a close eye on this area.
Observed levels:
In light of the lacklustre performance Monday, the observed levels remain unchanged.
From the bigger picture, observing daily price manoeuvre north of Quasimodo resistance at $0.7414 communicates a bullish vibe towards resistance between $0.7665 and $0.7590.
With this in mind, the H4 decision point at $0.7393-0.7410 offers a primary area of support. Not only joined closely by daily support at $0.7414, the H4 zone also works closely with H4 channel support.
Chart studies, therefore, suggest the H1 decision point at $0.7429-0.7438 echoes a precarious tone. This places $0.74 in the line of fire as a possible support, joined by the noted H4 supports underlined above.
Ultimately, any bullish scenario may take aim at $0.75ish, based on the H4 technical picture.

USD/JPY:
Monthly timeframe:
(Technical change on this timeframe is often limited, though serves as guidance to potential longer-term moves)
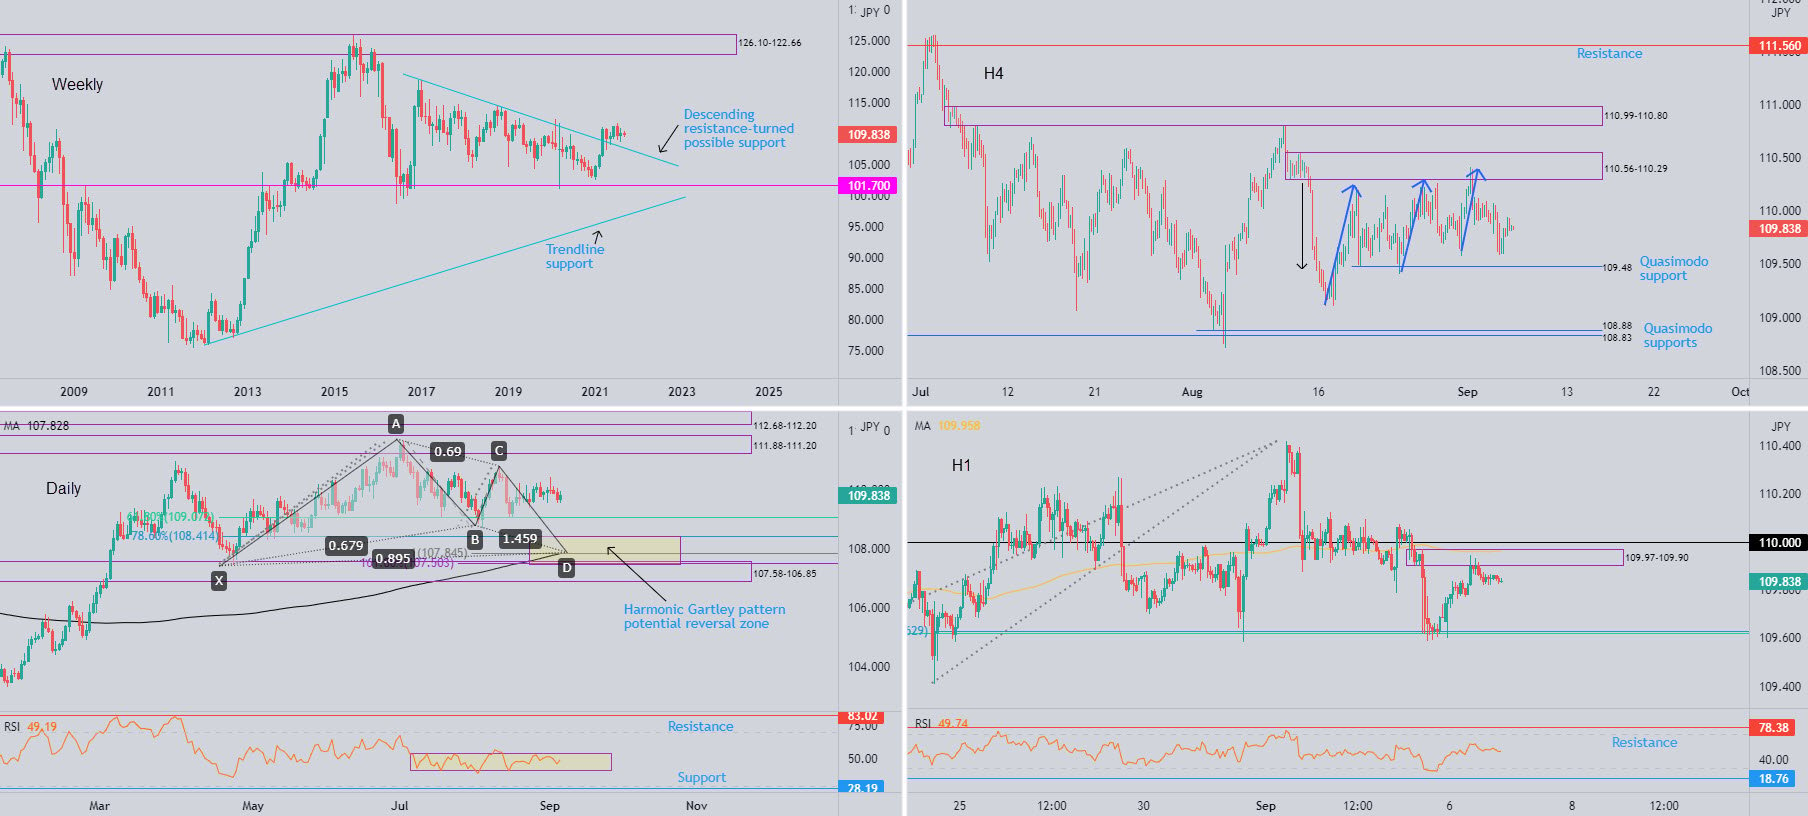
Since April retested descending resistance-turned support, etched from the high ¥118.66, price action has maintained moderate support. Pursuing higher levels could eventually strive for long-term supply at ¥126.10-122.66.
Month to date, September trades 0.1 percent in the red.
Daily timeframe:
Analysis unchanged from previous writing.
Technical support is evident around the 61.8% Fib retracement at ¥109.07. More engaging, nonetheless, is the harmonic Gartley pattern’s potential reversal zone between ¥107.50 and ¥108.41, reinforced by supply-turned demand at ¥107.58-106.85.
When it comes to trend, USD/JPY has been higher in 2021.
From the relative strength index (RSI), a range has been in process between 40.94 and 54.43 since early July. This tells traders that upside momentum is weak: average losses exceed average gains.
H4 timeframe:
Analysis unchanged from previous writing.
Last week witnessed the unit cross swords with supply at ¥110.56-110.29 and subsequently explore lower levels.
Upside momentum, as demonstrated through the three blue arrows, has been diminishing since mid-August, which alerted traders to a possible bearish theme from the aforementioned supply.
Continued interest to the downside faces Quasimodo support at ¥109.48, with a break uncovering two Quasimodo support levels at ¥108.88 and ¥108.83.
H1 timeframe:
Despite Monday’s thin trading conditions, the currency pair extended recovery gains north of a mild Fibonacci cluster around ¥109.62ish (61.8% and 78.6%).
The decision point at ¥109.97-109.90, which connects with the 100-period simple moving average at $109.96 and is situated just south of $110, also made an entrance. There was very little on the charts suggesting a whipsaw above $110, hence the decision point standing firm.
Voyaging beneath the noted Fibonacci cluster underlines the ¥109 figure as a possible downside objective.
As for the relative strength index (RSI), we are testing the mettle of the 50.00 centreline, following a recent move out of oversold.
Observed levels:
From a shorter-term perspective, H4 Quasimodo support at ¥109.48 is unlikely to provide much of a floor if tested. A more realistic downside target is two Quasimodo support levels at ¥108.88 and ¥108.83, as they align closely with the daily timeframe’s 61.8% Fib retracement at ¥109.07.
As a result of the above, the H1 may welcome a bearish theme, with sellers possibly looking to take action south of the decision point at ¥109.97-109.90 for a potential break through the Fibonacci cluster between ¥109.58 and ¥109.63, targeting ¥109ish.
GBP/USD:
Monthly timeframe:
(Technical change on this timeframe is often limited, though serves as guidance to potential longer-term moves)
Since February, GBP/USD has echoed an indecisive environment below $1.4377: April high 2018. This follows December’s (2020) trendline resistance breach, taken from the high $2.1161, a descending barrier possibly serving as support if retested.
Month to date, September trades 0.6 percent higher.
Primary trend structure has faced lower since early 2008, unbroken (as of current price) until $1.4377 gives way.
Daily timeframe:
Analysis unchanged from previous writing.
The key technical move on the daily chart to be mindful of is the recent price cross above the 200-day simple moving average at $1.3808, a move some technicians label as bullish. This follows August 23rd recovery from Quasimodo support at $1.3609.
Overhead, resistance resides at $1.4003.
With reference to trend on this chart, the pair has been somewhat rangebound since late February.
Upside momentum is gaining traction, according to the relative strength index (RSI) crossing above the 50.00 centreline. This shows average gains exceed average losses.
H4 timeframe:
Analysis unchanged from previous writing.
$1.3939-1.3887 resistance made an appearance heading into the close Friday.
The $1.3766-1.3799 decision point is now in range as a possible downside objective, a base underpinning the 200-day simple moving average on the daily at $1.3808.
H1 timeframe:
Analysis unchanged from previous writing.
Situated a handful of pips beneath $1.39, Quasimodo resistance put in an appearance at $1.3890 a few hours ahead of the close on Friday. With that, a bout of profit taking emerged, and, with Monday’s modest decline, highlights a possible retest of $1.38.
$1.38 has ‘whipsaw’ written all over it. Potentially heavy bids, therefore, might be attracted to the area marked in yellow between $1.3774 and $1.3787 in order to welcome sell-stops beneath $1.38.
From the relative strength index (RSI), we are now below the 50.00 centreline, meaning average losses exceed average gains. The break of 50.00 helps confirm short-term bearish intent.
Observed levels:
Outlook unchanged from previous writing.
The daily timeframe making its way above the 200-day simple moving average at $1.3808 is considered a bullish signal among many technical traders, and could encourage buying.
The H4 decision point at $1.3766-1.3799 is well placed to receive sellers. In addition to this, the H1 timeframe’s $1.38 base is positioned nearby, which is calling for a whipsaw to the H1 area marked in yellow between $1.3774 and $1.3787.

DISCLAIMER:
The information contained in this material is intended for general advice only. It does not take into account your investment objectives, financial situation or particular needs. FP Markets has made every effort to ensure the accuracy of the information as at the date of publication. FP Markets does not give any warranty or representation as to the material. Examples included in this material are for illustrative purposes only. To the extent permitted by law, FP Markets and its employees shall not be liable for any loss or damage arising in any way (including by way of negligence) from or in connection with any information provided in or omitted from this material. Features of the FP Markets products including applicable fees and charges are outlined in the Product Disclosure Statements available from FP Markets website, www.fpmarkets.com and should be considered before deciding to deal in those products. Derivatives can be risky; losses can exceed your initial payment. FP Markets recommends that you seek independent advice. First Prudential Markets Pty Ltd trading as FP Markets ABN 16 112 600 281, Australian Financial Services License Number 286354.


 Access +10,000 financial
instruments
Access +10,000 financial
instruments