
EUR/USD:
Monthly timeframe:
(Technical change on this timeframe is often limited though serves as guidance to potential longer-term moves)
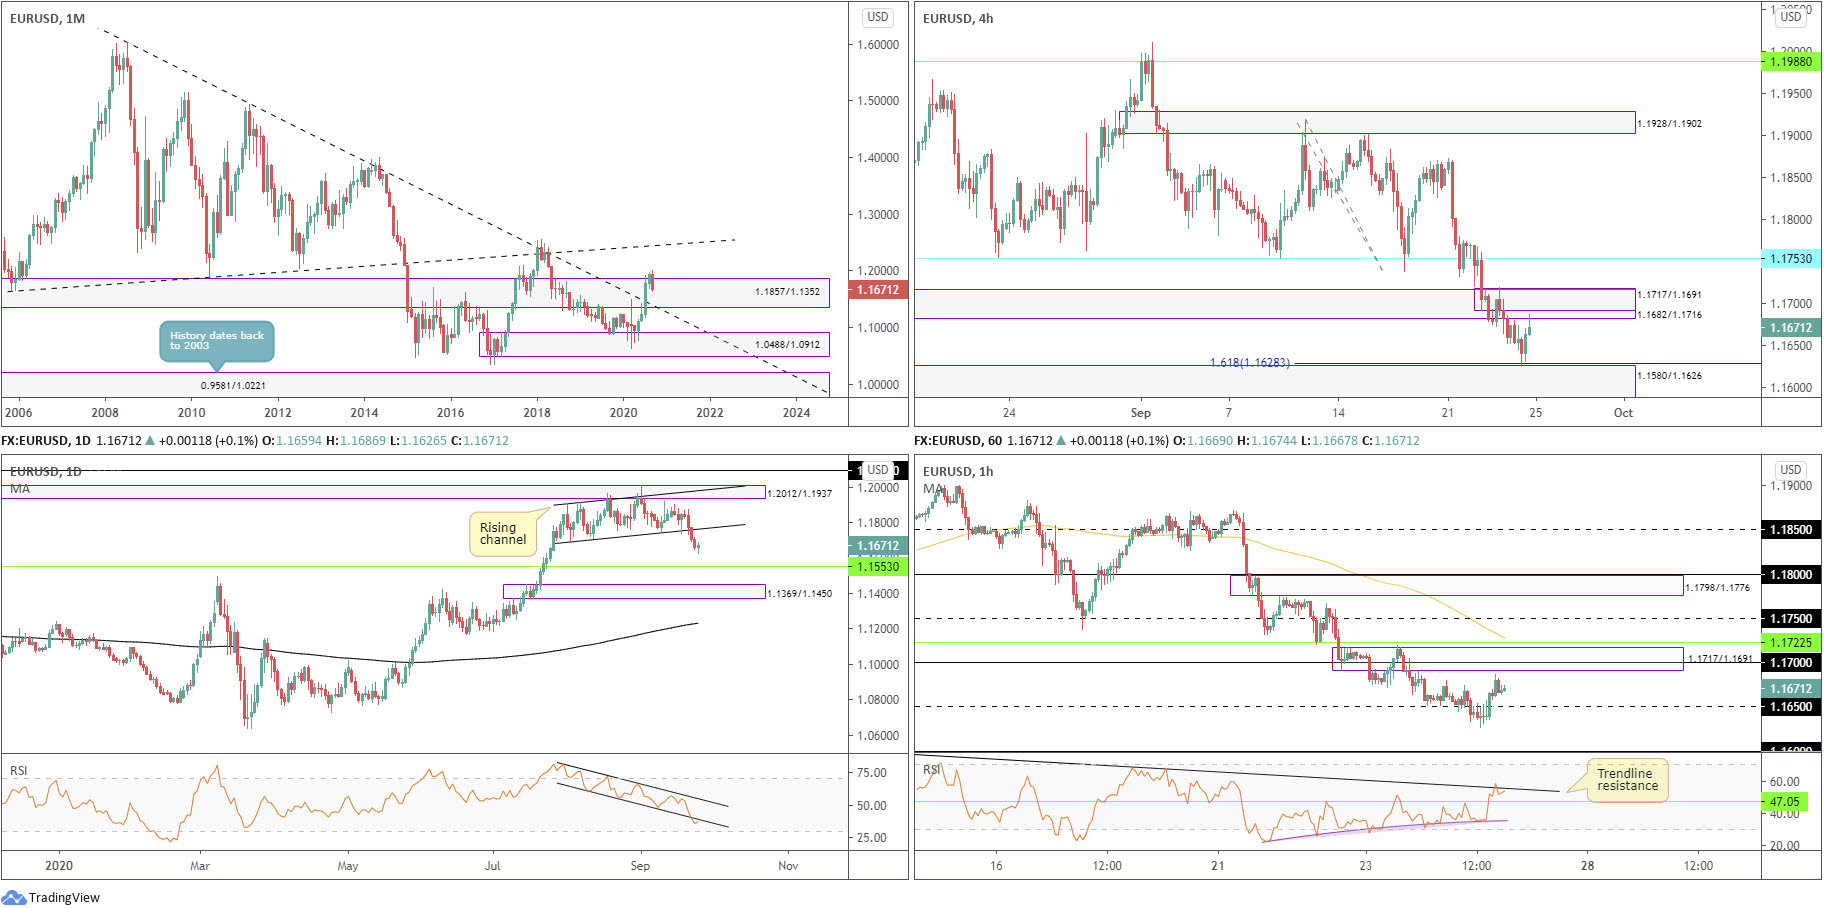
August saw the euro nudge to a fourth successive monthly gain against the US dollar, adding nearly 1.5 percent.
The move toppled supply from 1.1857/1.1352 and extended space north of long-term trendline resistance (1.6038), arguing additional upside may be on the horizon, targeting trendline resistance (prior support – 1.1641). Despite this, the primary downtrend (since July 2008) remains intact until 1.2555 is engulfed (Feb 1 high [2018]).
Trading in September is down more than 2.2 percent.
Daily timeframe:
Partially altered from previous analysis –
Although the euro concluded off worst levels Thursday, mildly snapping a 4-day losing streak, upside is likely to prove unsustainable.
The pair is tipped for more underperformance as support is not expected to surface until reaching 1.1553, with a break uncovering demand at 1.1369/1.1450.
With respect to the RSI oscillator, the line recently pushed through the lower limit of a (near) two-month descending channel formation, and is poised to retest the broken boundary.
H4 timeframe:
The euro rebounded from a 161.8% Fib ext. level at 1.1628 against the US dollar on Thursday, a level positioned three pips above demand at 1.1580/1.1626. This fed moves to supply at 1.1682/1.1716 (prior demand), though missed the supply area sited within at 1.1717/1.1691 (housed within) by a couple of pips.
As per the current candle, we’re on track to form a shooting star pattern.
H1 timeframe:
Early US on Thursday saw increased demand for the euro, pulling EUR/USD back above 1.1650 resistance to within a stone’s throw from supply at 1.1717/1.1691 (also represents supply on the H4). Traders will note this area contains the 1.17 level, and is located just south of resistance at 1.1722.
In terms of where we stand on the RSI indicator, resistance at 47.00 was taken yesterday, unlocking the possibility of a run to overbought space. However, before reaching this far north, trendline resistance from the peak 82.31 must be dethroned.
Structures of Interest:
Partially altered from previous analysis –
Monthly price is struggling to sustain gains north of supply at 1.1857/1.1352, while daily price indicates further losses are in the offing after breaking channel support.
H4 supply at 1.1682/1.1716 recently entered play, which holds H1 supply within at 1.1717/1.1691.
On account of the above analysis, H1 supply at 1.1717/1.1691 is likely a watched area today as a possible reversals zone. Near-term support targets are seen around 1.1650 support and H4 demand at 1.1580/1.1626.
AUD/USD:
Monthly timeframe:
(Technical change on this timeframe is often limited though serves as guidance to potential longer-term moves)
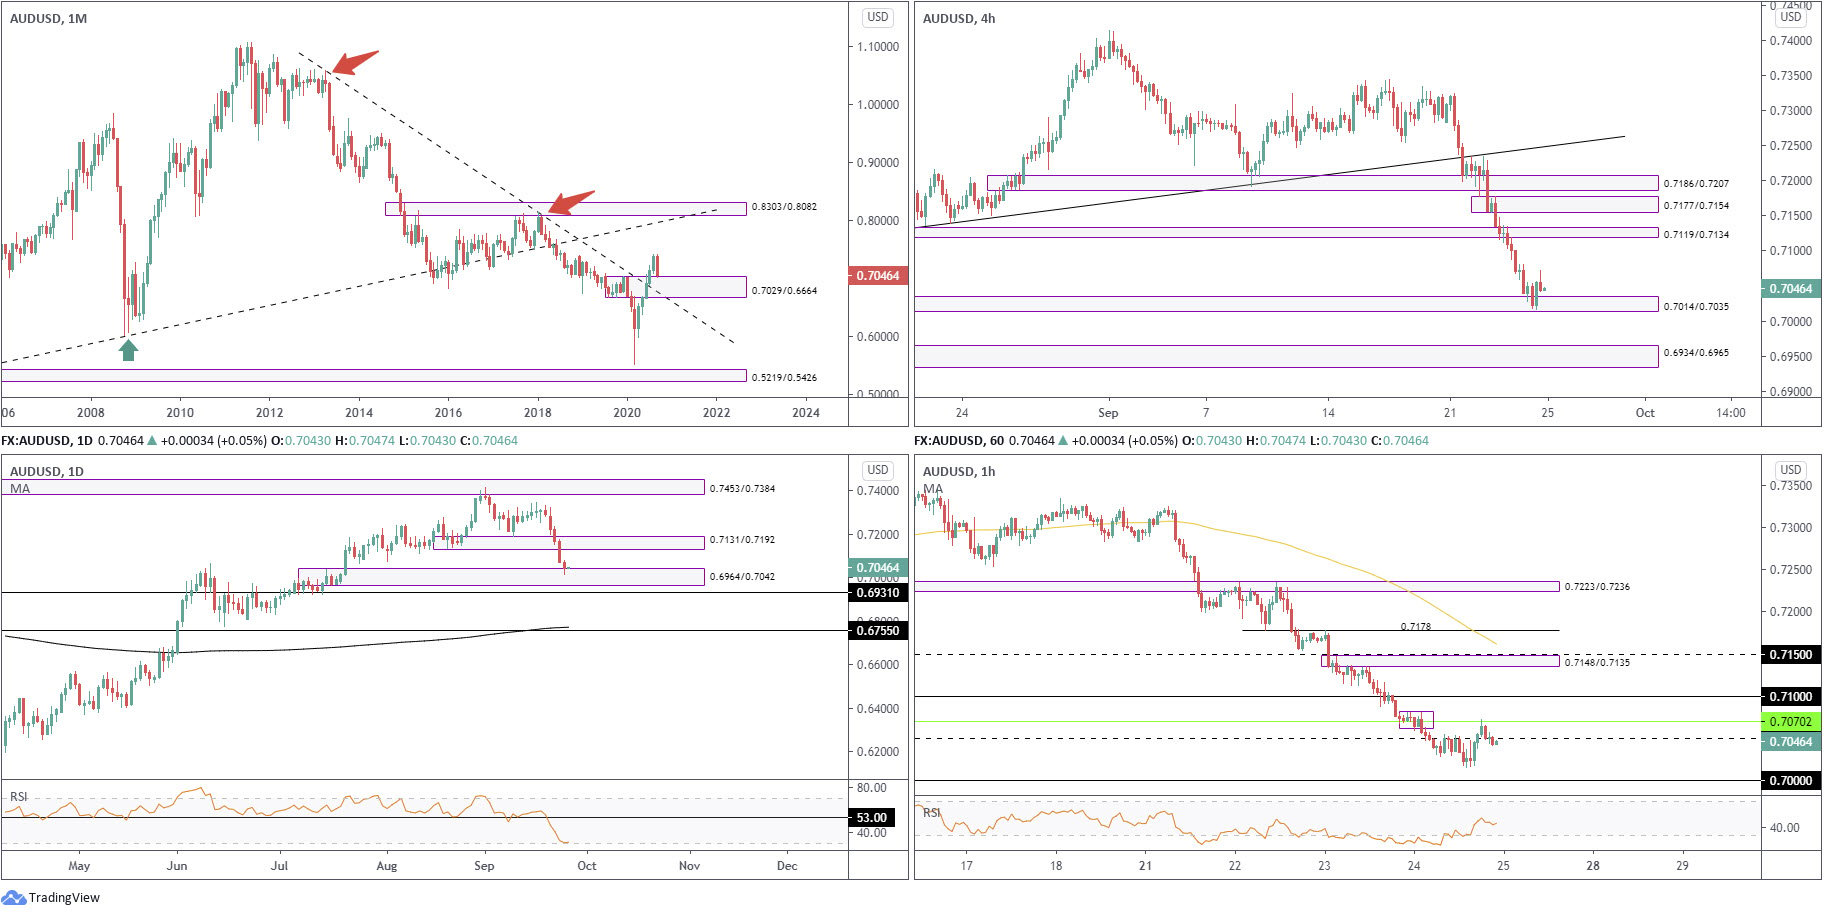
August’s 3.3% gain extended space north of supply at 0.7029/0.6664 and long-term trendline resistance (1.0582). Technically, buyers appear free to explore as far north as 0.8303/0.8082 in the coming months, a supply zone aligning closely with trendline resistance (prior support – 0.4776). The month of September, however, is on track to snap a five-month winning streak, with price currently down 4.5 percent and retesting 0.7029/0.6664 as demand.
While price has indeed removed trendline resistance and supply, traders might still want to take into account the primary downtrend (since mid-2011) remains south until breaking 0.8135 (January high [2018]).
Daily timeframe:
Partially altered from previous analysis –
AUD/USD pushed through a fifth successive daily loss on Thursday, extending space south of demand at 0.7131/0.7192 (a drop-base-rally area). Demand at 0.6964/0.7042 is now being addressed, plotted just ahead of support at 0.6931.
The trend, according to the daily timeframe, has emphasised a positive tone since bottoming in late March.
Traders may also recognise the RSI trades south of 53.00, a clear S/R level since October 2019, and currently hovers around oversold territory.
H4 timeframe:
Demand at 0.7014/0.7035 welcomed price on Thursday, stationed within the upper boundary of daily demand at 0.6964/0.7042.
Failure to preserve gains off the aforesaid demand could open the gates for a test of demand at 0.6934/0.6965, while rebounding from current demand may have upside test supply at 0.7119/0.7134 (prior demand).
H1 timeframe:
Bottoming around 0.7020 heading into US trade witnessed a one-sided move higher Thursday, taking the currency pair above 0.7050 resistance to greet resistance at 0.7070 (sharing space with supply around 0.7081/0.7059).
As you can see, 0.7070 proved stable, enough to direct moves back under 0.7050 into the close.
Structures of Interest:
Monthly price testing 0.7029/0.6664 as demand, along with daily and H4 price also testing demands at 0.6964/0.7042 and 0.7014/0.7035, respectively, echoes a bullish vibe heading into Friday.
As a result of the above, testing 0.70 on the H1 could draw in buyers, as could a H1 close above resistance at 0.7070.
USD/JPY:
Monthly timeframe:
(Technical change on this timeframe is often limited though serves as guidance to potential longer-term moves)
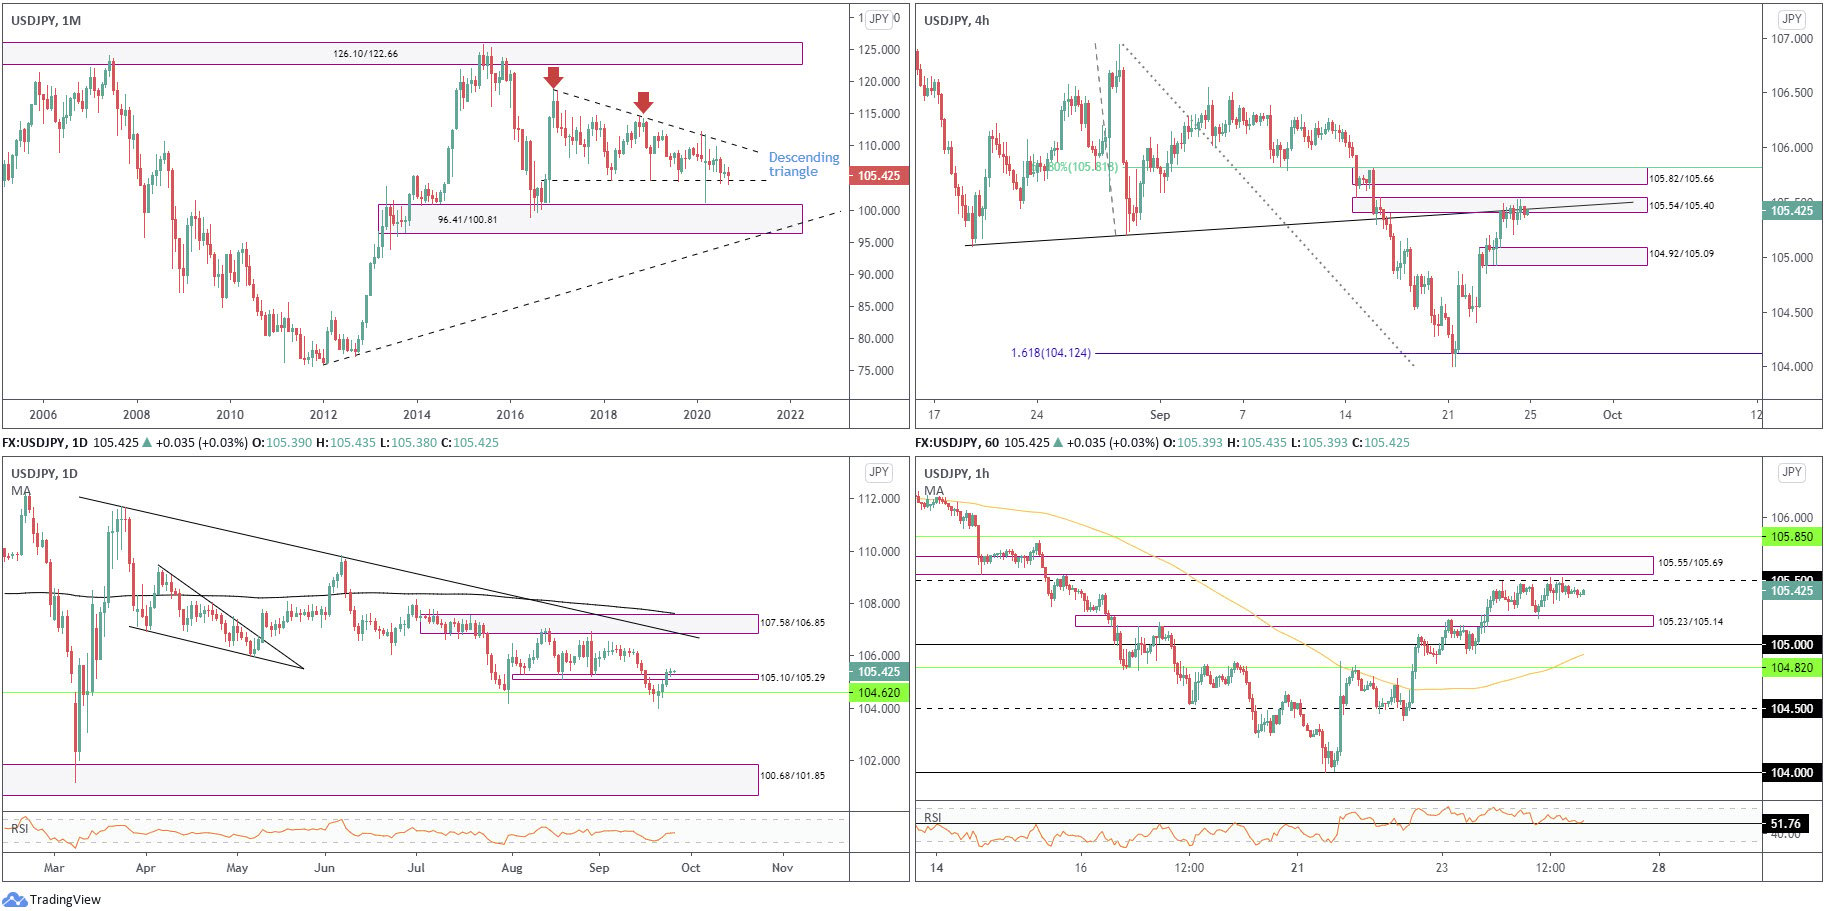
Since kicking off 2017, USD/JPY has been carving out a descending triangle pattern between 118.66/104.62. As you can see, price is currently testing the lower boundary of the aforesaid pattern.
Areas outside of the noted triangle can be seen at supply from 126.10/122.66 and demand coming in at 96.41/100.81.
Daily timeframe:
Brought forward from previous analysis –
Extending recovery gains off monthly support at 104.62 (the lower boundary of the monthly descending triangle) invites the possibility of further upside beyond supply at 105.10/105.29.
The RSI recently bottomed ahead of oversold levels and is now on track to test 50.00.
H4 timeframe:
Brought forward from previous analysis –
Early week staged an impressive recovery off a 161.8% Fib ext. level at 104.12. Recent action addressed supply at 105.54/105.40, an area sharing space with a trendline resistance (prior support – 105.10).
Other areas of interest on the H4 chart are supply at 105.82/105.66 and a 61.8% Fib level at 105.81. In addition, demand can be seen at 104.92/105.09, an area where the decision was made to initially push for current supply.
H1 timeframe:
105.23/105.14 offered stable intraday demand (prior supply) going into European trading on Thursday, lifting the currency pair to face 105.50 resistance (sheltered closely by a supply at 105.55/105.69 [prior demand]).
The RSI indicator continues to work with support at 51.70, rebounding price each time the value fades overbought space.
Structures of Interest:
Thursday’s analysis stated:
While the H4 supply at 105.54/105.40 intersects with trendline resistance, downside pressure from this region is unlikely to be anything to write home about. This is largely due to daily price recently upsetting supply at 105.10/105.29 off monthly support at 104.62 (lower base of the monthly descending triangle).
With that in mind, a retest at 105.23/105.14 (demand) on the H1 could be a setup that invites strong buying to potentially derail 105.50 resistance, and test supply at 105.55/105.69 (fastened to the lower edge of H4 supply at 105.82/105.66).
As you can see, 105.23/105.14 served H1 buyers well on Thursday.
Going forward, upside is likely to gain speed, though until H4 conquers supply at 105.82/105.66, active sellers will likely remain.
GBP/USD:
Monthly timeframe:
(Technical change on this timeframe is often limited though serves as guidance to potential longer-term moves)
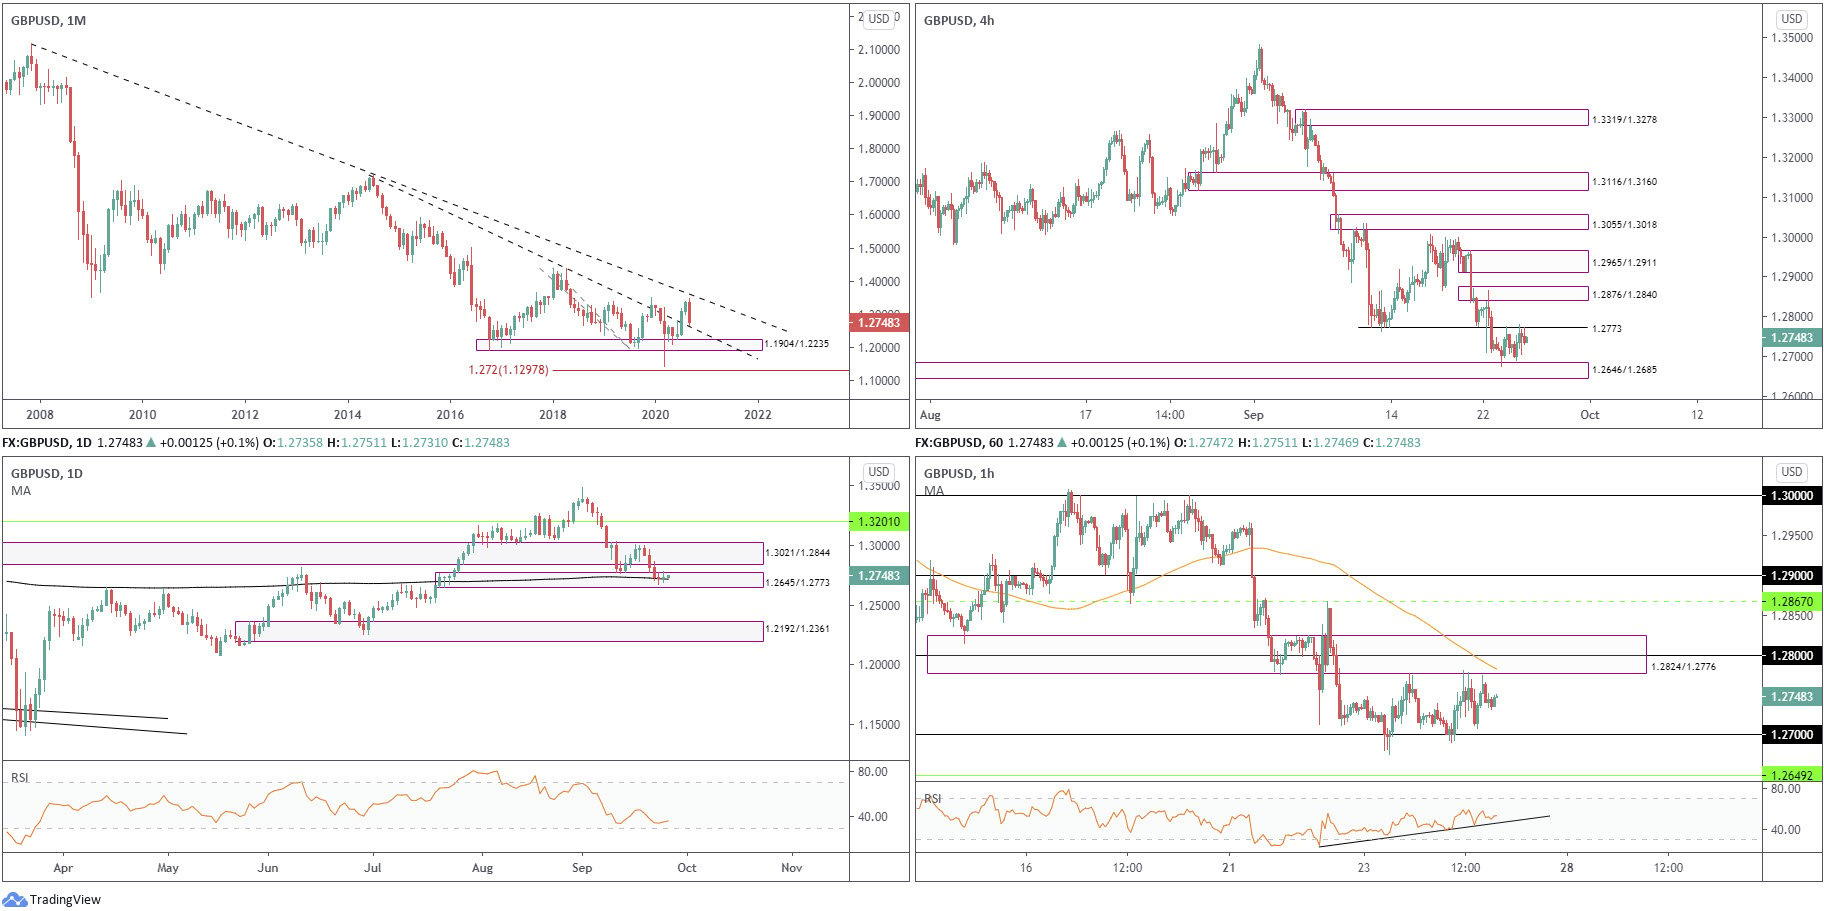
Leaving trendline resistance taken from 2.1161 unopposed, September currently trades lower by 4.6 percent, on track to retest trendline support (prior resistance – 1.7191).
Interestingly, the primary trend has faced lower since early 2008, unbroken until 1.4376 gives way – April 2 high 2018.
Daily timeframe:
Partially altered from previous analysis –
Despite three decisive bearish candles established out of supply at 1.3021/1.2844, Wednesday and Thursday exhibited a somewhat stationary bearing, with each session concluding unmoved.
Price, as you can see, engages with the 200-day simple moving average at 1.2717, stored inside demand at 1.2645/1.2773. Violating the aforesaid demand shines light on another demand placed at 1.2192/1.2361, an area that contained downside in late June.
The RSI indicator is currently drawing up a possible double-bottom pattern ahead of oversold space.
H4 timeframe:
Demand at 1.2646/1.2685, as stated in Wednesday’s analysis, accepted price action after support at 1.2742 (no longer applied to the chart) abandoned its position.
Although buyers continue to defend the aforesaid demand area, resistance at 1.2773 is proving a tough nut to crack. Should the pair eventually muster enough strength to conquer the noted level, however, supply at 1.2876/1.2840 is next on tap.
H1 timeframe:
Sterling enters Friday rangebound on the H1 timeframe between supply at 1.2824/1.2776 and the 1.27 level. Note the supply carries within it the 100-period SMA at 1.2782 and the 1.28 level. Outside of the current range, traders will be watching resistance at 1.2867 and support coming in from 1.2649.
It might also be worth noting the RSI oscillator has been trending northbound since bottoming at 25.00 on September 22.
Structures of Interest:
Buyers off 1.27, plotted just ahead of H4 demand at 1.2646/1.2685, are likely watching for H1 supply (1.2824/1.2776) to give way. However, breaking this area lands H4 price within striking distance of supply at 1.2876/1.2840. This implies buyers could be in for a hard time.
Recognising monthly price shows some room to push lower until testing trendline support (around 1.26ish), together with daily price struggling to print anything of meaning out of demand at 1.2645/1.2773, echoes a bearish vibe. Failure to overthrow H4 resistance at 1.2773 and H1 supply at 1.2824/1.2776, therefore, could see intraday flow probe beyond 1.27, with H1 support at 1.2649 targeted, followed by the 1.26 level. The latter represents a logical downside target for sellers and a potential reversal zone for buyers, given it connects with monthly trendline support.
DISCLAIMER:
The information contained in this material is intended for general advice only. It does not take into account your investment objectives, financial situation or particular needs. FP Markets has made every effort to ensure the accuracy of the information as at the date of publication. FP Markets does not give any warranty or representation as to the material. Examples included in this material are for illustrative purposes only. To the extent permitted by law, FP Markets and its employees shall not be liable for any loss or damage arising in any way (including by way of negligence) from or in connection with any information provided in or omitted from this material. Features of the FP Markets products including applicable fees and charges are outlined in the Product Disclosure Statements available from FP Markets website, www.fpmarkets.com and should be considered before deciding to deal in those products. Derivatives can be risky; losses can exceed your initial payment. FP Markets recommends that you seek independent advice. First Prudential Markets Pty Ltd trading as FP Markets ABN 16 112 600 281, Australian Financial Services License Number 286354.


 Access +10,000 financial
instruments
Access +10,000 financial
instruments