
EUR/USD:
Monthly timeframe:
(Technical change on this timeframe is often limited though serves as guidance to potential longer-term moves)
August saw the euro nudge to a fourth successive monthly gain against the US dollar, adding nearly 1.5 percent. The move toppled supply from 1.1857/1.1352 and extended space north of long-term trendline resistance (1.6038), arguing additional upside may be on the horizon, targeting trendline resistance (prior support – 1.1641). Despite this, the primary downtrend (since July 2008) remains intact until 1.2555 is engulfed (Feb 1 high [2018]).
Trading in September is down more than 1 percent.
Daily timeframe:
Partially altered from previous analysis –
Price remains contained within the parapets of a rising channel pattern (1.1695/1.1909), and is also hampered by supply at 1.2012/1.1937, extended from May 2018. Recently, the pair probed beneath trendline support (1.0774), an ascending line that assisted last week’s modest recovery from the aforesaid channel support.
Based on the daily timeframe, trend traders will note that in conjunction with monthly price violating long-term structure, EUR/USD has trended higher since late March. With respect to the RSI indicator, we remain within a (near) two-month descending channel formation.
H4 timeframe:
Demand stationed at 1.1794/1.1833 came under fire late Wednesday, shining light on two trendline supports (1.1965/1.1185), as well as support at 1.1753. The area coloured pink offers interesting confluence.
H1 timeframe:
Wednesday’s losses swung H1 candles into an interesting area of harmonic support: a bullish Gartley formation (confirmed by RSI hidden bullish divergence), made up of a 78.6% Fib level at 1.1788, AB=CD support also at 1.1788 and a 1.27 BC projection from 1.1782. Price, as you can see, is trying to topple 1.18 resistance. If successful, follow-through buying is likely to reach for supply at 1.1841/1.1827 (prior demand).
Structures of Interest:
The monthly timeframe suggests buyers could push beyond supply at 1.1857/1.1352, though daily price is seen exploring space beyond trendline support.
Intraday (H1), however, exhibits scope to attack supply at 1.1841/1.1827 after testing a harmonic bullish Gartley pattern.

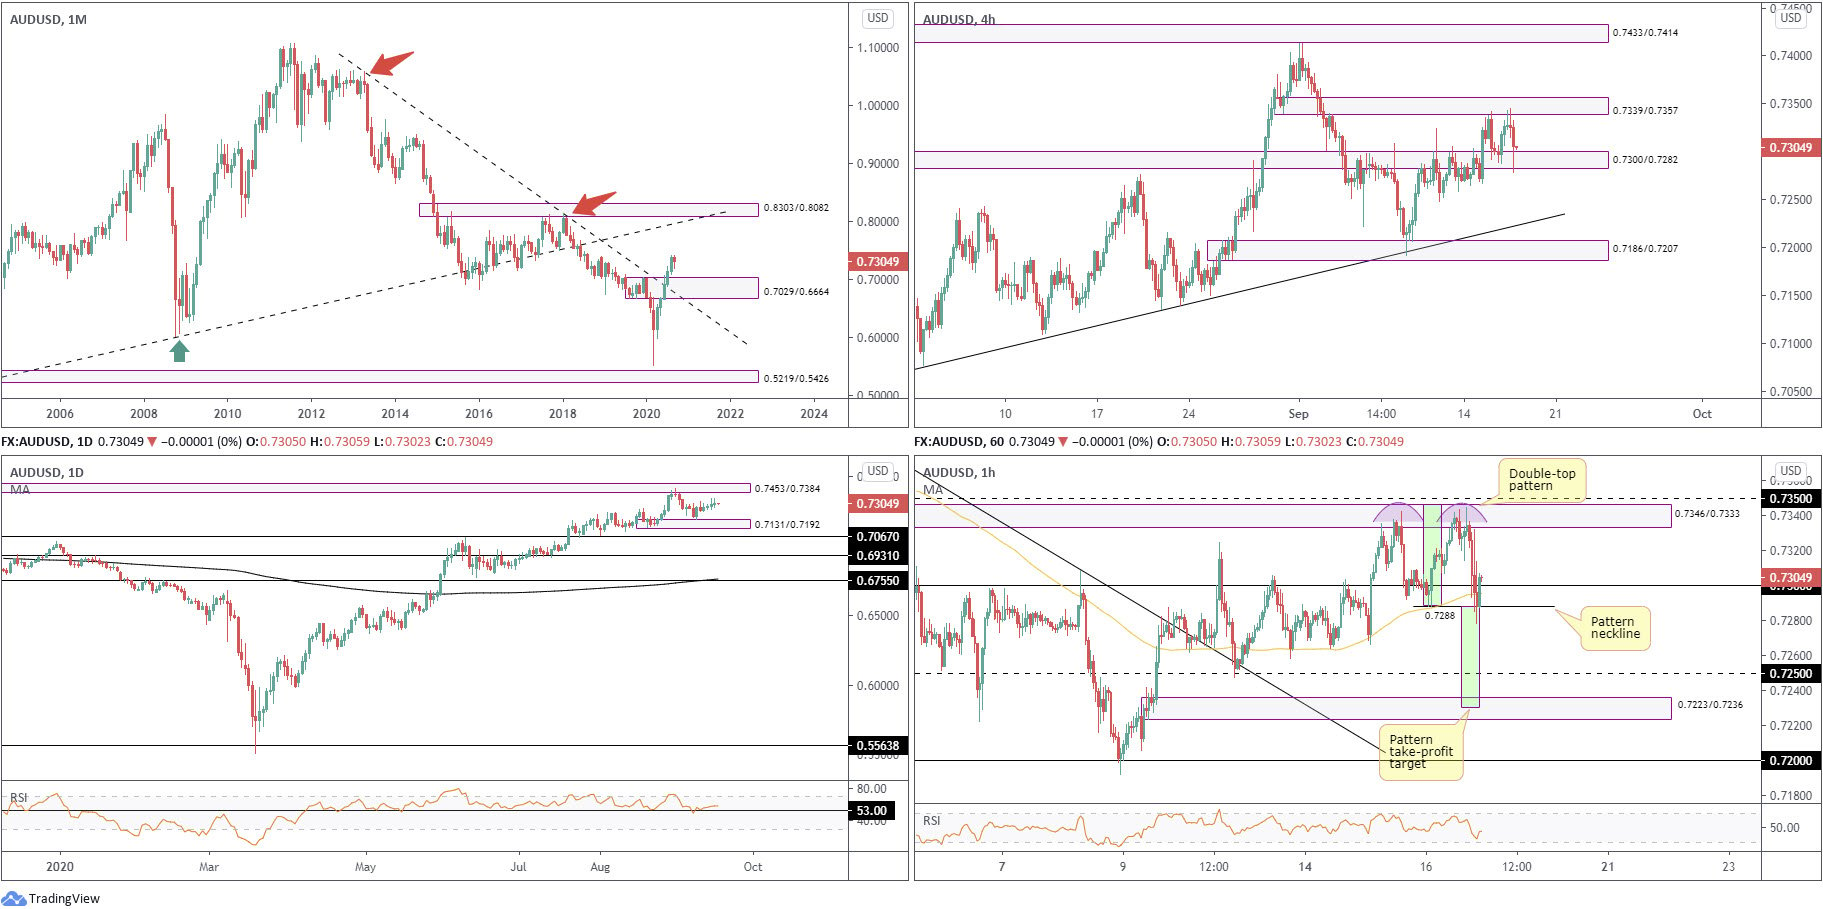
AUD/USD:
Monthly timeframe:
(Technical change on this timeframe is often limited though serves as guidance to potential longer-term moves)
July’s rally, coupled with August’s 3.3% follow-through, witnessed supply at 0.7029/0.6664 and intersecting long-term trendline resistance (1.0582) abandon its position. Technically, buyers appear free to explore as far north as 0.8303/0.8082 in the coming months, a supply zone aligning closely with trendline resistance (prior support – 0.4776).
While price has indeed removed trendline resistance and supply, traders might still want to take into account the primary downtrend (since mid-2011) remains south until breaking 0.8135 (January high [2018]).
Daily timeframe:
Partially altered from previous analysis –
In recent sessions, AUD/USD finished off best levels in between demand at 0.7131/0.7192 (a drop-base-rally area) and supply at 0.7453/0.7384, an area which recently capped YTD peaks at 0.7413.
Support at 0.7067 is seen should we push through the aforesaid demand.
The trend, according to the daily timeframe, has emphasised a positive tone since bottoming in late March.
Indicator-based traders may also recognise the RSI holds support at 53.00, a clear S/R level since October 2019.
H4 timeframe:
Partially altered from previous analysis –
After supply at 0.7300/0.7282 relinquished ground Tuesday, allowing for price to greet supply at 0.7339/0.7357, the two areas have since formed a consolidation as the former held as demand.
Removing current demand calls for a reconnection with trendline support (0.7076) and demand at 0.7186/0.7207 (fixed to the upper edge of daily demand at 0.7131/0.7192). A reaction to the upside, on the other hand, may eventually cross paths with supply at 0.7433/0.7414 (inhabits daily supply at 0.7453/0.7384).
H1 timeframe:
As shown on the H1 timeframe, Wednesday’s movement generated a double-top pattern at 0.7342, sheltered within a supply zone at 0.7346/0.7333 (glued to the underside of daily supply at 0.7339/0.7357). The neckline at 0.7288 has been tested, though the pair has failed to close beneath the level. The take-profit target, should a close lower form, can be seen within demand at 0.7223/0.7236, around 0.7230 (green rectangles).
Structures of Interest:
- Monthly action forecasts further buying over the coming months to 0.8303/0.8082.
- Daily reveals supply at 0.7453/0.7384 and demand at 0.7131/0.7192.
- H4 is currently rangebound between 0.7300/0.7282 and 0.7339/0.7357.
- H1 reveals a possible double-top configuration. If the neckline breaks at 0.7288, whipsawing through 0.7250 support to test demand at 0.7223/0.7236 could be seen.
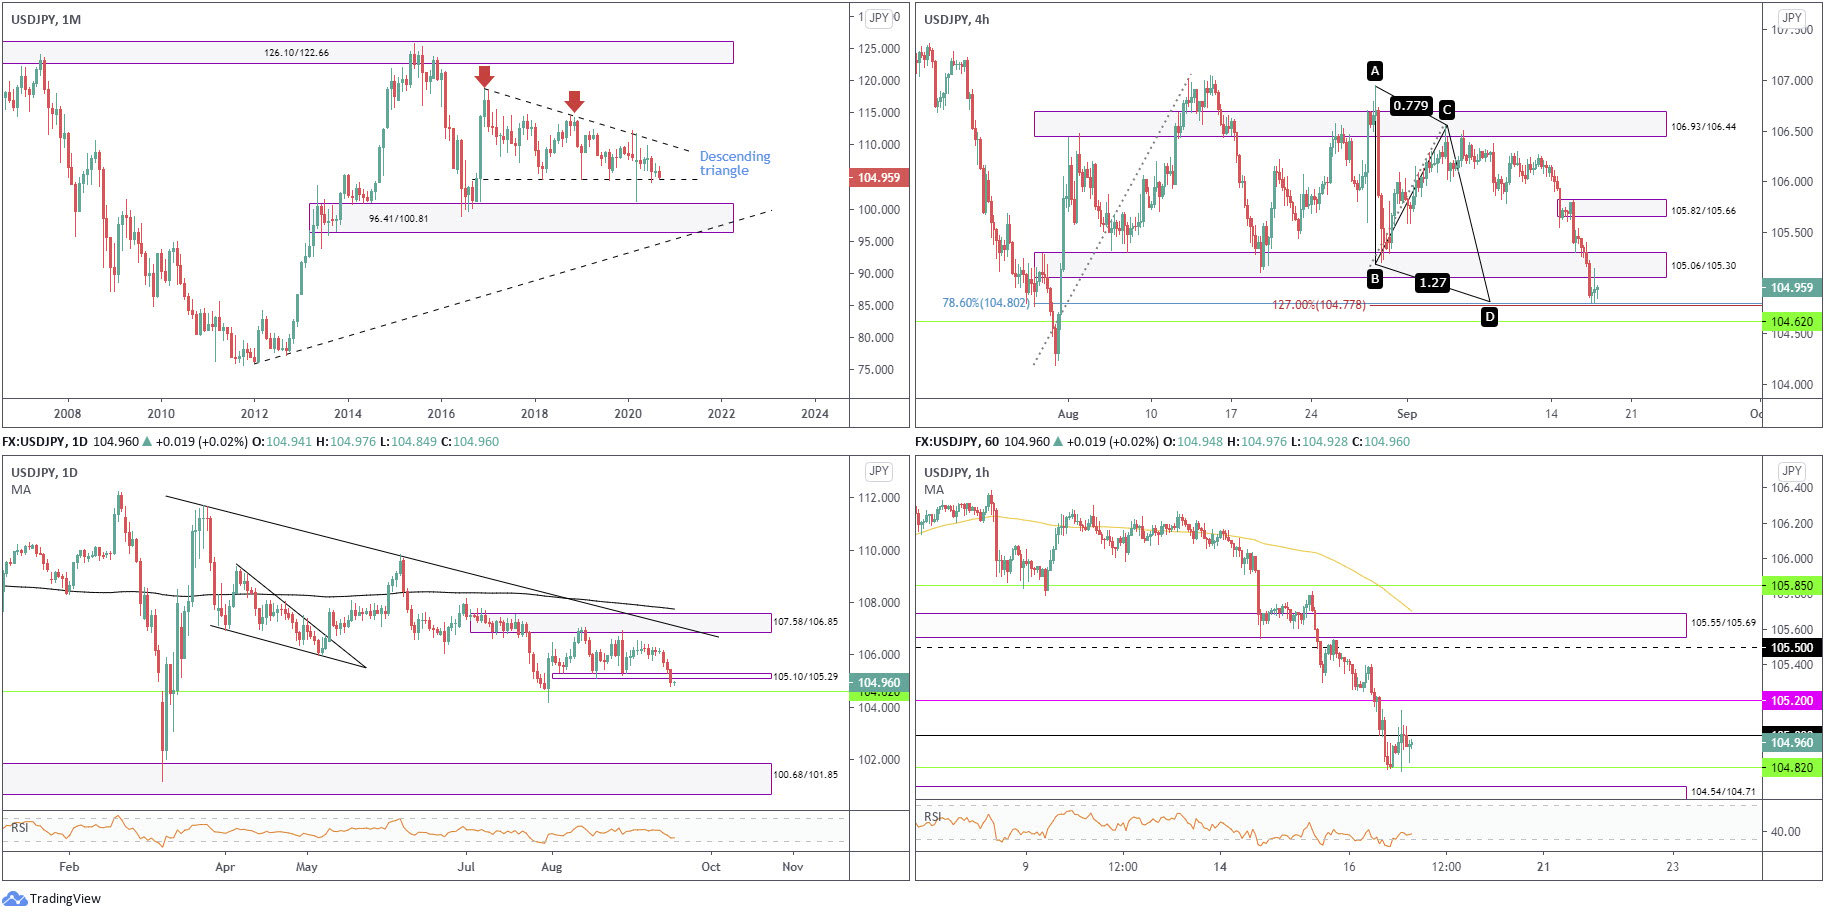
USD/JPY:
Monthly timeframe:
(Technical change on this timeframe is often limited though serves as guidance to potential longer-term moves)
Since kicking off 2017, USD/JPY has been carving out a descending triangle pattern between 118.66/104.62. As you can see, though, price is closing in on the lower boundary of the aforesaid pattern.
Areas outside of the noted triangle can be seen at supply from 126.10/122.66 and demand coming in at 96.41/100.81.
Daily timeframe:
Supply from 107.58/106.85 proved a tough nut to crack in August, an area demonstrating a close connection with trendline resistance from 111.71.
Recording a third successive daily loss Wednesday positions the pair south of support at 105.10/105.29, and within a stone’s throw from monthly support at 104.62.
With reference to the RSI, the value is pointing south, heading for oversold space.
H4 timeframe:
USD/JPY challenged demand at 105.06/105.30 (prior supply) Wednesday, with the decline cutting through its range and testing ABCD support around a 78.6% Fib level at 104.80. This, as you can see, is positioned just ahead of monthly support at 104.62.
H1 timeframe:
Wednesday’s decline worked through 105 and crossed paths with support at 104.82. The latter has so far served well, prompting a 105 retest, which also held.
Above 105, eyes are likely on 105.20 resistance, while dips south of 104.82 may land at demand from 104.54/104.71.
The RSI oscillator is still seen struggling to secure position out of oversold territory.
Structures of Interest:
Between monthly support at 104.62 and H4 support at 104.80, bullish signals may be found. Note 104.62 inhabits H1 demand at 104.54/104.71, therefore a test of this area could come to fruition.
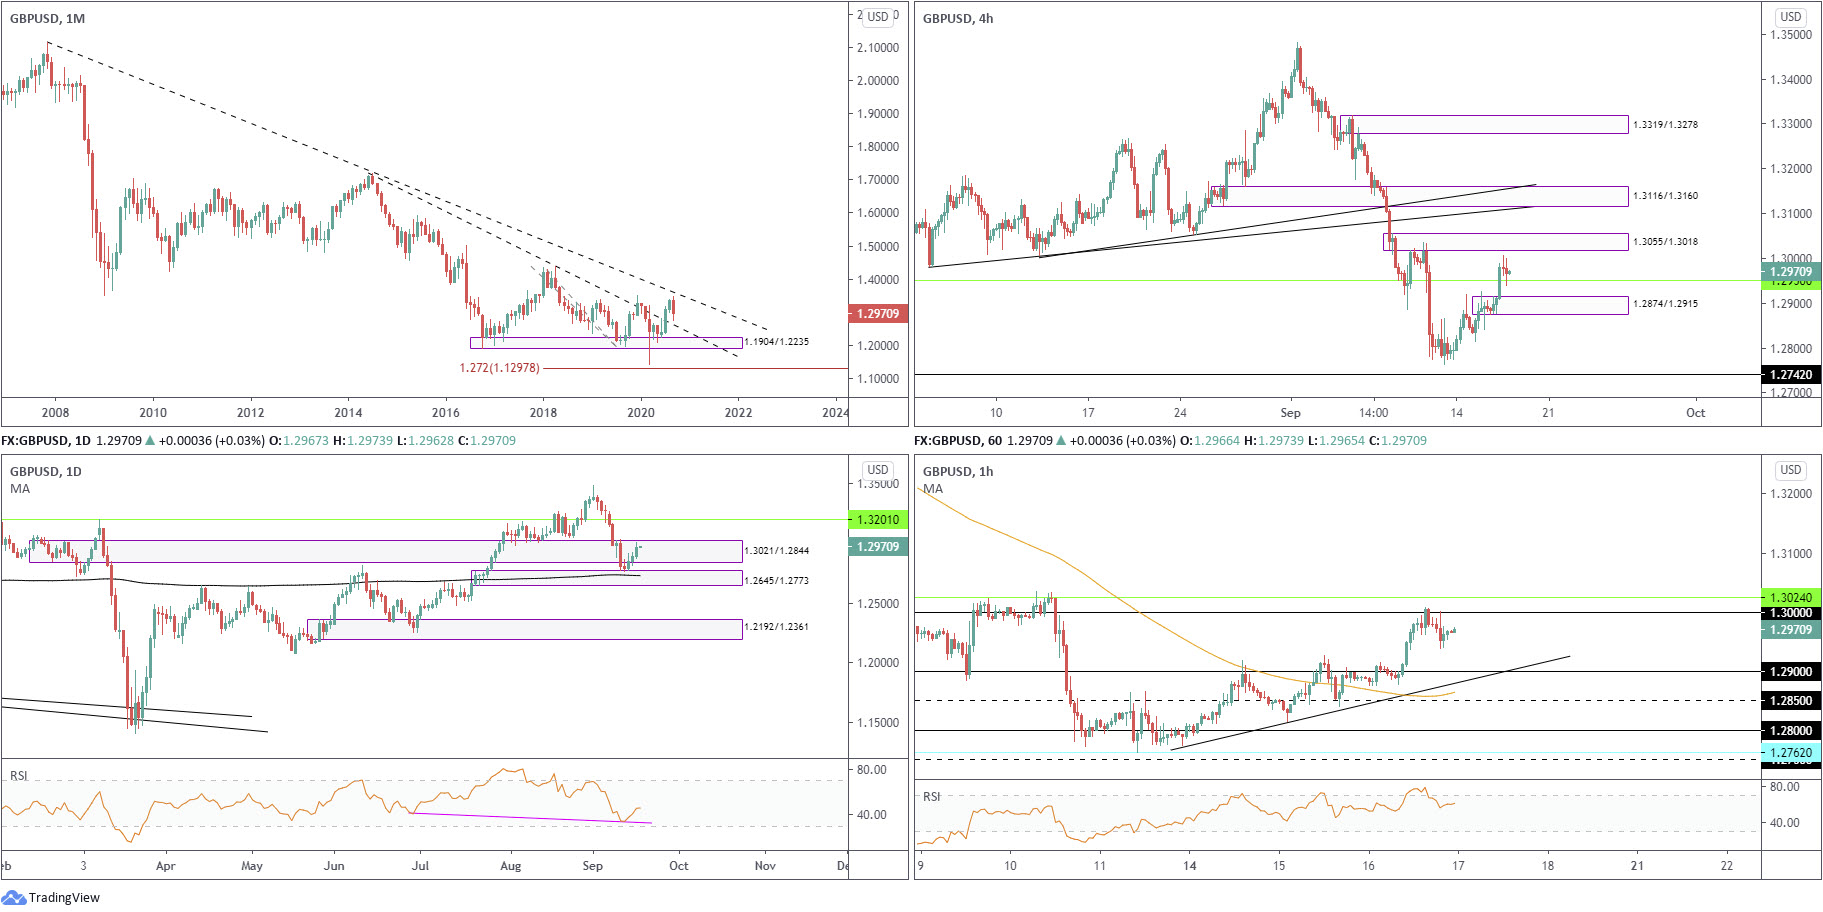
GBP/USD:
Monthly timeframe:
(Technical change on this timeframe is often limited though serves as guidance to potential longer-term moves)
Leaving trendline resistance taken from 2.1161 unopposed, September currently trades lower by 3 percent, on track to retest trendline support (prior resistance – 1.7191).
Interestingly, the primary trend has faced lower since early 2008, unbroken until 1.4376 gives way – April 2 high 2018.
Daily timeframe:
The recovery from demand at 1.2645/1.2773 (houses the 200-day simple moving average at 1.2730) is proving notable, registering a third successive daily gain yesterday and generating enough impetus for price to explore the upper range of nearby supply at 1.3021/1.2844. Breaching here throws light on resistance at 1.3201.
The RSI indicator also recently bottomed ahead of oversold territory and shaped hidden bullish divergence. The value now trades within close proximity of 50.00.
H4 timeframe:
Although we left support at 1.2742 behind at the beginning of the week, GBP/USD bulls have stressed a moderately bullish tone. Upside established fresh demand at 1.2874/1.2915 and subsequently dethroned resistance at 1.2950 to highlight supply at 1.3055/1.3018.
H1 timeframe:
Heading into the US session Wednesday saw intraday flow welcome the widely watched 1.30 level, a hurdle located just ahead of resistance at 1.3024.
Sellers hold things lower as we move into Asian trading, signalling moves to 1.29 could come about, which happens to intersect with trendline support (1.2773).
In addition to the above, the RSI exited overbought territory and currently trades at 61.00.
Structures of Interest:
Monthly price suggests we could be heading for further losses until around 1.26 (monthly trendline support).
Daily price is seen navigating the upper levels of supply at 1.3021/1.2844.
H4 holds the 1.2950 support retest, while H1 suggests further declines south of 1.30 to 1.29.
With monthly demonstrating room to move lower and daily trading within supply, as well as H1 coming off 1.30, 1.2950 support on the H4 may struggle today.
Aside from possible selling emerging from current price, another potential scenario worth noting is a whipsaw above 1.30 to test H1 resistance at 1.3024 and H4 supply from 1.3055/1.3018, an area sellers may look to defend.
DISCLAIMER:
The information contained in this material is intended for general advice only. It does not take into account your investment objectives, financial situation or particular needs. FP Markets has made every effort to ensure the accuracy of the information as at the date of publication. FP Markets does not give any warranty or representation as to the material. Examples included in this material are for illustrative purposes only. To the extent permitted by law, FP Markets and its employees shall not be liable for any loss or damage arising in any way (including by way of negligence) from or in connection with any information provided in or omitted from this material. Features of the FP Markets products including applicable fees and charges are outlined in the Product Disclosure Statements available from FP Markets website, www.fpmarkets.com and should be considered before deciding to deal in those products. Derivatives can be risky; losses can exceed your initial payment. FP Markets recommends that you seek independent advice. First Prudential Markets Pty Ltd trading as FP Markets ABN 16 112 600 281, Australian Financial Services License Number 286354.


 Access +10,000 financial
instruments
Access +10,000 financial
instruments