EUR/USD:
Monthly timeframe:
(Technical change on this timeframe is often limited though serves as guidance to potential longer-term moves)
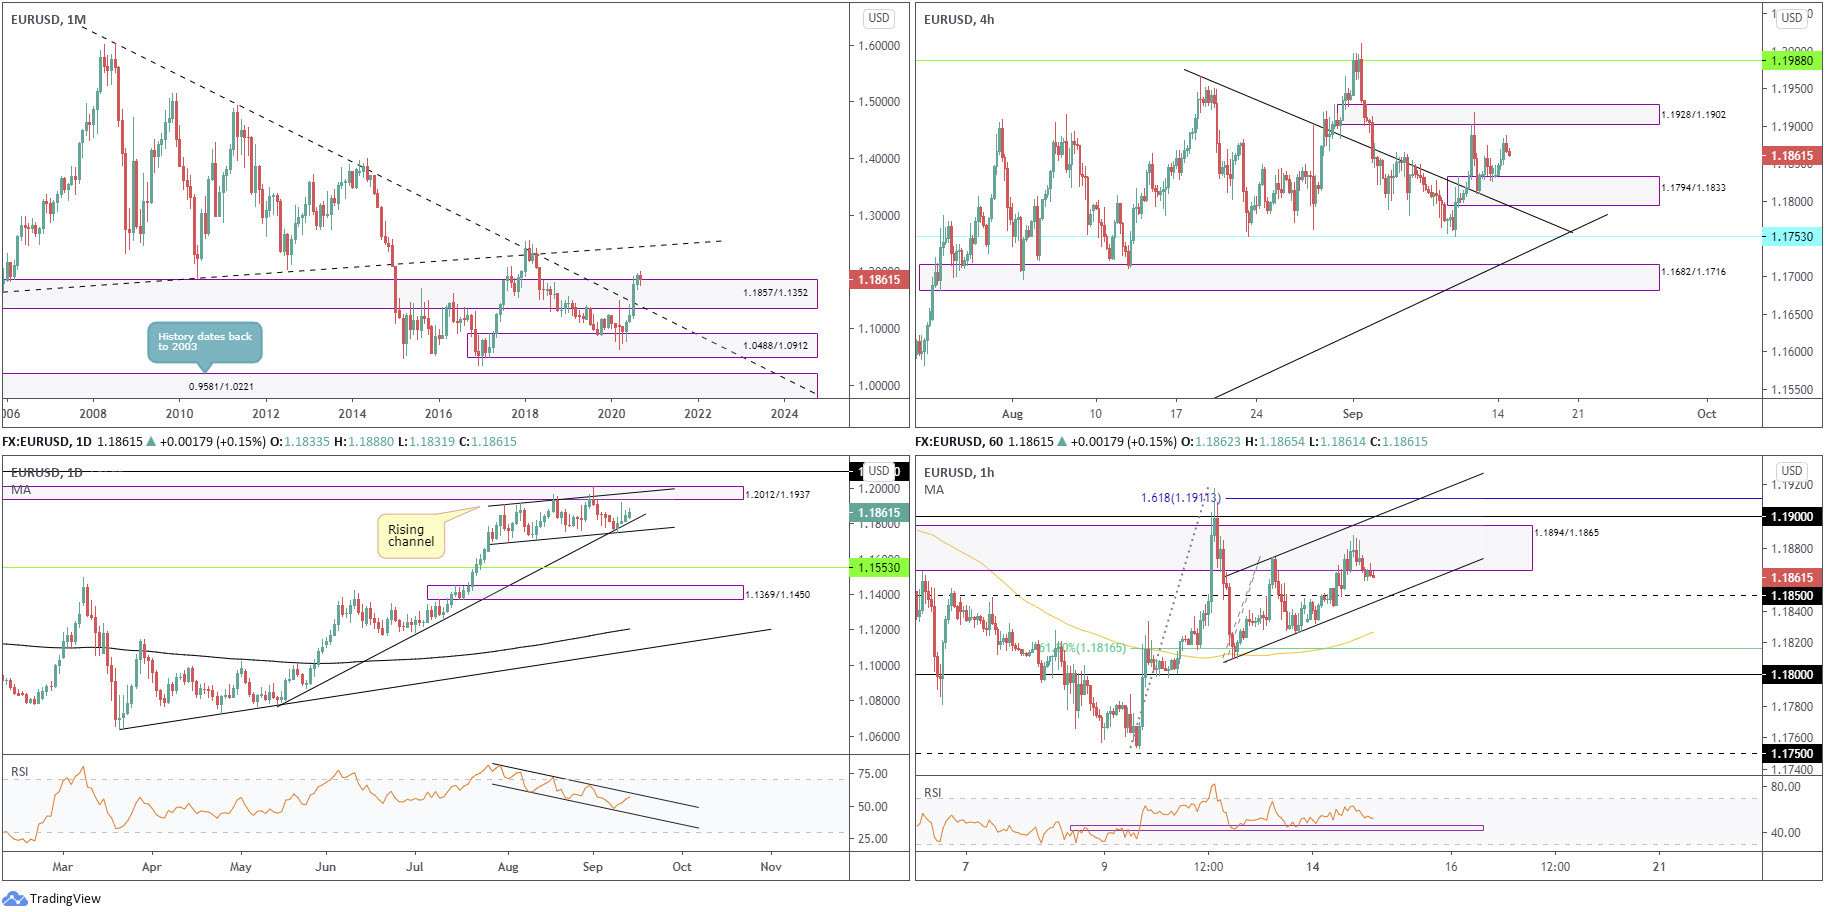
August saw the euro nudge to a fourth successive monthly gain against the US dollar, adding nearly 1.5 percent. The move toppled supply from 1.1857/1.1352 and extended space north of long-term trendline resistance (1.6038), arguing additional upside may be on the horizon, targeting trendline resistance (prior support – 1.1641). Despite this, the primary downtrend (since July 2008) remains intact until 1.2555 is engulfed (Feb 1 high [2018]).
Daily timeframe:
Partially altered from previous analysis –
Efforts to extend higher remain contained within the parapets of a rising channel pattern (1.1695/1.1909), in addition to supply at 1.2012/1.1937 making an entrance on August 18, extended from May 2018. Recent trade witnessed a recovery form from the aforesaid channel support, aided by trendline support (1.0774).
Based on the daily timeframe, trend traders will note that alongside monthly price violating long-term structure, EUR/USD has trended higher since late March. With respect to the RSI indicator, we crossed back above 50.00 last week, rebounding from a month-long channel support with the value now poised to retest channel resistance.
H4 timeframe:
Partially altered from previous analysis –
Demand stationed at 1.1794/1.1833 upheld position on Monday, delivering modest upside to peaks at 1.1887. The demand represents a reasonably significant zone, a rally-base-rally area where a decision was made to break the 1.1865 September 4 peak.
Supply at 1.1928/1.1902 could welcome the pair again this week, an area that withstood a decisive upside attempt Thursday.
Trendline support (prior resistance – 1.1965) and support at 1.1753 are next to come under fire should sellers push for control; above current supply, resistance at 1.1988 will likely be monitored.
H1 timeframe:
Asian trading and the majority of the European session Monday observed mild upside, drilling into a relatively long-standing supply zone at 1.1894/1.1865. Heading into the US session, a collection of clear selling wicks appeared within the aforesaid supply, generating a modest pullback and threatening a possible 1.1850 retest (joins with channel support [1.1810]).
In terms of where we stand on the RSI indicator, a clear support/resistance zone remains around 45.00.
Structures of Interest:
The monthly timeframe suggesting buyers could push beyond supply at 1.1857/1.1352, together with the daily timeframe demonstrating room to the upside, could guide H4 candles into supply at 1.1928/1.1902 today (positioned just ahead of daily supply at 1.2012/1.1937).
The above indicates a 1.1850 retest on the H1 could be in store, a level that may contain enough fuel to prompt bullish strategies.
AUD/USD:
Monthly timeframe:
(Technical change on this timeframe is often limited though serves as guidance to potential longer-term moves)
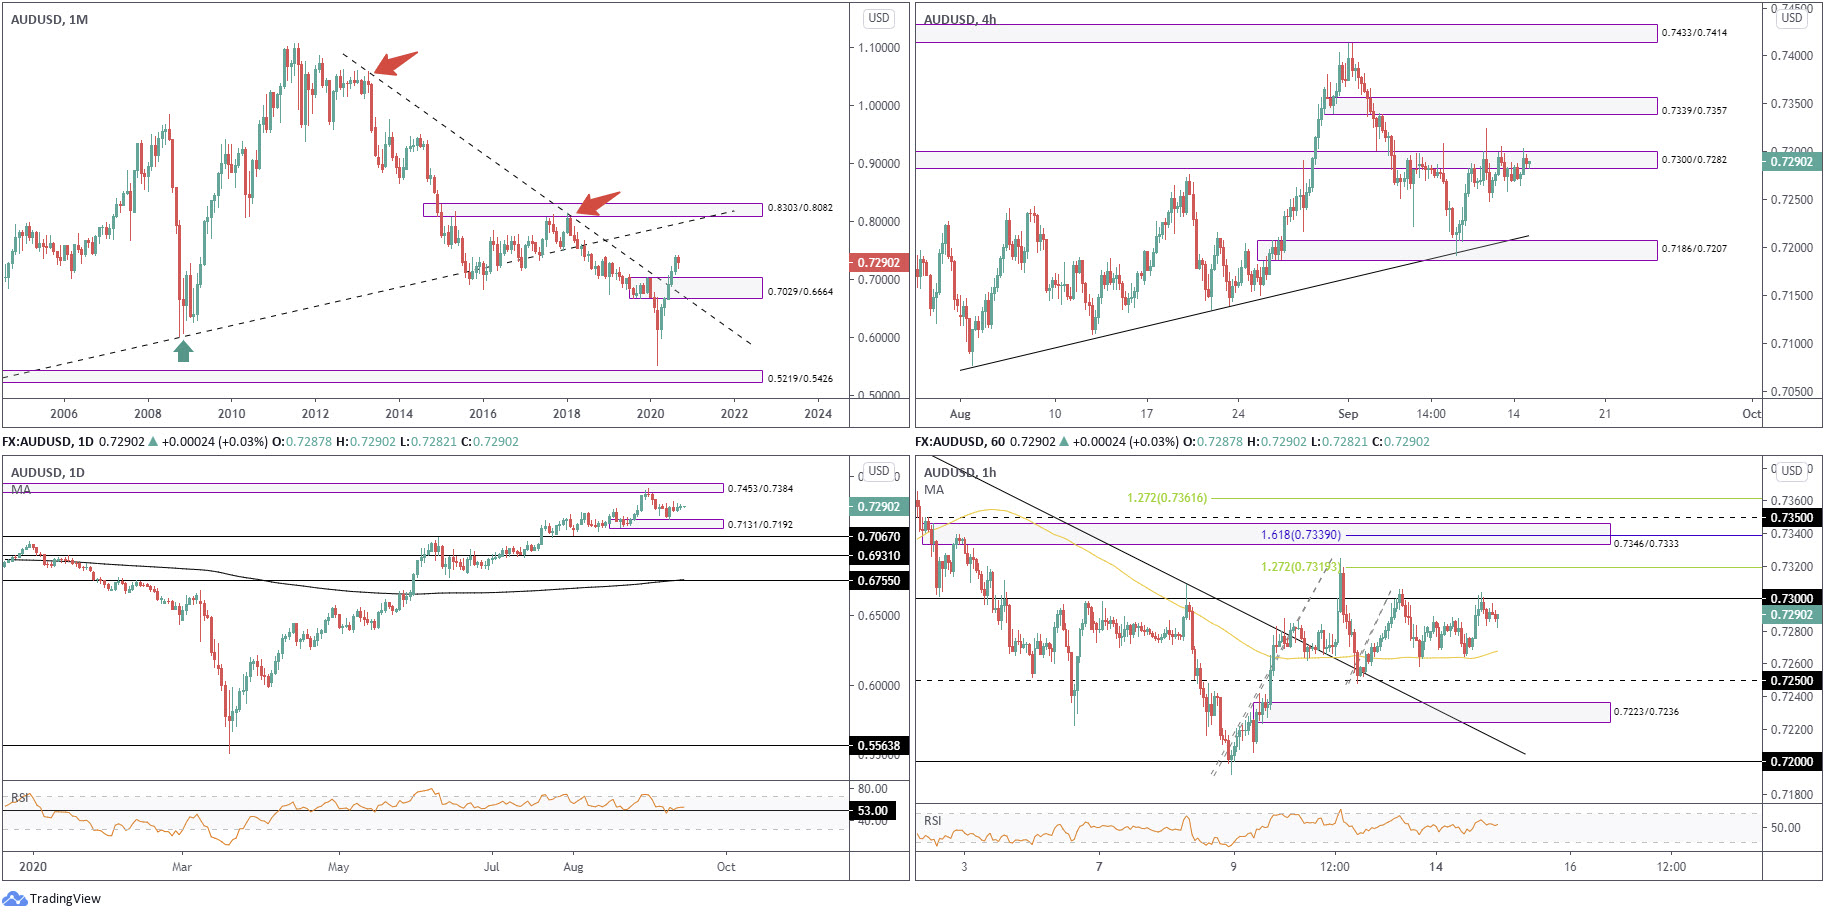
July’s rally, coupled with August’s 3.3% follow-through, witnessed supply at 0.7029/0.6664 and intersecting long-term trendline resistance (1.0582) abandon its position. Technically, buyers appear free to explore as far north as 0.8303/0.8082 in the coming months, a supply zone aligning closely with trendline resistance (prior support – 0.4776).
While price has indeed removed trendline resistance and supply, traders might still want to take into account the primary downtrend (since mid-2011) remains south until breaking 0.8135 (January high [2018]).
Daily timeframe:
Brought forward from previous analysis –
- Demand at 0.7131/0.7192 (a drop-base-rally area) remains in play.
- Support at 0.7067 is seen should we push through the aforesaid demand.
- Supply at 0.7453/0.7384 can be found to the upside, an area which recently capped YTD peaks at 0.7413.
- The trend, according to the daily timeframe, has emphasised a positive tone since bottoming in late March.
- Indicator-based traders may also recognise the RSI holds support at 53.00, a clear S/R level since October 2019.
H4 timeframe:
Brought forward from previous analysis –
Supply at 0.7300/0.7282 did a superb job in holding back buyers last week.
Trendline support (0.7076) and demand at 0.7186/0.7207 also came together earlier last week, providing a stage for buyers to advance from.
Removing supply throws light on supply at 0.7339/0.7357, a prior demand zone; dipping to lower levels calls for a reconnection with the aforesaid trendline and demand.
H1 timeframe:
The 100-period simple moving average veered into sight Monday, offering support during London’s morning session. The DXY dipping into territory sub 93.00, elevated AUD/USD to 0.73, a level that’s hindered upside since the beginning of September.
A push higher throws light on last Thursday’s pinnacle at 0.7324, uniting closely with a 127.2% Fib ext. level at 0.7319. Additional moves possibly pull in supply at 0.7346/0.7333, a range holding a 161.8% Fib ext. level at 0.7339. Dropping lower points to a retest at the 100-period simple moving average or possibly 0.7250 support.
Structures of Interest:
Monthly action forecasts further buying over the coming months to 0.8303/0.8082. Daily price proposes AUD/USD may push for supply at 0.7453/0.7384, should demand at 0.7131/0.7192 hold. Dips could find 0.7067 support.
H4 is finding it difficult to topple supply from 0.7300/0.7282, yet having seen the lack of selling pressure emerge from here recently indicates buyers may take over. H1 is seen fading the 0.73 resistance. Overrunning the latter, a potential move given the higher timeframes, sparks possible buying to H1 supply at 0.7346/0.7333 (fastened to the underside of H4 supply at 0.7339/0.7357).
USD/JPY:
Monthly timeframe:
(Technical change on this timeframe is often limited though serves as guidance to potential longer-term moves)
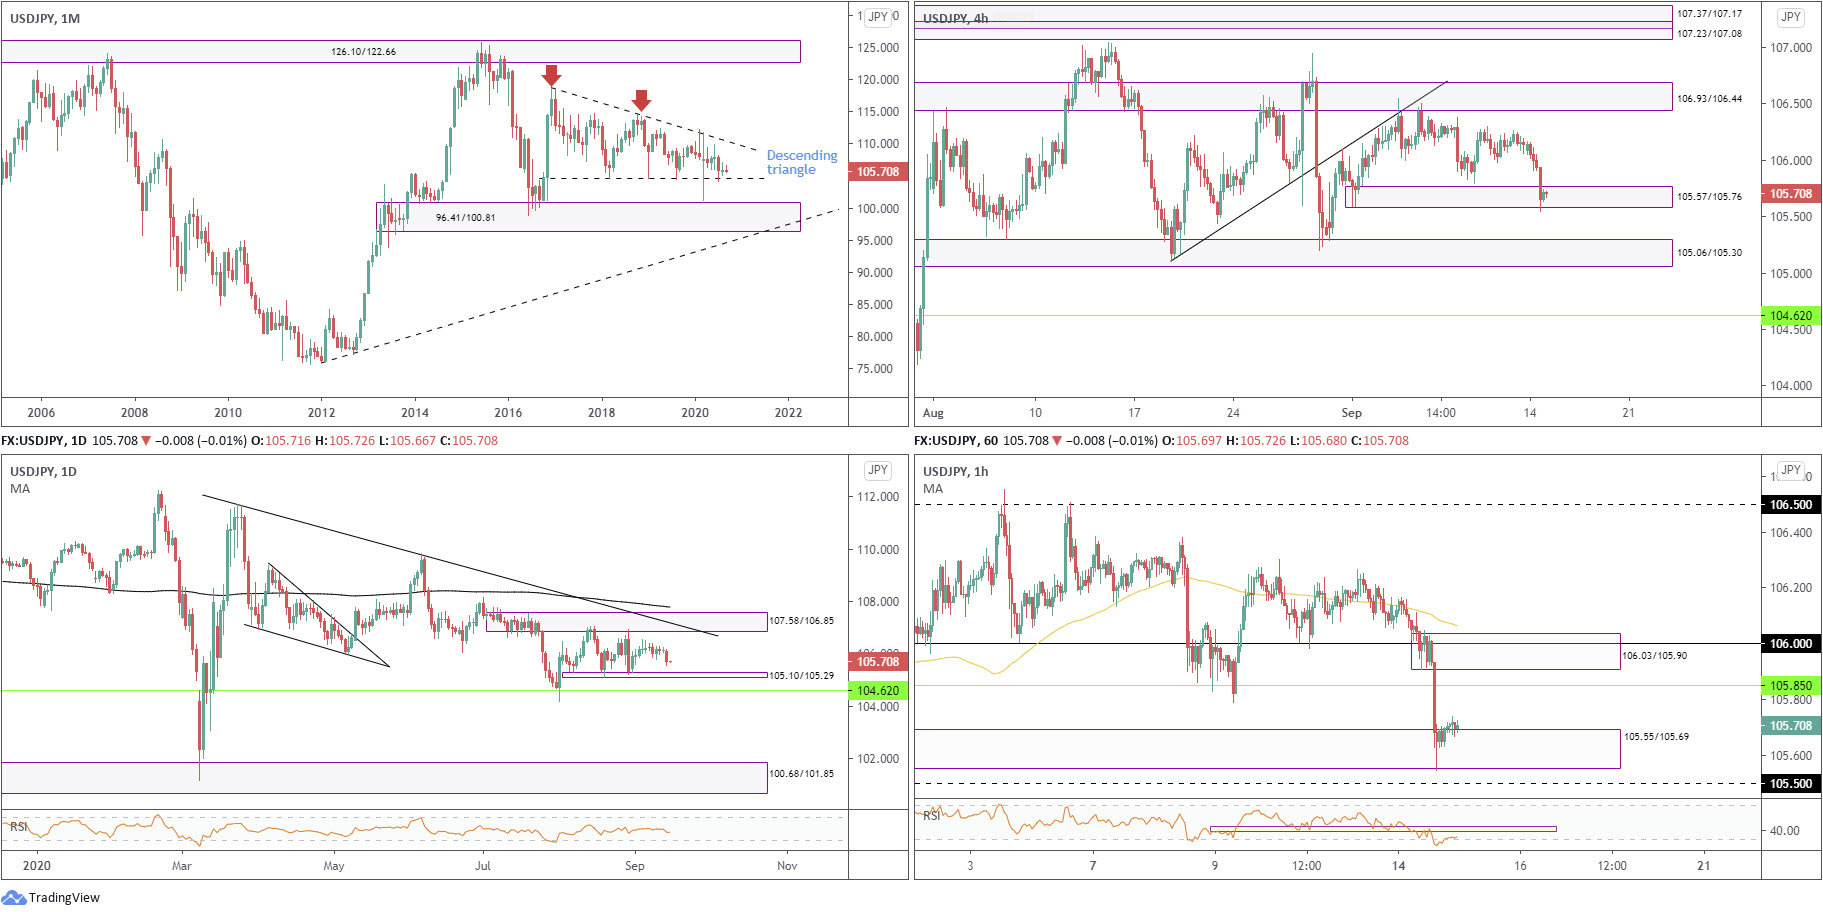
Since kicking off 2017, USD/JPY has been carving out a descending triangle pattern between 118.66/104.62. July sunk nearly 2 percent, testing the lower boundary of the descending triangle, while August ended off best levels, effectively unmoved.
Areas outside of the noted triangle can be seen at supply from 126.10/122.66 and demand coming in at 96.41/100.81.
Daily timeframe:
Supply from 107.58/106.85 proved a tough nut to crack in August, an area demonstrating a close connection with trendline resistance from 111.71. The aforesaid areas, alongside a narrow support area at 105.10/105.29, has carved out an active range.
Outside of the consolidation, the 200-day simple moving average is seen at 107.79, and the monthly support at 104.62.
With reference to the RSI, we still remain pretty neutral right now, though we did marginally nudge under 50.00 in recent trading.
H4 timeframe:
USD/JPY traded on the backfoot Monday, potentially weighed by the DXY also pursuing deeper water. The session concluded clipping the lower base of demand at 105.57/105.76, projecting sellers may reach for demand at 105.06/105.30 (prior supply).
H1 timeframe:
Demand at 105.55/105.69 had its entire range tested Monday, located just ahead of 105.50 support. With buyers potentially weak here, a retest at resistance from 105.85 may unfold. Supply awaits at 106.03/105.90 should buyers reach higher (holds 106 within).
The RSI support/resistance zone at around 43.00 was retested as resistance yesterday, with the value currently attempting to exit oversold terrain, as we write.
Structures of Interest:
Longer term, we are still holding monthly support at 104.62, while daily flow consolidates between support from 105.10/105.29 and supply at 107.58/106.85.
H4 demand at 105.57/105.76 recently gave way, indicating a bearish tone. This, together with H1 demand at 105.55/105.69 having its range tested, signals any recovery may be considered a sell signal, particularly from H1 resistance at 105.85 and H1 supply at 106.03/105.90.
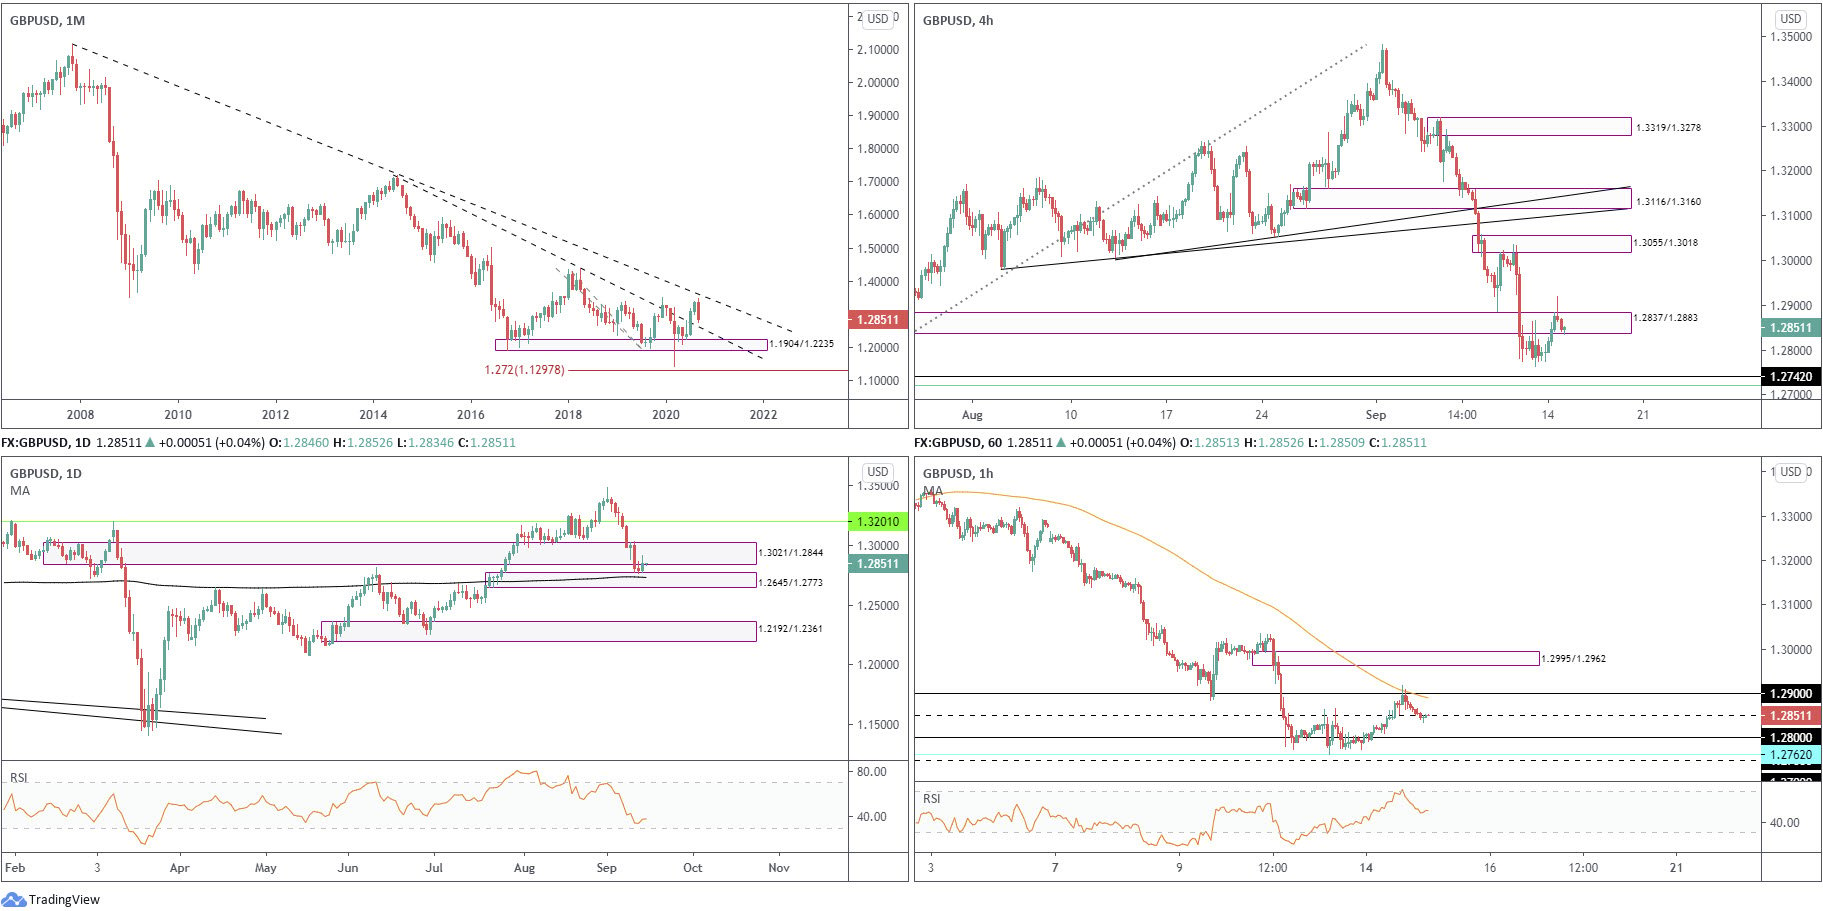
GBP/USD:
Monthly timeframe:
(Technical change on this timeframe is often limited though serves as guidance to potential longer-term moves)
Leaving trendline resistance taken from 2.1161 unopposed, September currently trades lower by 3.9%, on track to retest trendline support (prior resistance – 1.7191).
Interestingly, the primary trend has faced lower since early 2008 (unbroken until 1.4376 gives way – April 2 high [2018]).
Daily timeframe:
Partially altered from previous analysis –
Recent action had demand at 1.3021/1.2844 relinquish ground, resulting in nearby demand at 1.2645/1.2773 (houses the 200-day simple moving average at 1.2732) making a show. As you can see, buyers and sellers continue to square off between the lower ledge of the recently engulfed demand at 1.2844 and the top edge of demand at 1.2773.
The RSI indicator recently cemented position under 50.00, and is now bottoming ahead of oversold territory.
H4 timeframe:
Monday spiked to a peak at 1.2918, forming a shooting star candlestick signal within the upper boundary of supply at 1.2837/1.2883 (prior demand).
Assuming the latter holds, downside to support at 1.2742 and a 61.8% Fib level at 1.2720 (green) could be in the offing.
H1 timeframe:
US trading welcomed the 1.29 level on Monday, a psychological base sharing space with the 100-period simple moving average. Possibly aided by H4 supply at 1.2837/1.2883, this led to a modest depreciation into the close, involving a mild dip beneath 1.2850 support.
Beneath 1.28 support, price could take on nearby support at 1.2762, derived from July 23.
RSI action rests around the 50.00 point as of current price, following a rotation from overbought peaks at 73.00.
Structures of Interest:
Monthly price suggests we could be heading for further losses until around 1.26 (monthly trendline support).
Daily demand at 1.2645/1.2773 recently entered view, yet price is finding resistance from the lower edge of recently penetrated demand at 1.3021/1.2844.
H4 reveals space to connect with support at 1.2742, after establishing resistance from supply at 1.2837/1.2883 by way of a bearish candlestick signal. A H1 close under 1.2850, therefore, could be enough to draw in additional selling towards at least 1.28. Ultimately, though, sellers are likely to seek 1.2750 support on the H1, aligning closely with H4 support at 1.2742.
DISCLAIMER:
The information contained in this material is intended for general advice only. It does not take into account your investment objectives, financial situation or particular needs. FP Markets has made every effort to ensure the accuracy of the information as at the date of publication. FP Markets does not give any warranty or representation as to the material. Examples included in this material are for illustrative purposes only. To the extent permitted by law, FP Markets and its employees shall not be liable for any loss or damage arising in any way (including by way of negligence) from or in connection with any information provided in or omitted from this material. Features of the FP Markets products including applicable fees and charges are outlined in the Product Disclosure Statements available from FP Markets website, www.fpmarkets.com and should be considered before deciding to deal in those products. Derivatives can be risky; losses can exceed your initial payment. FP Markets recommends that you seek independent advice. First Prudential Markets Pty Ltd trading as FP Markets ABN 16 112 600 281, Australian Financial Services License Number 286354.


 Access +10,000 financial
instruments
Access +10,000 financial
instruments