
EUR/USD:
Monthly timeframe:
(Technical change on this timeframe is often limited though serves as guidance to potential longer-term moves)
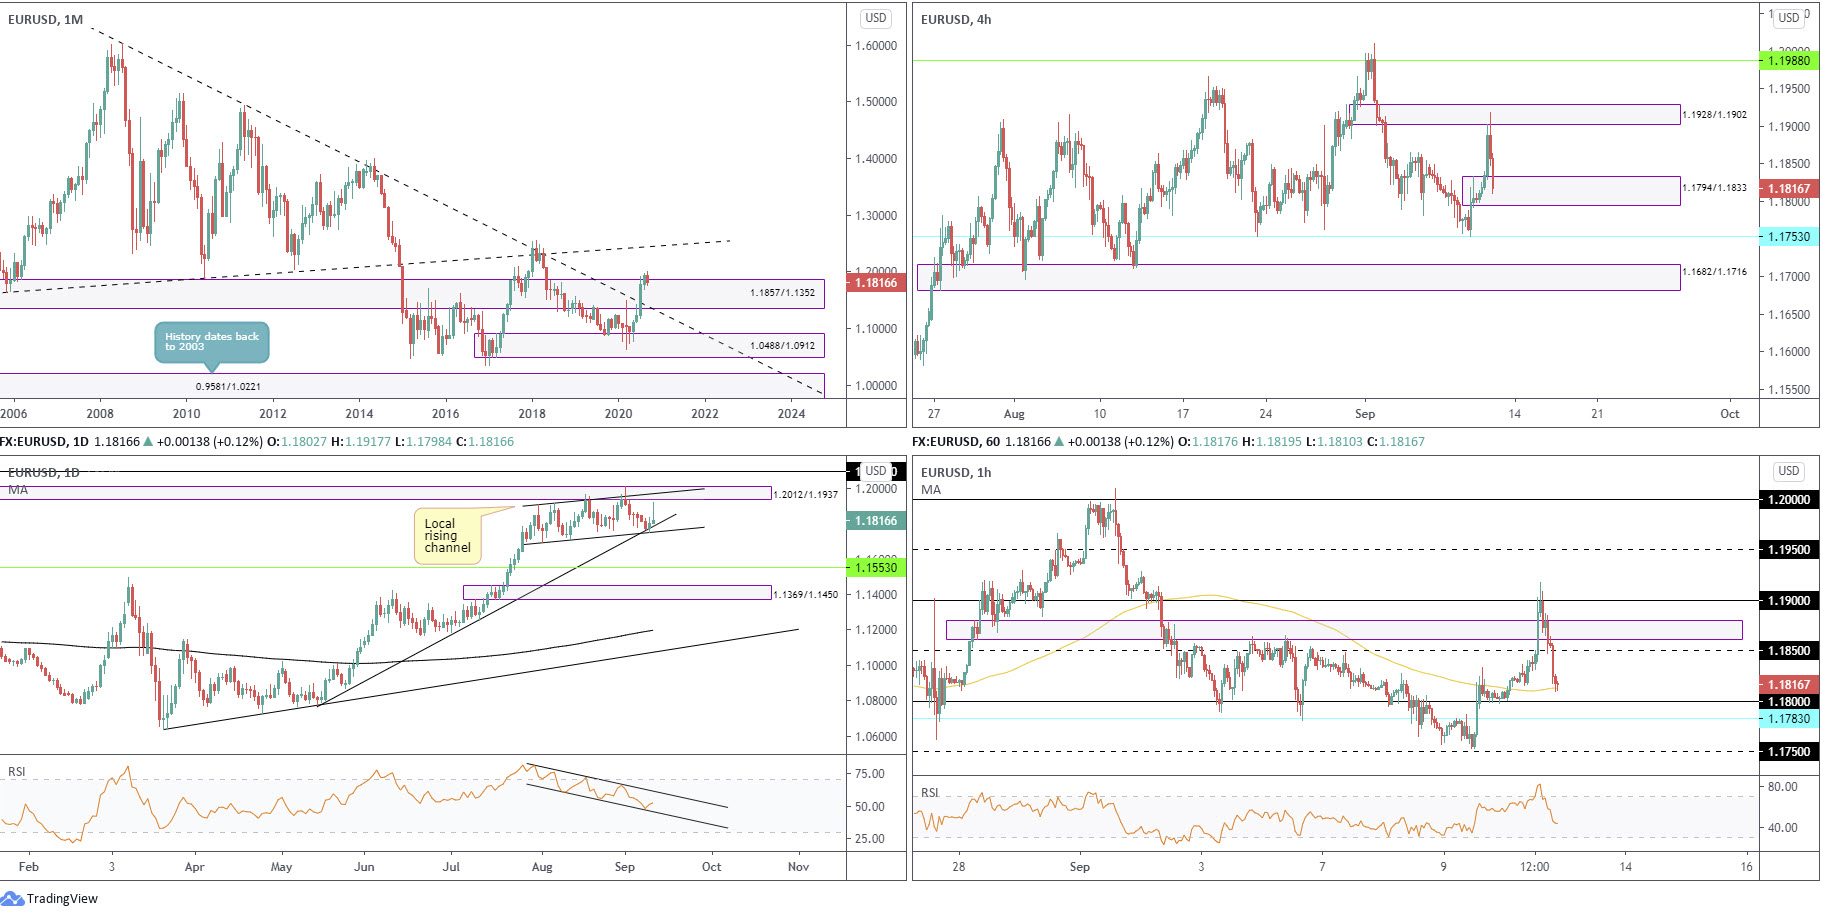
August had the euro nudge to a fourth successive monthly gain against the US dollar, adding nearly 1.5 percent. The move also toppled long-term trendline resistance (1.6038) and supply from 1.1857/1.1352. This argues additional moves to the upside may be on the horizon, with trendline resistance (prior support – 1.1641) on the radar as the next target.
What could hamper upside, though, is the primary downtrend (since July 2008) which remains intact at least until 1.2555 is engulfed (Feb 1 high [2018]).
Daily timeframe:
Brought forward from previous analysis –
- Efforts to extend higher remain contained within the parapets of a rising channel pattern (1.1695/1.1909), in addition to supply at 1.2012/1.1937 making an entrance on August 18, extended from May 2018. As of current price, we’re hovering around channel support.
- Trend traders will note that alongside the monthly trendline break, price, based on the daily timeframe, has trended higher since late March.
- In terms of the RSI indicator, we recently crossed back above 50.00, rebounding from channel support.
H4 timeframe:
Supply at 1.1928/1.1902 welcomed price action on Thursday, decisively capping upside and delivering the pair to demand at 1.1794/1.1833. The latter represents a reasonably significant zone, a place where a decision was made to break the 1.1865 September 4 peak. Failure to hold at current demand could see price unwind to support at 1.1753.
H1 timeframe:
Following a whipsaw above 1.19 to a session peak at 1.1917, the euro aggressively rotated south heading into Thursday’s US session, concluding things around the 100-period simple moving average, ahead of 1.18 and support laid out at 1.1783.
Traders will note 1.18 and the 100-period simple moving average rest within the lower parapets of H4 demand.
In terms of where we stand on the RSI indicator, we recently turned under 50.00, fading peaks around 84.00.
Structures of Interest:
A whipsaw through 1.18 to test H1 support at 1.1783 is perhaps in store today. Not only would this tackle stops under 1.18, it’d also possibly trip stops beneath H4 demand. A H1 close back above 1.18, in this case, could have intraday buyers make a show. It is also worth pointing out that this intraday action forms around daily channel support, as well as around the upper border of monthly supply.
AUD/USD:
Monthly timeframe:
(Technical change on this timeframe is often limited though serves as guidance to potential longer-term moves)
July’s rally, coupled with August’s 3.3% follow-through, witnessed supply at 0.7029/0.6664 and intersecting long-term trendline resistance (1.0582) abandon its position. Technically, buyers appear free to explore as far north as 0.8303/0.8082 in the coming months, a supply zone aligning closely with trendline resistance (prior support – 0.4776).
While price has removed trendline resistance and notable supply, traders might still want to take into account that the primary downtrend (since mid-2011) remains south until breaking 0.8135 (January high [2018]).
Daily timeframe:
- Demand at 0.7131/0.7192 (a drop-base-rally area) remains in play.
- Support at 0.7067 is seen should we push through the aforesaid demand.
- Supply at 0.7453/0.7384 can be found to the upside, an area which recently capped YTD peaks at 0.7413.
- The trend, according to the daily timeframe, has emphasised a positive tone since bottoming in late March.
- Indicator-based traders may also want to acknowledge the RSI holds support around 53.00, an active level since October 2019.
H4 timeframe:
Supply at 0.7300/0.7282 continues to hold back buyers, despite a rigorous move to 0.7324. This follows trendline support (0.7076) and demand at 0.7186/0.7207 coming together earlier in the week and providing a stage for buyers to advance from.
Unseating supply throws light on supply at 0.7339/0.7357, a prior demand zone; dipping to lower levels, however, calls for a possible reconnection with demand at 0.7186/0.7207.
H1 timeframe:
Buyers stepped aside as the US session got underway Thursday, following a deep fakeout above 0.73. This formed a local drop-base-drop supply at 0.7287/0.7277 and delivered the candles to 0.7250 support and a trendline support (prior resistance – 0.7413). A few pips south of here, technicians are likely also eyeing demand at 0.7223/0.7236, an area established prior to breaking 0.7250 to the upside.
Structures of Interest:
- Monthly action forecasts further buying over the coming months to 0.8303/0.8082.
- Daily price suggests AUD/USD may push for supply at 0.7453/0.7384, should demand at 0.7131/0.7192 hold.
- H4 is finding it difficult to topple supply from 0.7300/0.7282.
- H1 is seen testing 0.7250 support and a trendline support.
H1 demand at 0.7223/0.7236 boasts strength, yet H4 signalling room to move lower and 0.72 (H1) potentially calling for attention weakens the probability of the said demand holding.
0.72 support is likely to appeal, aligning with the upper border of daily demand at 0.7192.

USD/JPY:
Monthly timeframe:
(Technical change on this timeframe is often limited though serves as guidance to potential longer-term moves)
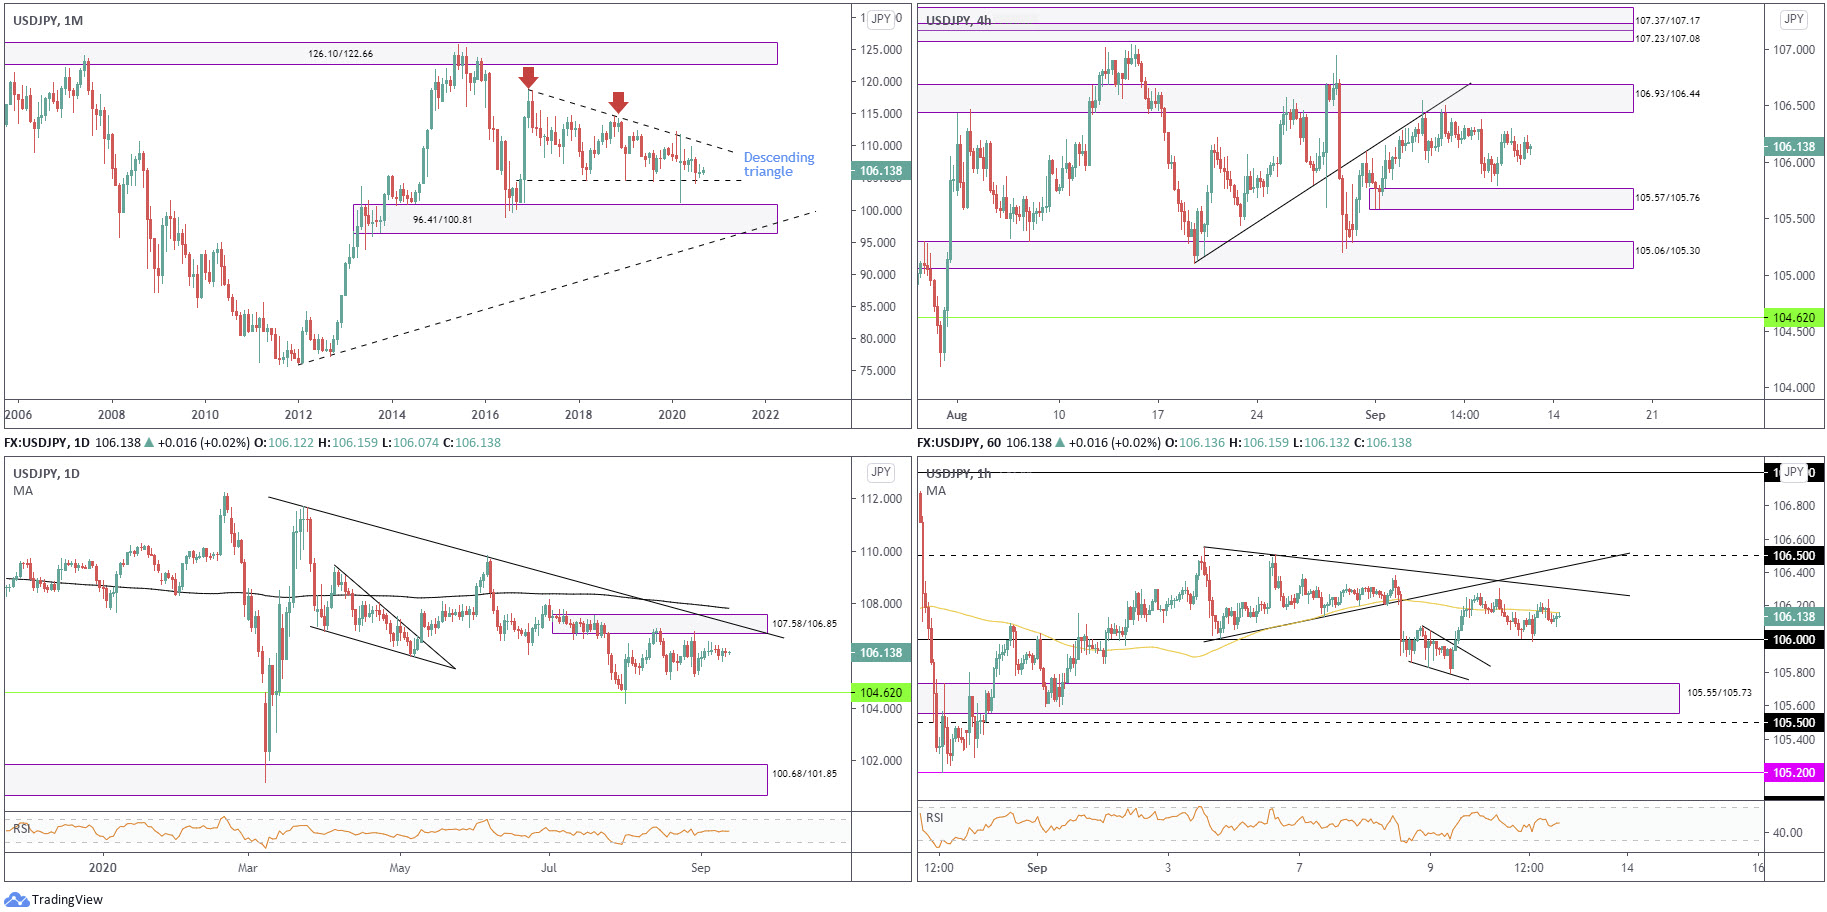
Since kicking off 2017, USD/JPY has been carving out a descending triangle pattern between 118.66/104.62. July sunk nearly 2 percent, testing the lower boundary of the descending triangle, while August ended off best levels, effectively unmoved.
Areas outside of the noted triangle can be seen at supply from 126.10/122.66 and demand coming in at 96.41/100.81.
Daily timeframe:
Brought forward from previous analysis –
Supply from 107.58/106.85 proved a tough nut to crack (an area sharing space with trendline resistance from 111.71 and located just under the 200-day simple moving average at 107.81) in August.
Trading to the downside is a possible scenario to 104.62 (monthly support). If a break comes to pass this likely shifts interest to daily demand at 100.68/101.85, drawn from 2016.
With reference to the RSI, we are pretty neutral right now, hovering around 50.00.
H4 timeframe:
- Technical action is seen fluctuating between demand from 105.57/105.76 and a supply zone plotted at 106.93/106.44.
- A break higher potentially unmasks stacked supply between 107.37/107.17 and 107.23/107.08.
- Territory south of current demand shines light on demand at 105.06/105.30 (prior supply).
H1 timeframe:
Aside from the 100-period simple moving average providing some dynamic resistance and 106 swinging back into view, USD/JPY offered little on Thursday.
Trendline resistance (106.55), followed by trendline resistance (prior support – 106.00) and 106.50 resistance, denote upside targets to be aware of in the event buyers make an entrance today. Removing 106, on the other hand, turns attention to demand at 105.55/105.73.
Structures of Interest:
Having seen 106 present solid support/resistance since the beginning of September, this may have traders place emphasis on the possibility of the round number holding as support should the level be brought into the fight today.
The only other area really jumping out this morning on the H1 is 106.50 resistance, given its convergence with trendline resistance and H4 supply at 106.93/106.44.
GBP/USD:
Monthly timeframe:
(Technical change on this timeframe is often limited though serves as guidance to potential longer-term moves)
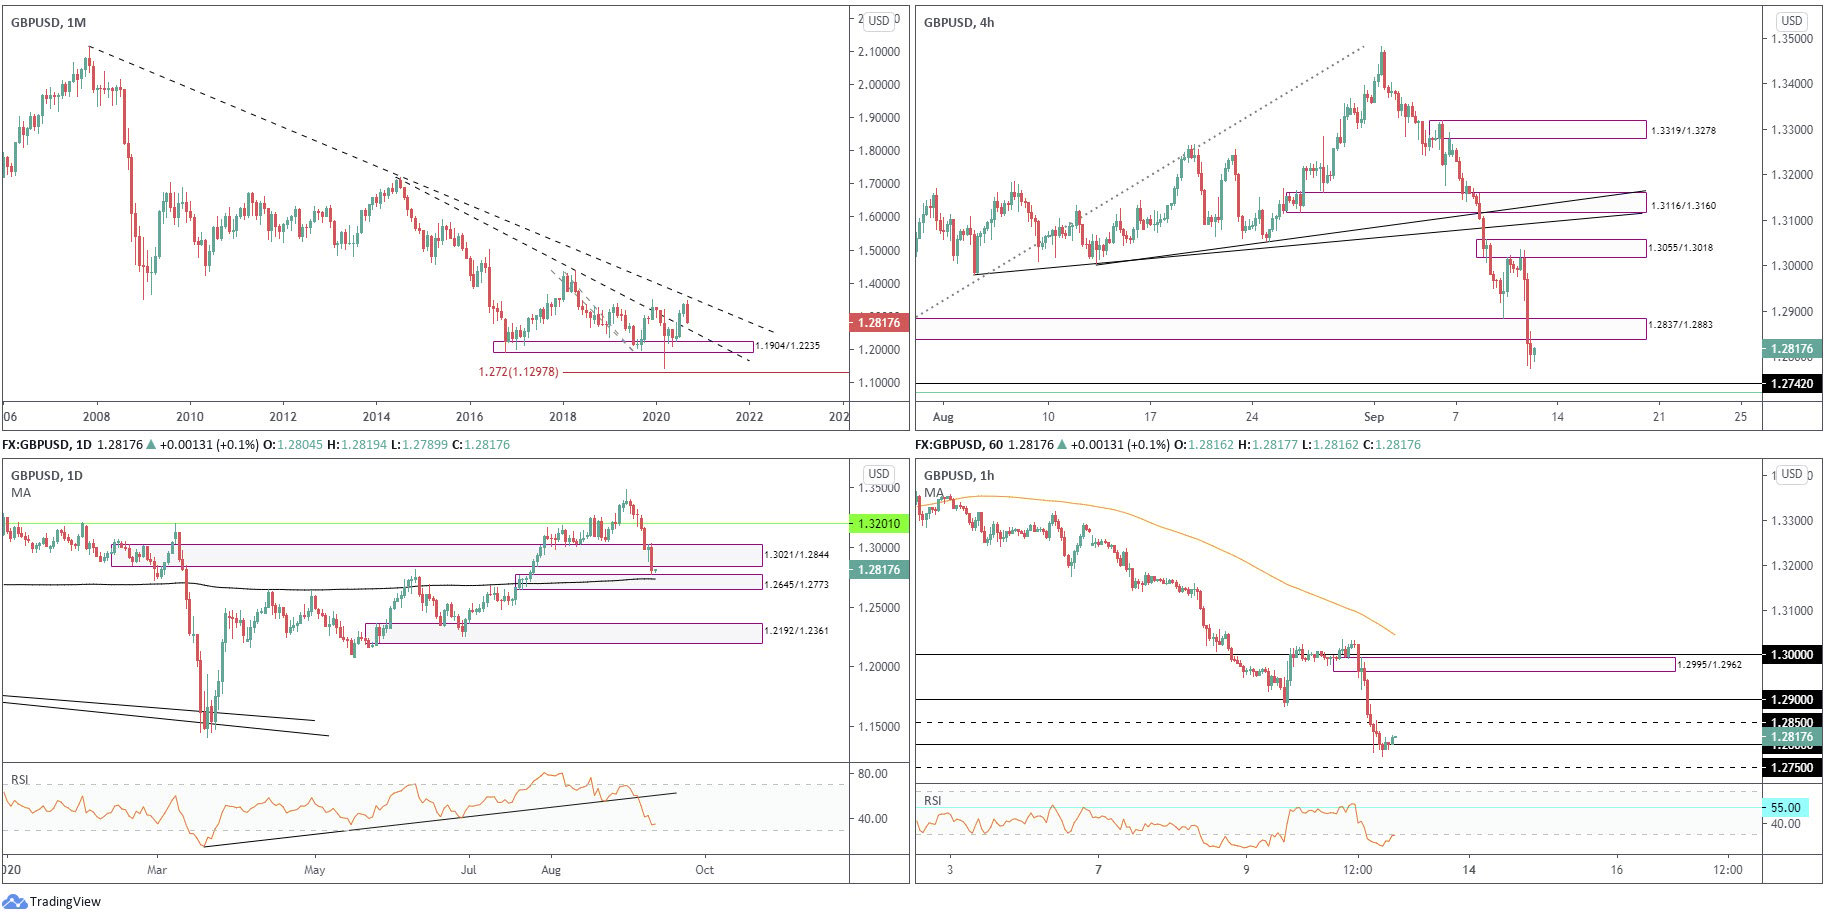
- Leaving trendline resistance taken from 2.1161 unopposed, September currently trades lower by 4.2%, on track to retest trendline support (prior resistance – 1.7191).
- The primary trend has faced lower since early 2008 (unbroken until 1.4376 gives way – April 2 high [2018]).
Daily timeframe:
Down 1.5%, demand at 1.3021/1.2844 relinquished ground Thursday, testing nearby demand at 1.2645/1.2773 (houses the 200-day simple moving average at 1.2735).
The RSI indicator recently cemented position under 50.00, and is now poised to greet oversold territory.
H4 timeframe:
Supply at 1.3055/1.3018, a recent drop-base-drop formation, proved a solid zone. Price plunged from the aforesaid supply yesterday amid intensifying fears surrounding a no-deal Brexit, providing enough force to brush aside demand at 1.2837/1.2883. This potentially unshackles downside to support at 1.2740 and a 61.8% Fib level at 1.2720 (green).
H1 timeframe:
- Thursday’s precipitous decline run through a number of key technical supports and formed a drop-base-drop supply area at 1.2995/1.2962.
- 28 support holds in early Asian trading, possibly lifting price to revisit 1.2850 resistance.
- RSI resistance at 55.00 held firm, sending the value deep into oversold space. Note recent movement is seen attempting to exit oversold territory.
Structures of Interest:
- Monthly price suggests we could be heading for further losses until around 1.26 (monthly trendline support).
- Daily demand at 1.2645/1.2773 entered view, yet price may find resistance from the lower edge of recently penetrated demand at 1.3021/1.2844.
- H4 reveals space to connect with support at 1.2742.
- H1 holds 1.28, albeit following a dip to session lows at 1.2773.
An intraday recovery is possible, having daily demand and the 1.28 level in play (H1). Resistance, nevertheless, could enter as early as 1.2837 (the lower edge of H4 supply (recently breached demand). Therefore, 1.2837, as well as 1.2844 (the lower edge of a recently breached daily demand) could be somewhere we see traders sell into the recovery.
DISCLAIMER:
The information contained in this material is intended for general advice only. It does not take into account your investment objectives, financial situation or particular needs. FP Markets has made every effort to ensure the accuracy of the information as at the date of publication. FP Markets does not give any warranty or representation as to the material. Examples included in this material are for illustrative purposes only. To the extent permitted by law, FP Markets and its employees shall not be liable for any loss or damage arising in any way (including by way of negligence) from or in connection with any information provided in or omitted from this material. Features of the FP Markets products including applicable fees and charges are outlined in the Product Disclosure Statements available from FP Markets website, www.fpmarkets.com and should be considered before deciding to deal in those products. Derivatives can be risky; losses can exceed your initial payment. FP Markets recommends that you seek independent advice. First Prudential Markets Pty Ltd trading as FP Markets ABN 16 112 600 281, Australian Financial Services License Number 286354.


 Access +10,000 financial
instruments
Access +10,000 financial
instruments