
Yield curve control, the markets are moving (lower) in sympathy with increasing yields, the USD Index has made a decisive move higher bringing pressure onto major currencies. The $AUD losing 3 cents over 48 hours late in the week.
This week’s price charts show the stark underlying correlation between markets from equities to commodities.
XVI the Australian volatility indicator moving higher also putting pressure onto Australian equities prices.
Last week saw one of the highest volume trading days as the market moved lower.
Gold and Silver not making the move higher, although anticipated by many.
Expect a week of volatility with the potential for further declines to test support levels and trend lines.
XJO WEEKLY
Price structure:
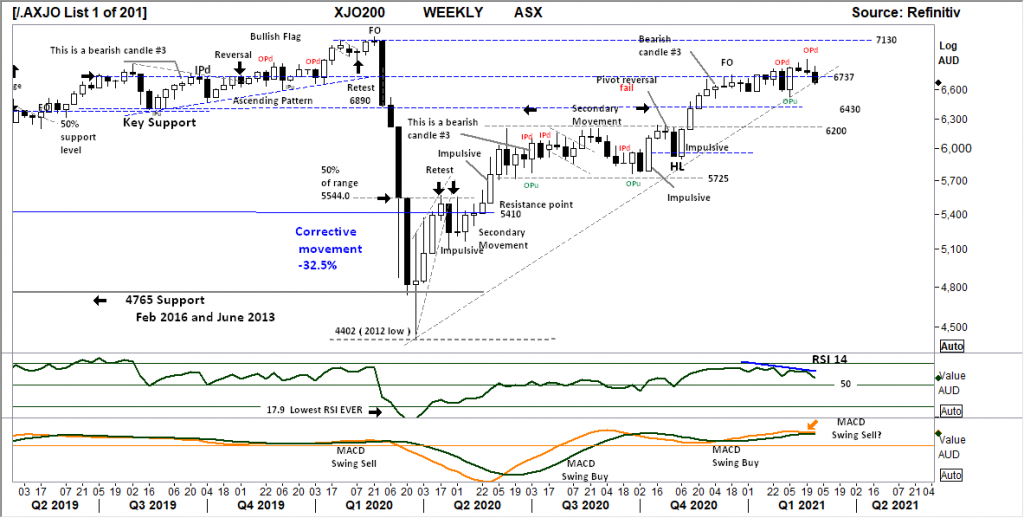
The XJO weekly now shows the Lower high just short of the 7130 Q1 2020 high.
Although potentially in the very early stages of a more intense market decline, there is a significant amount of price discovery to come before these claims can be made.
Currently the short term trend line is being tested on increasing volumes and declining positive momentum.
The breakoff short term support at 6737 with price closing in the low portion of the bar is the first signal of impending weakness.
Indicator: Relative Strength
The RSI indicator has remained over the key 50 level, last week turned lower, a sign of weaker price momentum.
A bearish divergence has developed within this momentum indicator and is now confirmed with a move below the previous low reading.
This should be monitored for a move below the key level of 50 to show a completed shift to bearish momentum.
Indicator: MACD
MACD remains a swing buy signal, but is closing in on a SELL crossover, again this highlights how slow this indicator can be in a fast market. It should be acknowledged this indicator can be very slow to react on a weekly basis and may continue to track sideways in the coming weeks as it did during 2019.
Traders should notice the faster average (orange) is now turning down and may swing to a sell signal.
Comments from last week: The market remains in a consolidation phase until a breakout.
Continuing price rejection at 6900 following the reversal Outside period (OPu) of 3 weeks ago, this is statistically a very bearish setup. Only a close over the high would negate this view. In the short term a retest of the trendline at 6670 would be the first downside target.
A further breakout over 6900 would signal a retest of the 7000 point + high, this would possible negate the RSI divergence signal and the developing MACD swing sell.
XJO DAILY
Price structure:
Daily support at 6765 has been decisively broken with a large range bar. The next and key support level shown at 6510 will determine the underlying health of the market.
The XJO remains within a large consolidation phase beginning form November 2020.
This will provide mixed results in equities with sector performance the key focus.
Indicator: Relative Strength
With RSI making a series of lower highs recently and now tracking below the 50 level, setting a bearish momentum signal, a cautionary view of higher market momentum should continue to be held.
Indicator: VOLUME
High Volumes in this small pattern indicate an increase of selling, this indicator should now be monitored for declining volumes to signal a loss of selling momentum.

Comments from last week: Further high price rejection from the Outside period (OP) set last Wednesday has seen an accelerating price move lower towards 6765 support, this will the key daily price level to hold in the coming week.
S&P 500 WEEKLY
Price structure
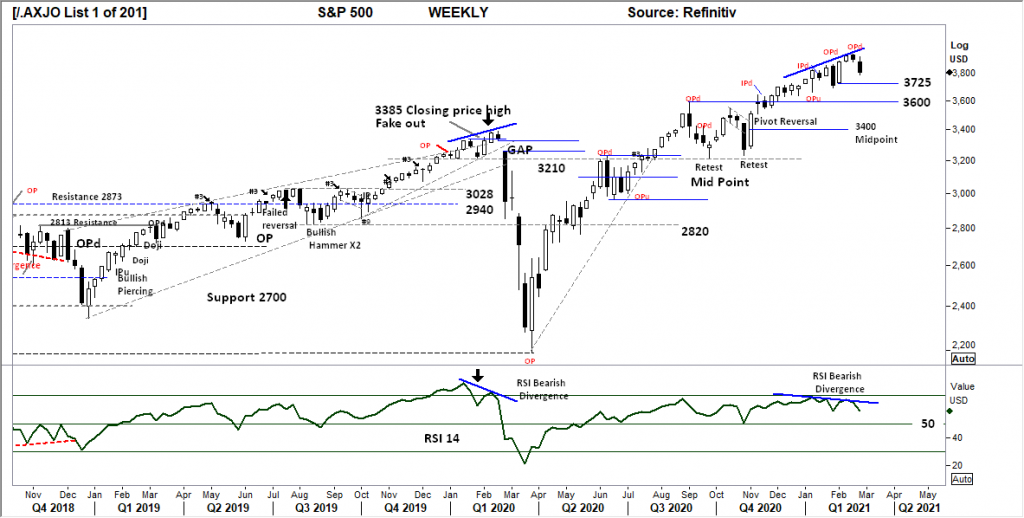
Pivot point reversal towards first support at 3725 with e lower support at 3600 pivotal in holding positive market sentiment. The Outside period (OPd) of 2 weeks ago playing out into lower prices on an expanded range bar. This is a bearish development within the current price structure.
Indicator: Relative Strength Indicator
Relative Strength remains above the key 50 level and has set a Bearish divergence from price. This not the same but remains very similar to the Jan Feb 2020 divergence setup and continues to play out.
RSI is currently reflecting weaker prices, a movement below the 50 level would signal very strong bearish price momentum.
It should be acknowledged the RSI has remained above the 50 level for the past 9 months.
Comments from last week: A short range week, a signal of indecision, this can often lead to some form of decline as Buyers leave the market and current holders lock in profits.
3725 is the first level to hold in a retracement move. This type of price decline will place pressure on the buyers of the last 3 weeks.
In short some form of retracement is a high probability.
Primary Trend remain UP.
S&P 500 DAILY
Price structure:
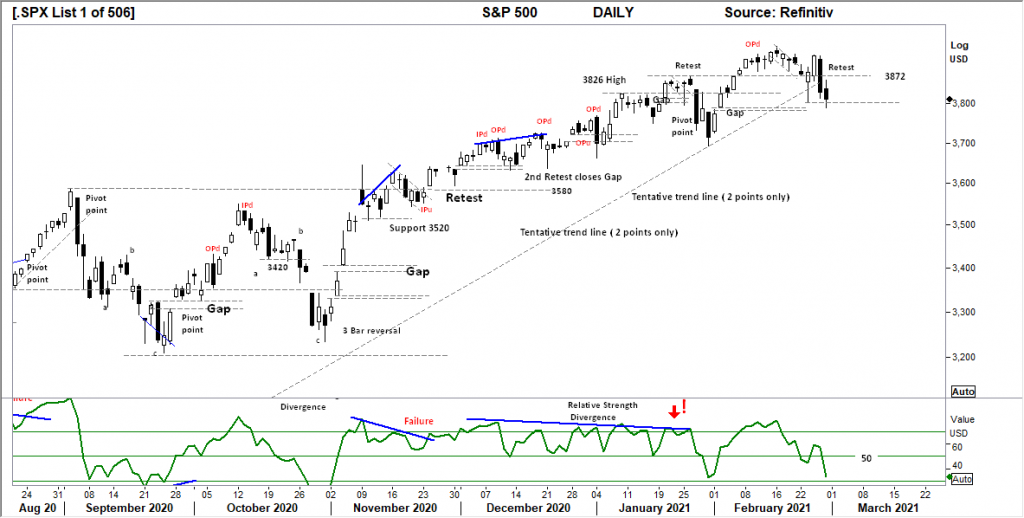
Wednesday Thursday last week have set a lower high, with Fridays retest of the 3872 before closing towards the low, suggest buyers remain in the market.
However the short term trend line has been broken leaving behind a potential support area.
A further breakdown below 3800 would signal a continuation move towards 3600.
Indicator: Relative Strength
Relative Strength short term has turned BEARISH. The RSI should be monitored for a movement and continuing close below the 50 level and further move below key 30 level as a loss of upward momentum gather pace.
Comments from last week: The Daily support level shown at 3872 was tested last Thursday, going forward this will be the short term level to hold in the coming days.
The daily structure could be described as a Bullish Flag looking for a breakout higher.
The favoured view is a retest of the trendline. To remain Bullish a large range UP day is required in the coming days to confirm the Buyers have remained in the market.
USD Spot GOLD – WEEKLY
Indicator: Relative Strength
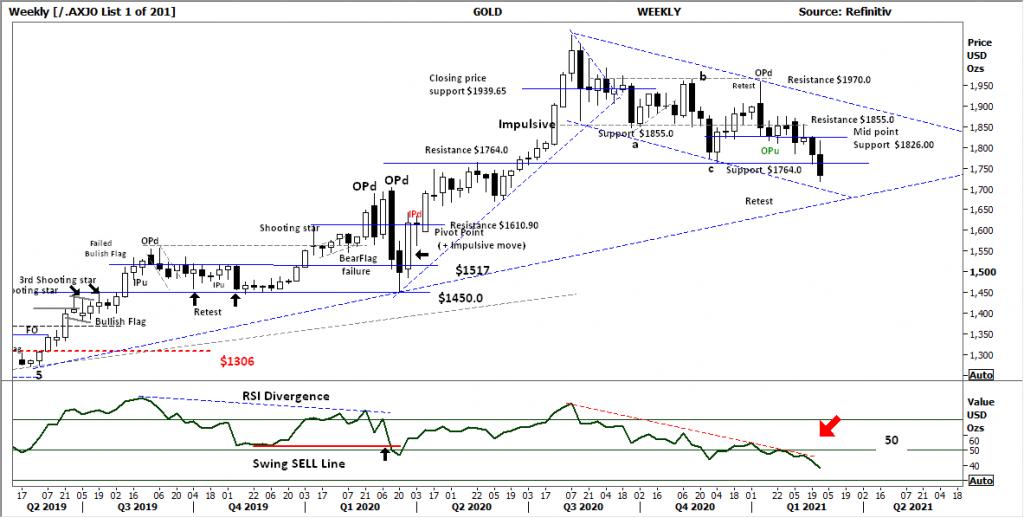
Gold continues into the current Primary Down trend. (institutional traders do not hold downtrends)
The retest of support from 2 weeks ago resulted in a short rally to retest the midpoint support level of $1826.00 with immediate rejection.
Current momentum suggest a retest of the Primary trend-line circa $1700.
Relative strength turns lower and fails to cross the key “50” level. This is a key indicator of “slowing” price momentum, a continued move lower would only reflect negative price momentum both in the Daily and Weekly charts.
Look for an up turn in the RSI to confirm any potential price rally getting underway.
Comments from last week: A very important development in the GOLD chart is the Fake out move below the November support level $1764, (see last weeks notes below) followed by a Weekly close above this level.
The Daily chart of gold displays an outside period (OP).
This can be a very bullish setup with a potential retest of $1826 in the coming days.
Price failure at this level puts the lower trend-line target in play at $1700.
AUD GOLD DAILY
Price structure:
AUDUSD continues to consolidate below the important $2288.0 level. This price chart remains in a Primary down trend and will continue to place price pressure on local Gold producers.
There is nothing bullish in this current price structure, except the price divergence developing within the Relative Strength Indicator. A short price rally will be against the underlying down trend.
Indicator: Relative Strength
With the RSI turning lower from below the key 30 level showing decreasing momentum.
With the indicator turning higher as price makes new closing lows, a divergence signal is developing. This may lead to a short price rally.
This momentum indicator needs a continued swing higher over the key 50 level in line with any price gains to confirm a valid buy signal.
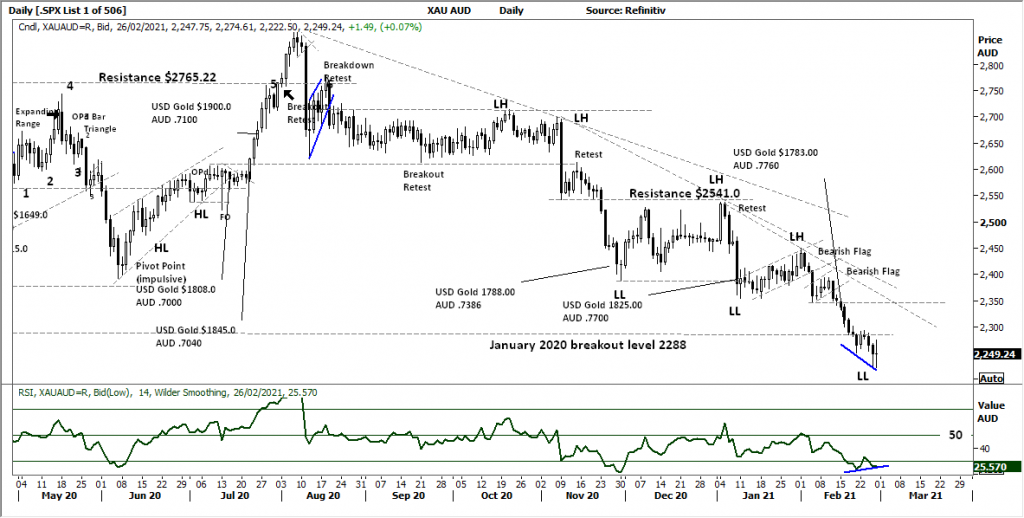
Comments from last week: The AUDUSD Gold price has placed considerable pressure on the Australian producers underlying price, with most remaining within a Primary down trend.
Last Friday’s large range may be the extended price flush. (bullish)
The AUDSUD price breakdown below the January breakout level is a signal od very weak price and should be monitored for further declines.
Smaller Gold plays remain dependant on news flow and drilling results.
SILVER DAILY
Price structure:
The Daily silver chart continues to hold above the key support level of $26.00 and above the confirmed trend line. Fridays lower retest of this level with a close back towards the midpoint suggest buyers remain.
The price construction within this chart is vastly different from the Gold chart. Silver remains the stronger of the two.
The big level to hols buyer support is $26.00 a move below this level would be a very bearish move and offer traders momentum.
Indicator: Relative Strength
Relative Strength has turned lower below the 50 level, operating in line with the underlying price movement. A good signal for further improvement in price momentum would be a move above the 50 level.
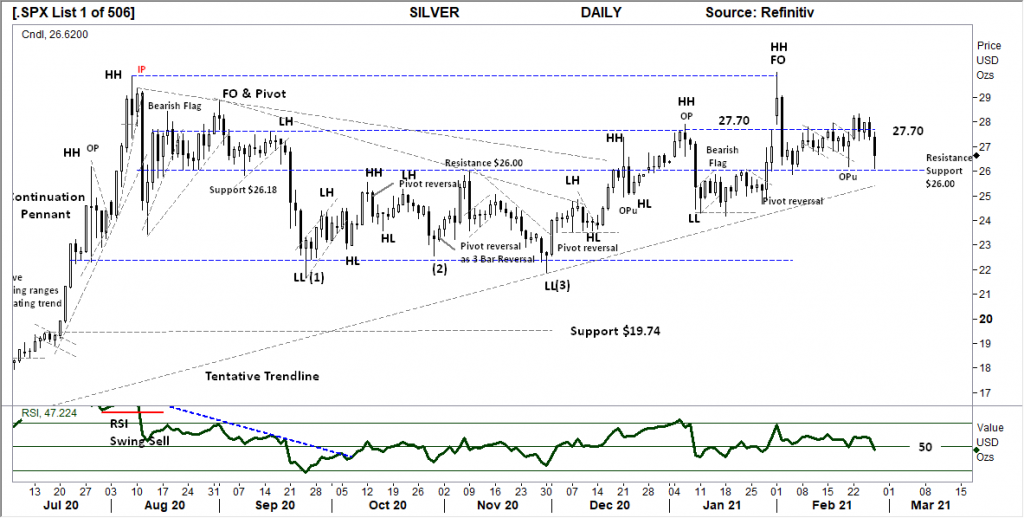
Comments from last week: Last Friday saw another retest of the $26.00 support level and again met with strong buying to lift price back towards the $27.70 resistance level.
This is a very strong signal for further gains as the Sliver price leads the Gold price in coming days.
A further close over the $27.70 level would be a very Bullish signal, with a potential retest of the $30.00 high underway.
COPPER DAILY
Price structure: Inventories under pressure.
Inventory pressure has moved Copper significantly higher over the 12 months.
Last Friday price resolved into a “shooting star” suggesting the market has moved to profit taking.
A further retracement could be expected to initially retest the $4.00 level. Consolidation above this level would be viewed as extremely positive.
Further support is shown at $3.80.
Indicator: Relative Strength
Relative Strength has moved over the 70 level.
An early BEARISH divergence signal has now confirmed. Further confirmation will show as a move below the “70” level.
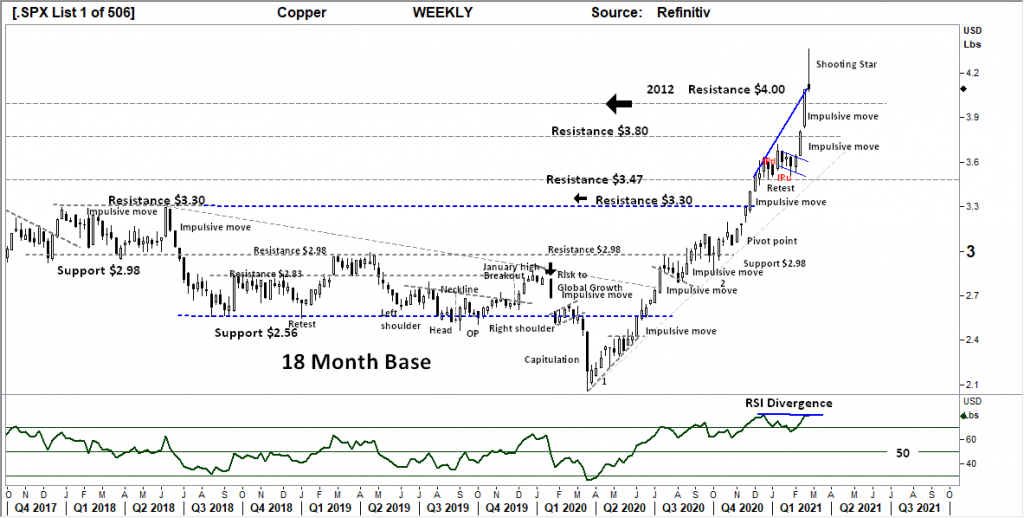
Comments from last week: “Dr Copper” the physician to economic growth.
Copper has staged a very strong breakout over the historical $4.00 resistance level on an extended range bar closing on the high.
A price back retest of this $4.00 level and hold, would be very bullish for further gains in the coming days.
This is a very bullish chart with trading opportunities long and short (against the trend)
AUSTRALIAN VOLATILITY INDEX
The XVI has moved higher with market volatility, this will place pressure on equities in the coming days.
The XVI is the difference of 1-month forward pricing of ETO Options against current month.
As markets anticipate events, the forward priced option volatility changes, hence as forward price changes, this “skew” in pricing is measured in this XVI.
The XVI value works as an inverse observation to the underlying market.
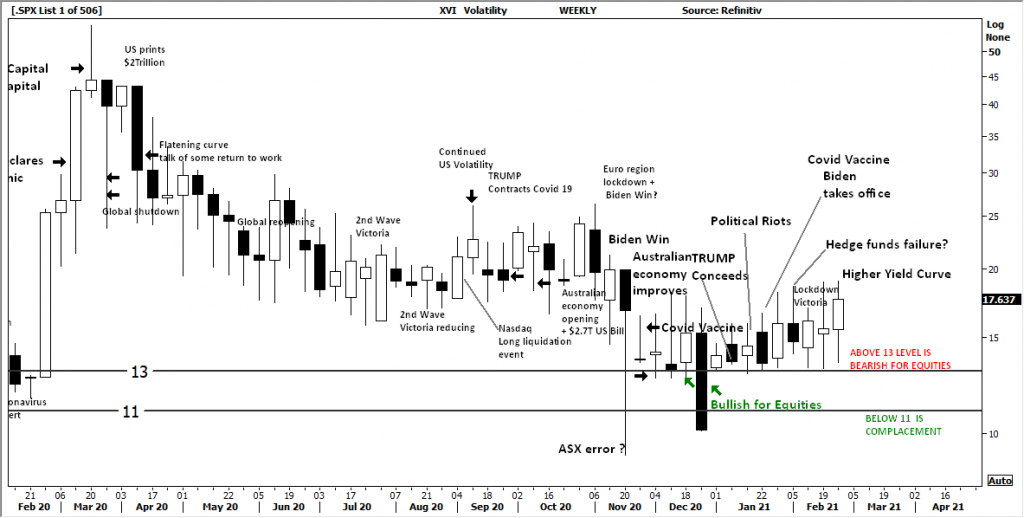
Comments from last week: The large range bar last week has given way to a lower close over the previous week. Volatility remains in equity pricing as the cost of option PUT insurance remains elevated.
USD DOLLAR INDEX
Price structure:
The most important chart in the world the USD Index has set an impulsive move higher, possibly forcing a “short cover” following the surge higher in US Bond yields.
The down trend line is currently being tested, a continued move higher in the coming week could be expected.
Indicator: Relative Strength
While the RSI has made a sharp recovery the 50 level. Trader will look for an RSI above the 50 level to suggest a more significant momentum move higher is underway, this remains highly probable.
The December / January divergence signal is playing out.
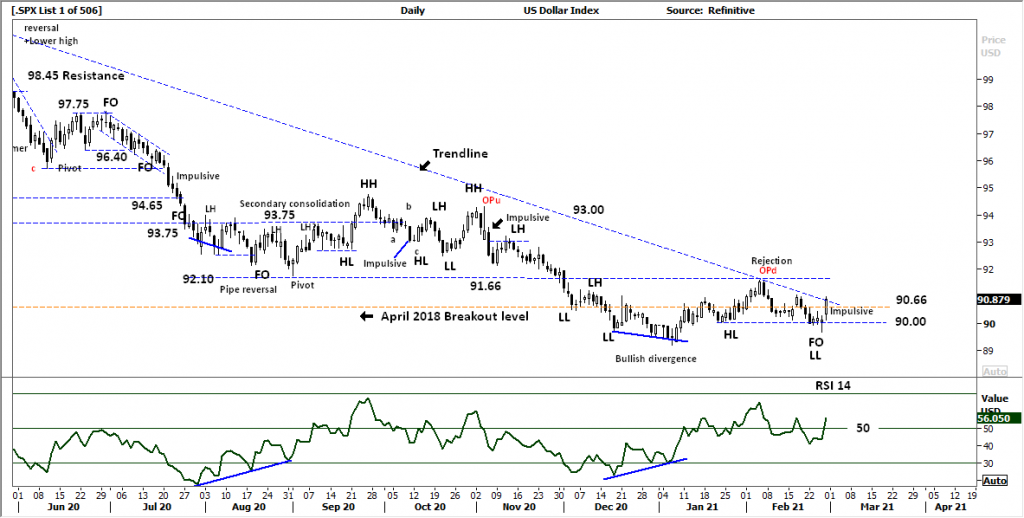
Comments from last week: Building support along the 90.00 level is a strong signal the Buyers are accumulating.
The longer the consolidation period the stronger the breakout, however the consolidation above 90.00 and below trendline resistance can last for several more days.
A breakdown below the 90.00 would be decisive win for the BEARS and could lead to an accelerated decline to 89.00.
WTI CRUDE OIL
Price structure: This commodity is news driven by supply -demand.
Two weeks ago an expectation of weaker prices as price remained below the $61.80 level.
Last week saw a decisive move above this level although the RSI remains extended.
The $66.00 resistance level remains the current higher price target.
Currently the price remains with the 2019 historical price consolidation area, and may further consolidate at these levels.
Indicator: Relative Strength
RSI turning higher over the 50 level and now over 70 remains in a very good place for further momentum price gains until a dip below the 70 level.
The indicator is “rolling” higher in line with current price.
As the indicator remains over 70, this should also be monitored for a potential divergence signal.
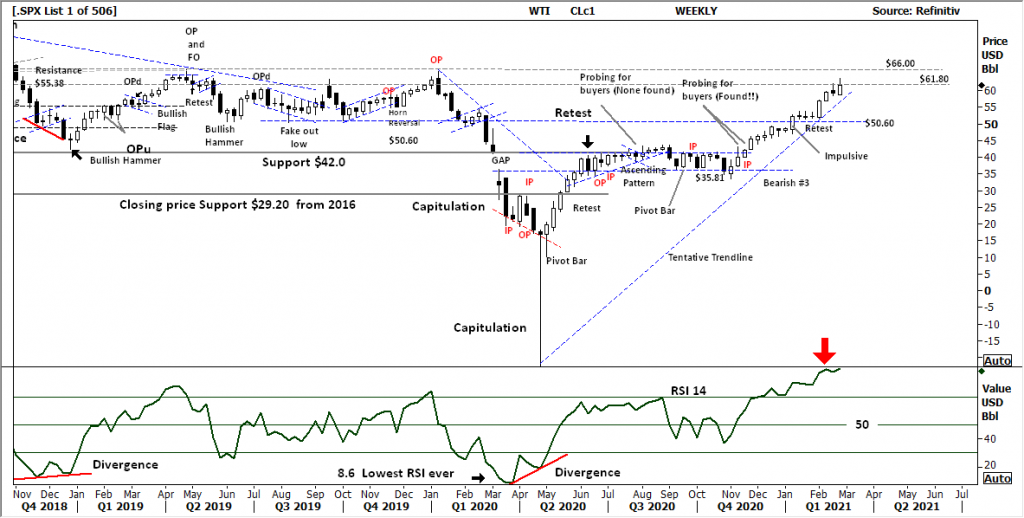
Comments from last week : Last week the $61.80 level has provided resistance to the current price advance above the $50.60 level. A short retracement could be expected in the coming days with the trendline the first level of support at $55.00


 Access +10,000 financial
instruments
Access +10,000 financial
instruments