
Charts: Trading View
EUR/USD:
Monthly timeframe:
(Technical change on this timeframe is often limited, though serves as guidance to potential longer-term moves)
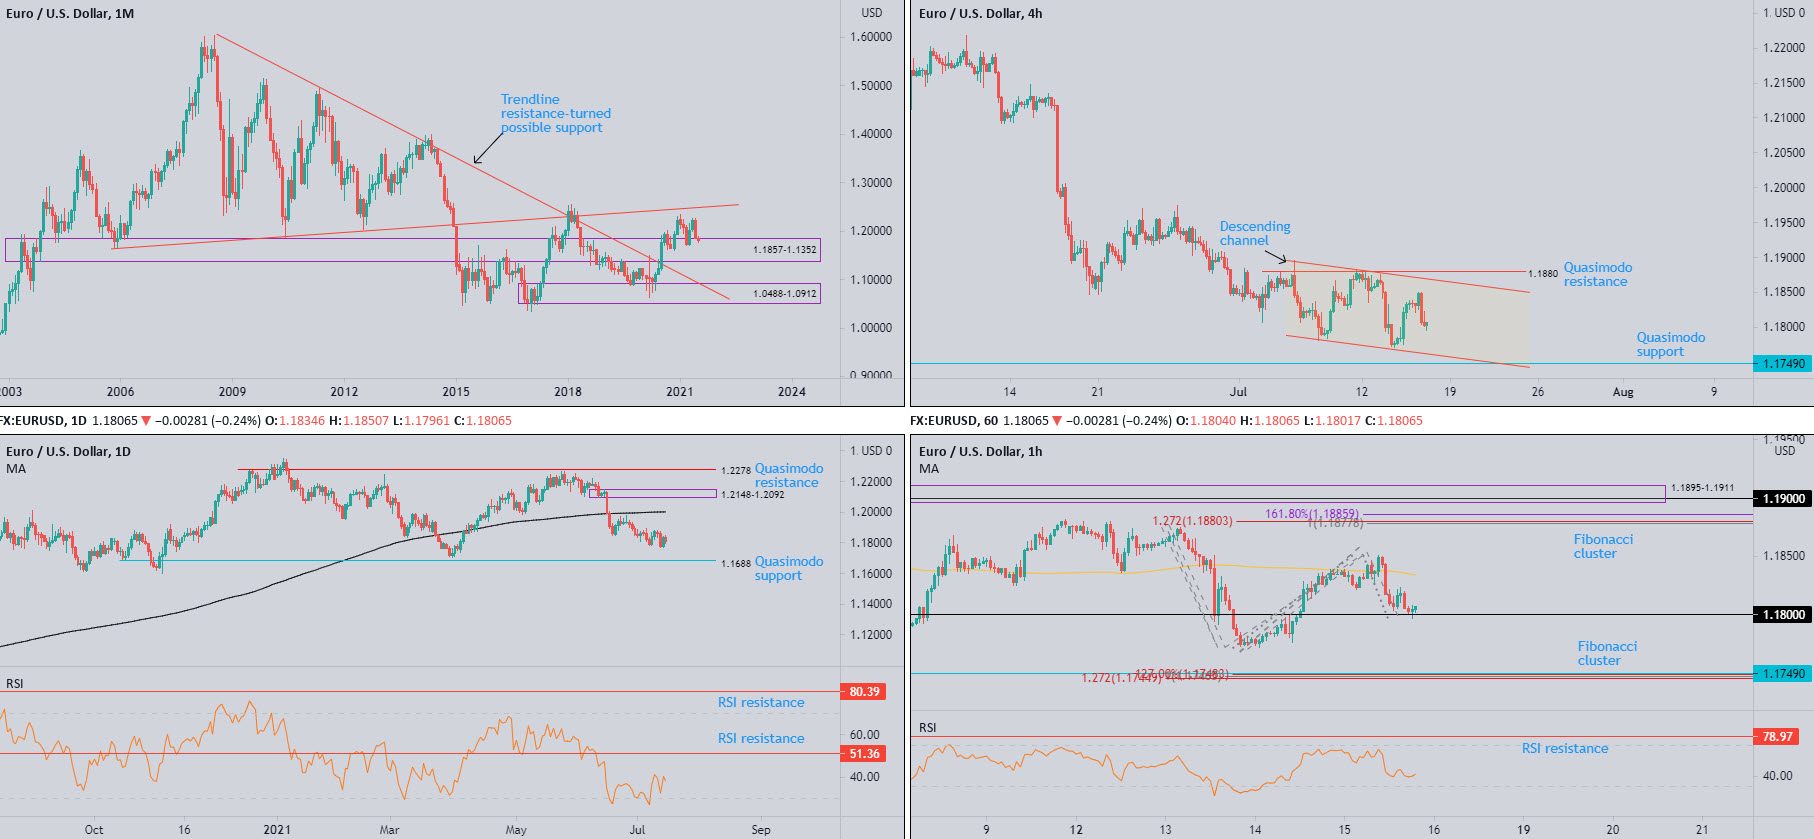
Closing the book on the month of June witnessed EUR/USD—in the shape of a near-full-bodied bearish candle—touch gloves with familiar support at $1.1857-1.1352 and erase 3.0 percent.
A bullish revival shines the spotlight on 2021 peaks at $1.2349; additional enthusiasm welcomes ascending resistance (prior support [$1.1641]).
July currently trades 0.5 percent lower.
Based on trend studies, a primary uptrend has been underway since price broke the $1.1714 high (Aug 2015) in July 2017. Furthermore, price penetrated major trendline resistance, taken from the high $1.6038, in July 2020.
Daily timeframe:
Technical Structure Unchanged from Previous Analysis.
The US dollar—according to the US dollar index—recovered some lost ground on Thursday, following Fed Chair Powell on Wednesday stating he’s confident recent inflation is associated with post-pandemic growth and will fade.
Technically, EUR/USD structure remains unchanged as the pair continues to work with a reasonably narrow range between $1.1880 and $1.1776. Quasimodo support at $1.1688 calls to the downside, while any upside attempts perhaps reignites interest at the 200-day simple moving average, circling $1.2002 (sheltered beneath supply at $1.2148-1.2092).
With regards to trend, we have been somewhat rudderless since the beginning of the year, despite healthy gains in 2020.
The relative strength index (RSI) worked its way out of oversold territory in recent sessions and is on the door step of the 50.00 centreline. Crossing north informs traders that average gains exceed average losses, and momentum is to the upside.
H4 timeframe:
Since the beginning of July, price has been carving out a descending channel, drawn from $1.1895 and $1.1781. External areas to be mindful of are Quasimodo support from $1.1749 and Quasimodo resistance coming in at $1.1880.
H1 timeframe:
A closer reading of price action on the H1 chart reveals that while short-term flow shakes hands with $1.18, Fibonacci structure resides on both sides of the market—commonly referred to as Fibonacci clusters.
Upstream, a 100% Fib projection at $1.1878, a 1.272% Fib expansion at $1.1880 and a 1.618% Fib extension at $1.1886 is visible, just south of demand-turned supply from $1.1895-1.1911.
Downriver, a 1.272% Fib expansion at $1.1745, a 100% Fib projection at $1.1747 and a 1.27% Fib extension at $1.1748 is seen dovetailing with H4 Quasimodo support mentioned above at $1.1749.
As for the relative strength index (RSI), the value stepped below the 50.00 centreline on Thursday, showing average losses exceed average gains for now. Oversold territory could, therefore, be on the cards today.
Observed levels:
According to charts studies, attention is on the H1 timeframe’s Fibonacci structure: between $1.1886 and $1.1878 for resistance and between $1.1745 and $1.1748 for support. The $1.18 figure boasts limited convergence with additional technical tools, aside from the market perhaps viewing this angle as feeble due to the unit trending lower since June.
AUD/USD:
Monthly timeframe:
(Technical change on this timeframe is often limited, though serves as guidance to potential longer-term moves)
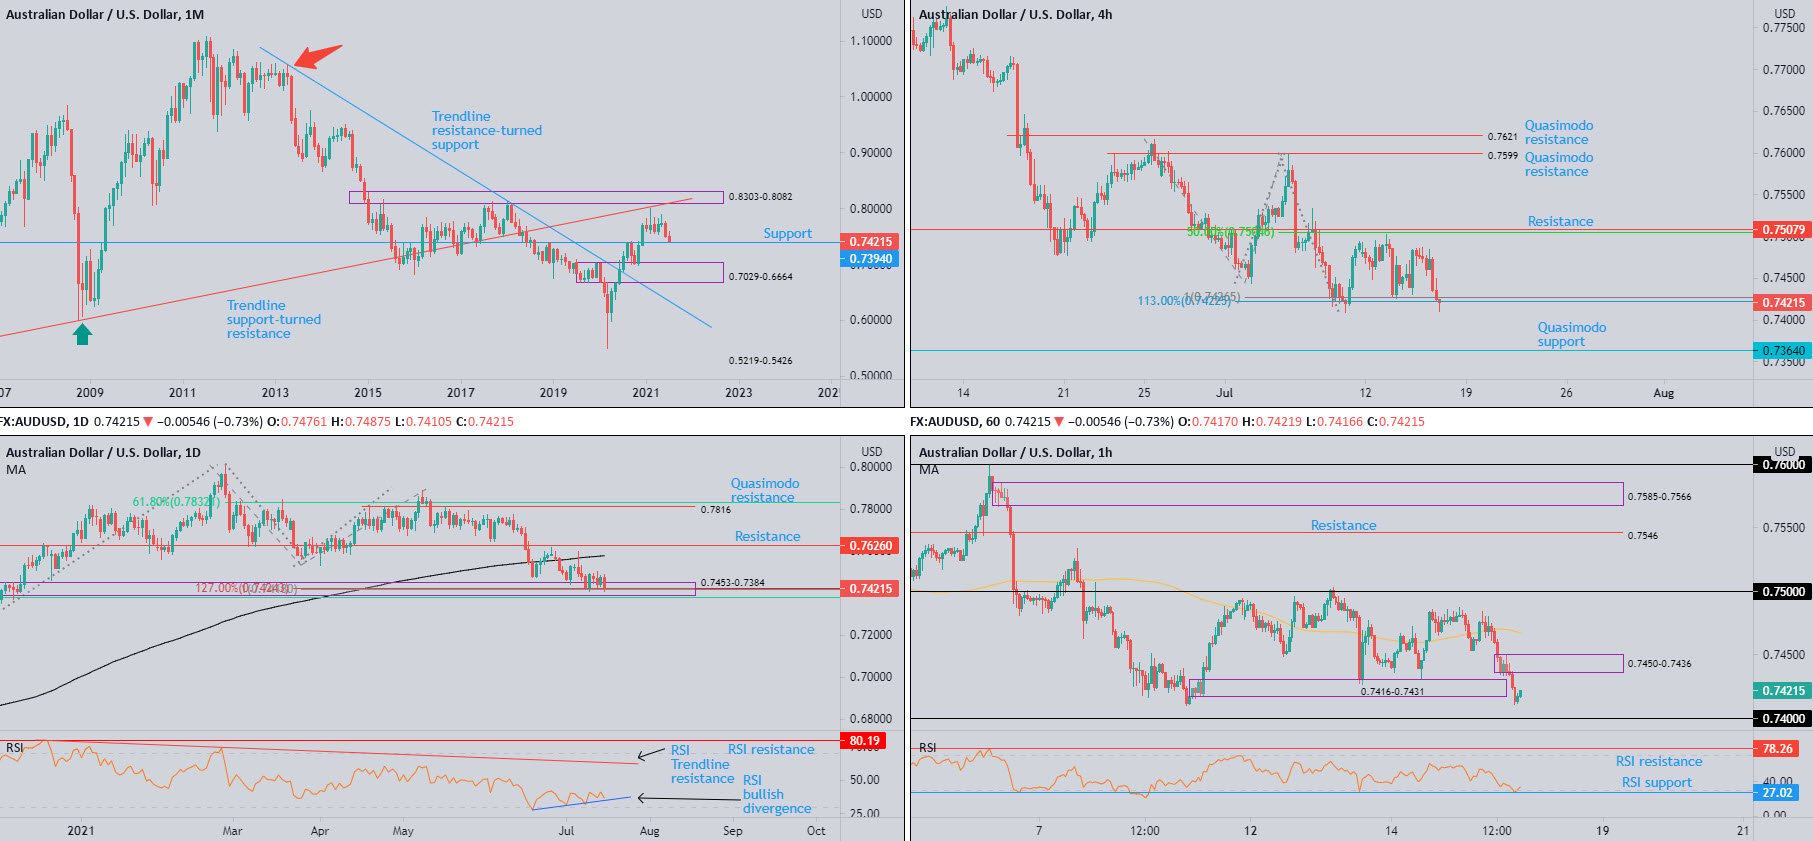
June’s 3.0 percent decline lands July in reach of support at $0.7394. Additional downside pressure brings demand at $0.7029-0.6664 to light (prior supply).
Forging support places trendline resistance (prior support – $0.4776 low) and supply from $0.8303-0.8082 in sight.
July is currently down 1.1 percent.
Trend studies (despite the trendline resistance [$1.0582] breach in July 2020) show the primary downtrend (since mid-2011) is in play until breaking $0.8135 (January high 2018).
Daily timeframe:
Technical Structure Unchanged from Previous Analysis.
Supply-turned demand at $0.7453-0.7384—an area housing key Fib ratios, including a 100% projection at $0.7418 and a 1.272% Fib extension at $0.7424—remains in the picture, despite the lacklustre bullish vibe. What’s interesting is this area houses monthly support underlined above at $0.7394.
Territory above demand shines light on the 200-day simple moving average at $0.7579, a dynamic value sheltered south of resistance from $0.7626.
In terms of trend, 2020 was a respectable year for AUD/USD, though 2021 is on the back foot.
From the relative strength index (RSI), the indicator continues to emphasise a position of bullish divergence. What this shows traders is from mid-June, the currency pair reflected less downside momentum.
H4 timeframe:
AUD/USD largely overlooked better-than-expected Aussie employment data early hours Thursday, as the US dollar climbed higher across the board. Also in the spotlight again was Fed Chair Powell backing up his recent comments to continue supporting the economy in spite of higher inflation.
From a technical viewpoint, the currency pair is on the verge of dethroning a 100% Fib projection at $0.7427 and a nearby 1.13% BC Fib extension at $0.7423, movement throwing light on Quasimodo support drawn at $0.7364.
H1 timeframe:
Immediate flow directs attention to the engulf of demand at $0.7416-0.7431. Not only has the move unlocked the $0.74 region as a possible support, neighbouring supply from $0.7450-0.7436—the decision point to venture lower—is on the radar.
The relative strength index (RSI) defending oversold space underpins a potential test of $0.7450-0.7436 today, targeting at least $0.74.
Observed levels:
As highlighted on the H1 chart, a test of supply at $0.7450-0.7436 is in sight, with $0.74 targeted short term.
The big figure $0.74 may also interest traders, having seen the level arranged above monthly support at $0.7394. Traders are urged to pencil in the possibility of a whipsaw through $0.74 to test the monthly barrier, action which could welcome buyers into the market.
USD/JPY:
Monthly timeframe:
(Technical change on this timeframe is often limited, though serves as guidance to potential longer-term moves)
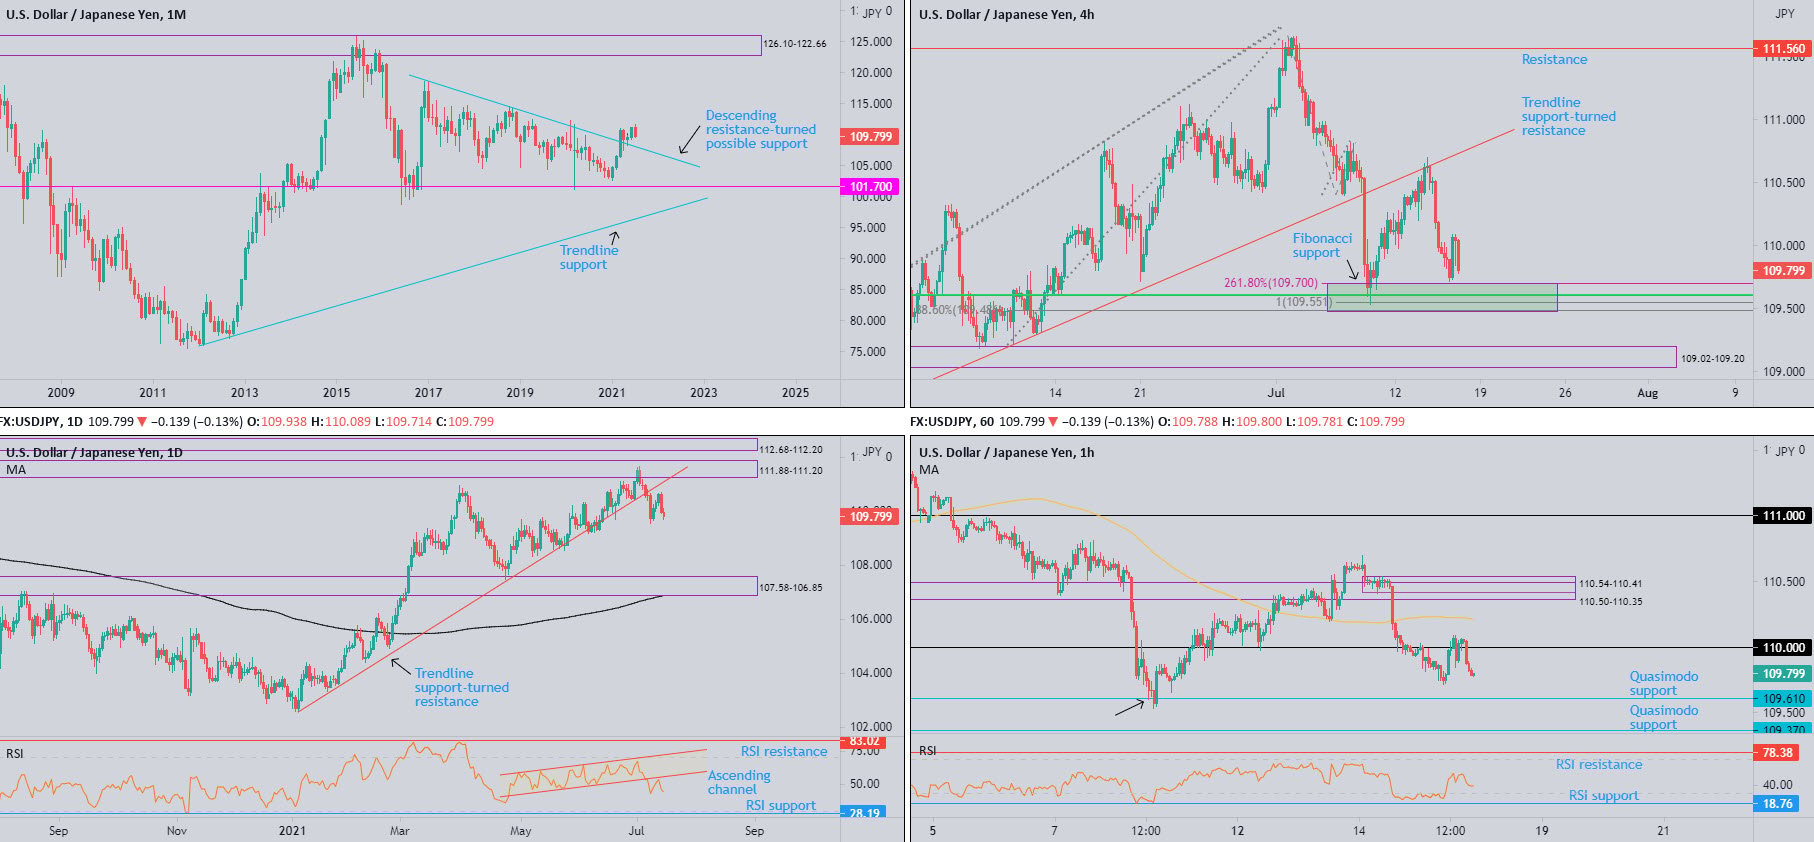
Following January’s bullish engulfing candle, March concluded up by 3.9 percent and cut through descending resistance, etched from the high ¥118.66.
Although April finished lower by 1.3 percent and snapped the three-month winning streak, May (+0.2 percent) held the breached descending resistance and echoed support in June, higher by 1.4 percent.
July trades 1.2 percent in the red.
Daily timeframe:
Leaving the lower belly of trendline support-turned resistance (taken from the low 102.59) unchallenged, the US dollar extended Wednesday’s downside presence on Thursday. Despite the US dollar index outperforming, USD/JPY was weighed by increased selling in US Treasury yields amidst the risk-averse setting.
Brushing aside last Thursday’s low at $109.53 potentially sets the technical stage for further weakness to as far south as ¥107.58-106.85: supply-turned demand.
Trend studies—despite the trendline support breach—reveals the pair has been trending higher since the beginning of the year.
In terms of the relative strength index (RSI), the value rotated south ahead of the lower side of a recently breached ascending channel between 58.82 and 47.51, encouraging moves through the 50.00 centreline. Traders, therefore, will likely be monitoring this indicator for further weakness beneath 50.00, possibly headed for oversold waters.
H4 timeframe:
Trendline support-turned resistance, taken from the low ¥108.56, served sellers well early Wednesday, delivering energetic downside. Thursday’s bearish extension finished within a stone’s throw from familiar Fibonacci support between ¥109.48 and ¥109.70.
Ground south of Fib support has demand at ¥109.02-109.20 in the line of fire.
H1 timeframe:
Late Wednesday tunnelled below ¥110, underpinning a retest scenario on Thursday, which, as you can see, welcomed fresh selling. Sustained pressure to the downside urges traders to take note of two Quasimodo support levels at ¥109.37 and ¥109.61.
North of ¥110, above the 100-period simple moving average around ¥110.21, supply is seen between ¥110.54-110.41 and ¥110.50-110.35.
The relative strength index (RSI) failed to find acceptance above the 50.00 centreline yesterday, with the value retreating to 40.00 by the session’s end. Indicator support set within oversold at 18.76, therefore, is in view.
Observed levels:
H1 Quasimodo support at ¥109.61 could draw bullish curiosity if challenged, a level bolstered by Fibonacci support between ¥109.48 and ¥109.70 on the H4 scale.
Though having recently witnessed both daily and H4 timeframes cut through trendline supports, sellers may still have the upper hand and push towards H1 Quasimodo support at ¥109.37 and H4 demand from ¥109.02-109.20.
GBP/USD:
Monthly timeframe:
(Technical change on this timeframe is often limited, though serves as guidance to potential longer-term moves)
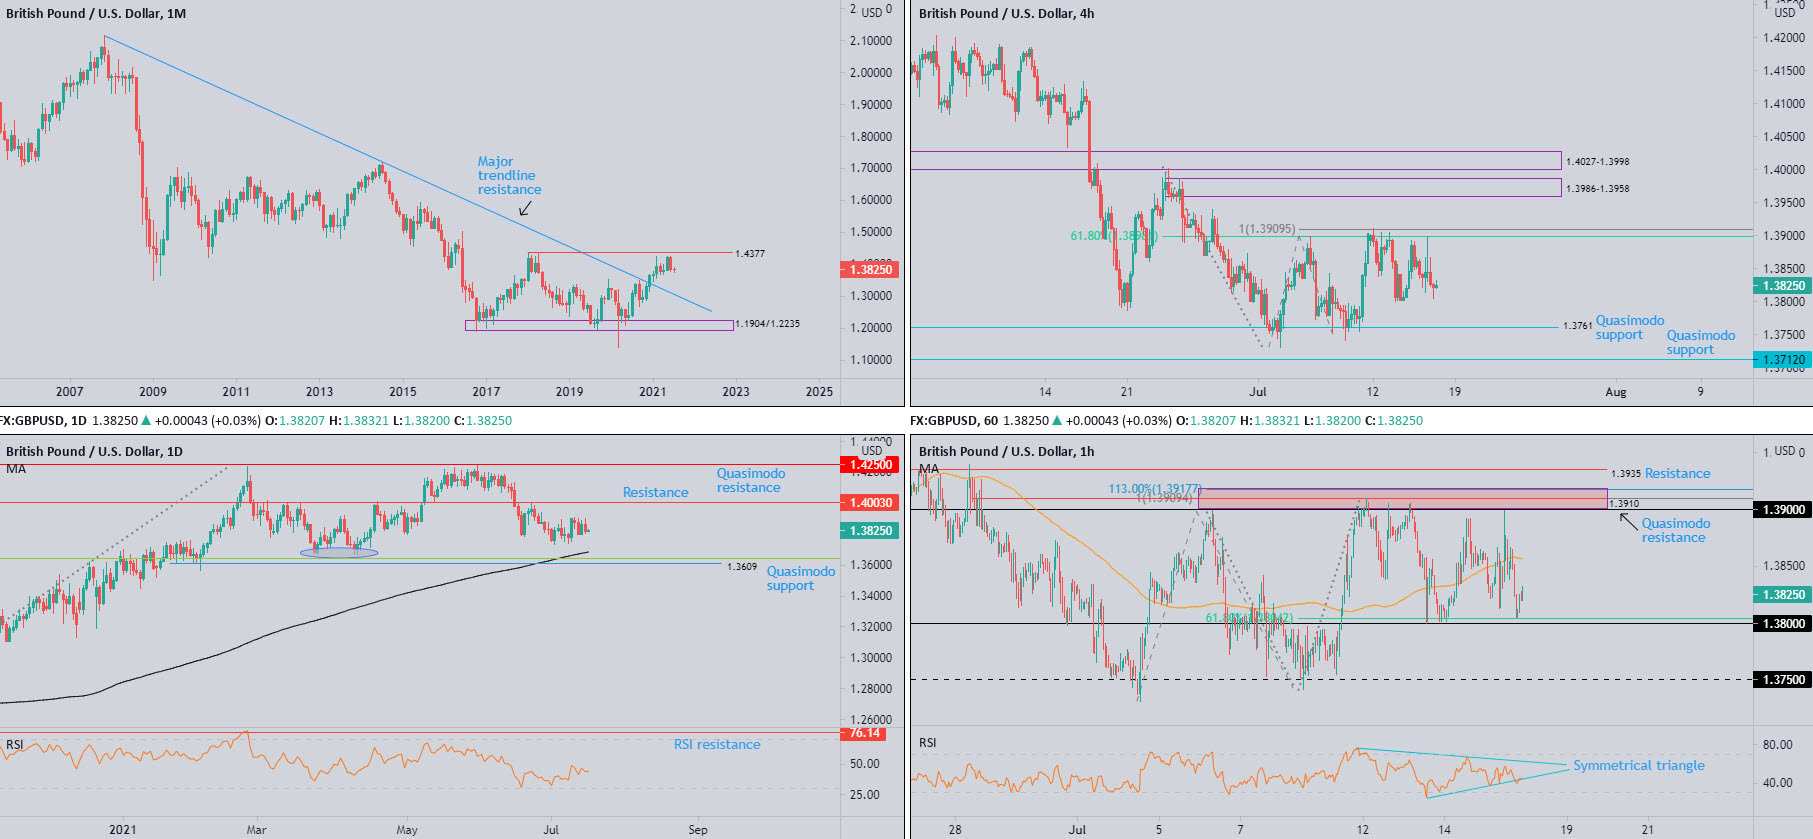
Since February, GBP/USD echoed an indecisive environment south of $1.4377: April high 2018. This follows December’s (2020) trendline resistance breach, taken from the high $2.1161, which could serve as support if retested.
July is currently unchanged.
Primary trend structure has faced lower since early 2008, unbroken (as of current price) until $1.4377 gives way.
Daily timeframe:
Technical Structure Unchanged from Previous Analysis.
Since the beginning of July, sterling has exhibited a narrow range versus the US dollar between $1.3901 and $1.3740.
Resistance at $1.4003 remains centre stage—a level displaying commitment since March of this year.
Quasimodo support at $1.3609 (connected with a 38.2% Fib retracement at $1.3641 and the 200-period simple moving average, circling $1.3686) is in the spotlight.
The relative strength index (RSI) continues to inch higher, yet reluctant to cross swords with the 50.00 centreline. Movement above here—showing average gains exceed average losses and momentum is therefore to the upside—could fuel a test of price resistance underlined above at $1.4003.
H4 timeframe:
The 61.8% Fib retracement at $1.3898 and a 100% Fib projection at $1.3909 continues to deliver resistance on the H4 scale. Space higher up on the curve casts light on supply from $1.3986-1.3958 and a resistance zone at $1.4027-1.3998.
Lower, familiar Quasimodo support is present at $1.3761, a level assisting buyers this month—located just north of another layer of Quasimodo support at $1.3712.
H1 timeframe:
Quasimodo resistance at $1.3910, together with a 100% Fib projection at $1.3909 (H4), a 1.13% Fib extension at $1.3918, and the $1.39 level, has served this timeframe well as a ceiling since 9th July. Area above points to resistance at $1.3935.
Equally interesting is $1.38—joined by a 61.8% Fib level at $1.3804—furnishing the chart with support since mid-July. Technical eyes will note the 100-period simple moving average circling between the two aforesaid areas at $1.3856.
Sub $1.38 unlocks support around $1.3750.
View from the relative strength index (RSI) shows the indicator in the process of forming what appears to be a symmetrical triangle between 76.87 and 24.82.
Observed levels:
Price is hovering nearby $1.38 on the H1 scale. Despite the base holding back sellers in recent days, and aligning with a 61.8% Fib at $1.3804, the level brings little to the table in terms of confluence. With that being said, the unit slicing through $1.38 should not surprise, with follow-through action perhaps taking aim at $1.3750 on the H1, a level partnering with H4 Quasimodo support at $1.3761.
Of course, H1 traders will also likely be keeping a close eye on resistance between $1.3918 and $1.39, given its connection with H4 Fibs at $1.3898 and $1.3909.
DISCLAIMER:
The information contained in this material is intended for general advice only. It does not take into account your investment objectives, financial situation or particular needs. FP Markets has made every effort to ensure the accuracy of the information as at the date of publication. FP Markets does not give any warranty or representation as to the material. Examples included in this material are for illustrative purposes only. To the extent permitted by law, FP Markets and its employees shall not be liable for any loss or damage arising in any way (including by way of negligence) from or in connection with any information provided in or omitted from this material. Features of the FP Markets products including applicable fees and charges are outlined in the Product Disclosure Statements available from FP Markets website, www.fpmarkets.com and should be considered before deciding to deal in those products. Derivatives can be risky; losses can exceed your initial payment. FP Markets recommends that you seek independent advice. First Prudential Markets Pty Ltd trading as FP Markets ABN 16 112 600 281, Australian Financial Services License Number 286354.


 Access +10,000 financial
instruments
Access +10,000 financial
instruments