
US equities have begun a new leg higher with the S&P again closing at an all-time weekly high, with the Nasdaq also setting a swing low as the Index turns higher to make a continuing decisive move above 13,000 points.
The most important chart in the world (along with the US10 year) is the US dollar Index (DXY) again pushing higher to again set a new 5 month high, as the price enters a Primary UP trend.
The results are Commodity prices beginning to consolidate as the USD rises with surrounding FX pairs declining.
Copper, Gold and Silver last week set bullish reversal patterns, setting up a potential run to higher resistance levels. US and Australian Bond Yields also consolidate at recent highs following sharp advances.
XJO WEEKLY
Price structure:
Although the XJO has been consolidating for the past nineteen weeks, the Index closed last Thursday at the high part of the range, setting up a bullish view for the coming shortened week.
The “tentative” trendline remains and will be monitored for a closing price below the line as an early signal of any further weakness.
The underlying primary trend remains UP.
Indicator: Relative Strength
The RSI indicator has remained over the key 50 level, last week turned higher again, this is a good signal of improving price momentum. The potential divergence signal has been negated, so the indicator remains a bullish signal for further positive price momentum.
The RSI should be monitored for a potential move below the key level of 50 to show a shift to bearish momentum.
Indicator: MACD
MACD remains a swing Sell signal, It should be acknowledged this indicator can be very slow to react on a weekly basis and may continue to track sideways in the coming weeks as it did during 2019.
Traders should notice the faster average (orange) is now turning down and has moved to a swing sell signal.
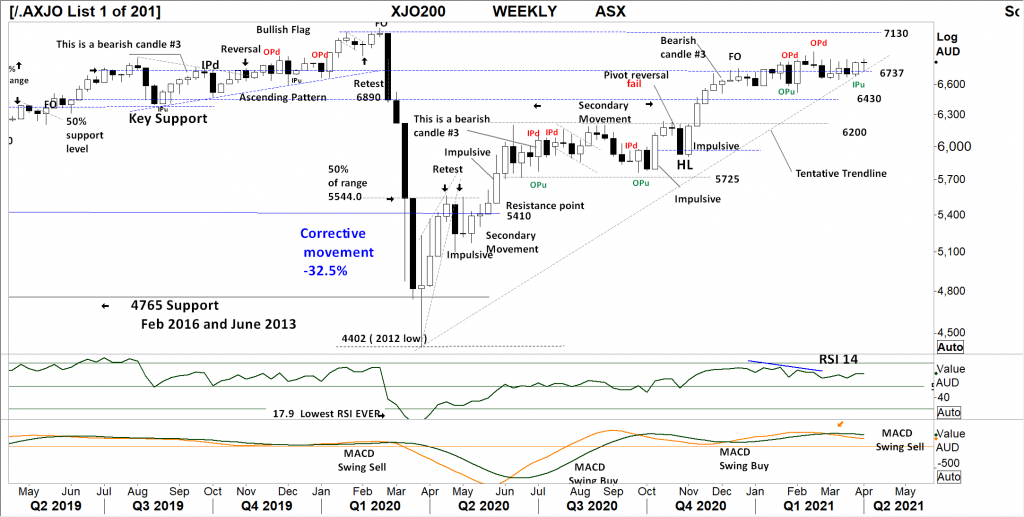
Comments from last week: Last week saw a solid price move towards the recent highs and an important close above the 6737 level. This will be the level to hold in the coming shortened week. With a strong close, but a relatively short range for the week, further consolidation would be ideal with the 7130-target resistance level in sight.
XJO DAILY
Price structure:
Early weakness last week has set a new higher low (HL) before meeting the longer term support level at 6655 points, with the Wednesday outside range testing the highs again.
Thursdays inside range shows the market in balance, so an early move either way this coming week will give direction for the short term traders.
Indicator: Relative Strength
With RSI making a new move above the key 50 level bodes well for further gains with a move above the 70 a signal of strong price momentum.
Indicator: VOLUME
Overall volume has been increasing as price rallies, Last Thursday’s high was not outstanding leading into the long weekend, otherwise Wednesdays high volume is a good signal of new accumulation taking place.
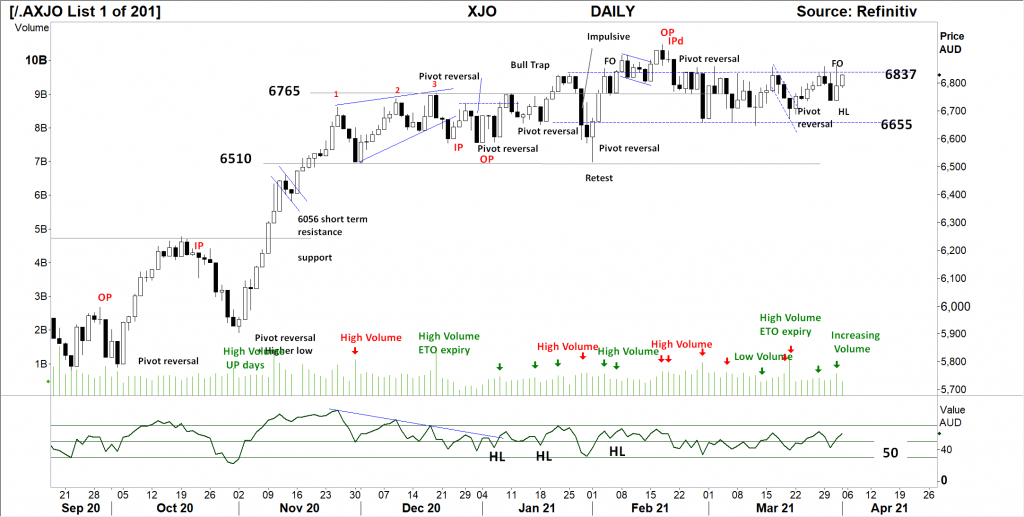
Comments from last week: Five trading days higher to test Daily resistance at 6837, the first close this week (Monday) will possibly signal the real strength or not in the market.
With a shortened week (4 days) expect some risk off into the close of the week (Thursday). The key psychological closing price level to hold on any price weakness is 6800 points.
Key stocks again this week will be the 4 banks along with the large materials BHP, RIO, FMG.
Selling in this area can bring the index back to daily support of 6655 points.
S&P 500 WEEKLY
Price structure:
All of the US Indices put in strong gains last week. The S&P500 shows a close at the high of the week and an all-time high.
AS stronger fundamentals begin to show the underlying markets will hold and react higher. This is not a time to “guess” taking a short position, the underlying PRIMARY TREND remains UP, and this stage there are no reversal signals.
Indicator: Relative Strength Indicator
Relative Strength remains above the key 50 level and had set a Bearish divergence from price. This divergence has now failed as the RSI turns higher as price again sets a new closing high.
Overall, the RSI is currently reflecting slower momentum as the indicator moves sideways, with further short range weeks, this can remain as a “grind” higher.
Should the RSI show a movement below the 50 level, this would signal strong bearish price momentum.
It should be acknowledged the RSI has also remained above the 50 level for the past 11 months.
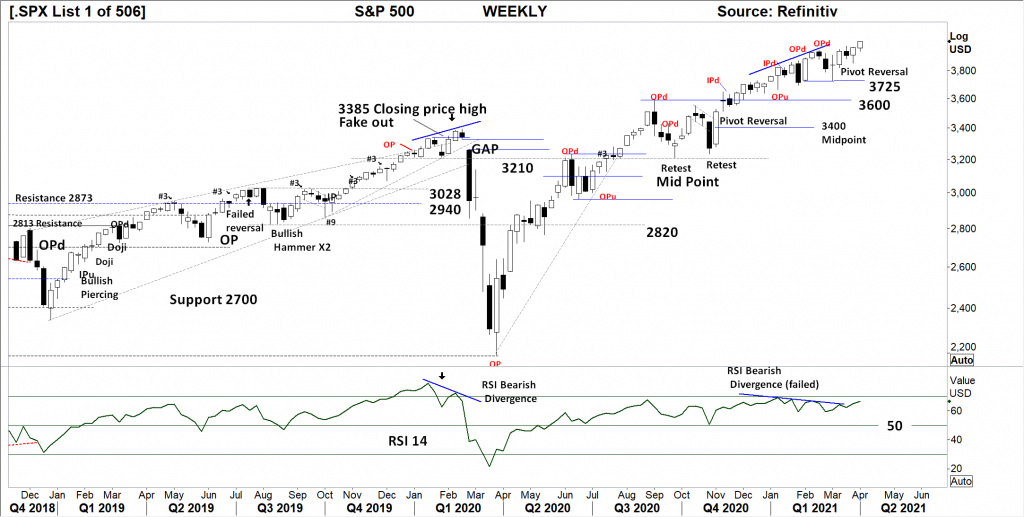
Comments from last week: The pivot point set 3 weeks ago has now played out into a new move higher.
Along with the retest of 3725 now complete, the all time closing high now remains a good signal for further gains in the coming weeks.
4000 points will be the big target for the index.
Traders should be aware the first signal of overall price failure will be a WEEKLY close below the 3725 level. This event would be significant leaving many buyers trapped above this level.
S&P 500 DAILY
Price structure:
The Daily chart of the S&P500 shows a short “retest” of the 3940 level followed by Thursdays close at the all time high, the range of the day is the strongest for the shortened week.
This bodes well for further gains, should price weakness start to show the 3940 will be the first level to hold, a close below this level would set a short term bear signal.
Indicator: Relative Strength
Relative Strength short term has turned sharply higher above the 50 level. The RSI should be monitored for a movement and continuing close above this 50 level and further move higher as upward momentum may gather pace with the current breakout from the bullish flag pattern.
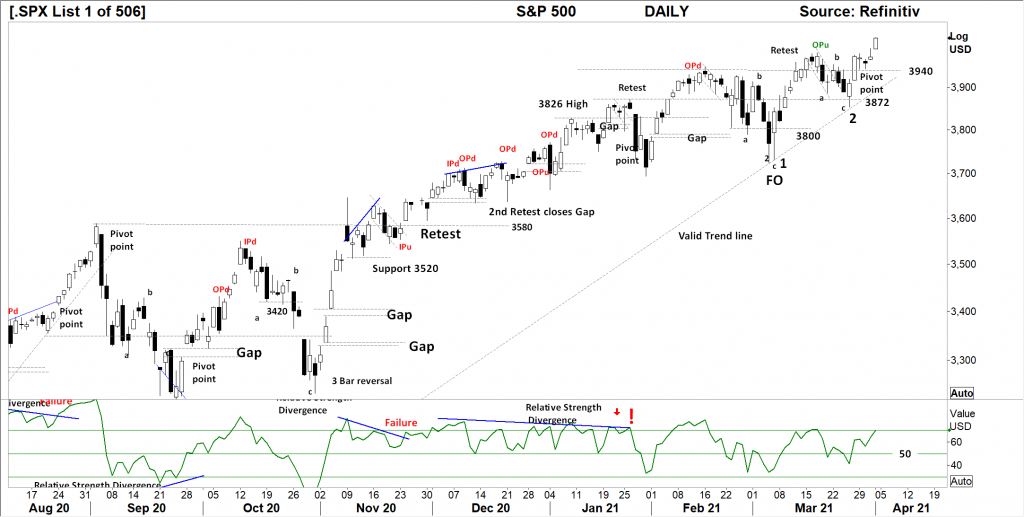
Comments from last week: The Daily chart has set a new Bullish Pivot point reversal following the Bullish flag completion and retest of 3872.
Fridays range the largest for the past 3 weeks and sets the tone for further gains. The Daily support level to hold is 3940, a close below this level would alert traders to the potential for further price weakness.
USD Spot GOLD – DAILY
Price structure:
A new Higher low (HL) was set last week, this is an important development in any turnaround story. The short term down trend line is broken and $1764 remains the upside target.
The breakdown across the long term trendline was short lived (1Day) and shows the buyers have entered the market.
Wednesday and Thursday are to very strong “low to high” days, and look to set the scene for higher prices.
The smaller speculative stocks will remain news dependant.
Indicator: Relative Strength
Relative Strength turns higher and fails to cross the key “50” level. This is an early signal of changing momentum and should be monitored for a close above the 50 level.
Look for a continued upturn in the RSI to confirm any potential price rally getting underway.
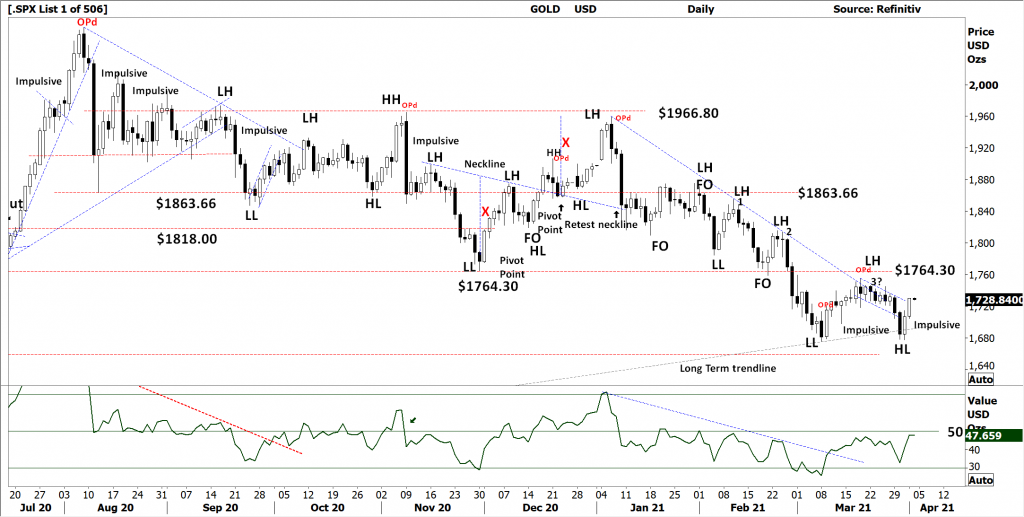
Comments from last week: The daily Gold price remains in consolidation along the down trend line, the current Bullish Flag is set to test the $1764.30 level on a potential breakout.
The ascending long term valid trend line remains in play as the first key support point ($1710) should price work itself lower.
Gold sits at the decision level for a breakout higher. Failure (break of the trendline) at this current level may see a fast retest of $1660.00.
AUD GOLD DAILY
Price structure:
The current higher low (HL) is a very important development for the overall structure of “trend”. A further close over the $2300 level would put the AUDUSD Gold price into a Primary up trend and remain very positive for local producers. Underlying Australian Gold producers, SLR, NCM, NST may see a strong bid in the coming week.
This will require the underlying $USD Gold price to remain strong and the $AUD to remain steady to lower.
Indicator: Relative Strength
With the RSI turning higher from below the key 30 level showing a changing momentum.
This momentum indicator continued swing higher again over the key 50 level in line with price gains to confirm a valid RSI buy signal.
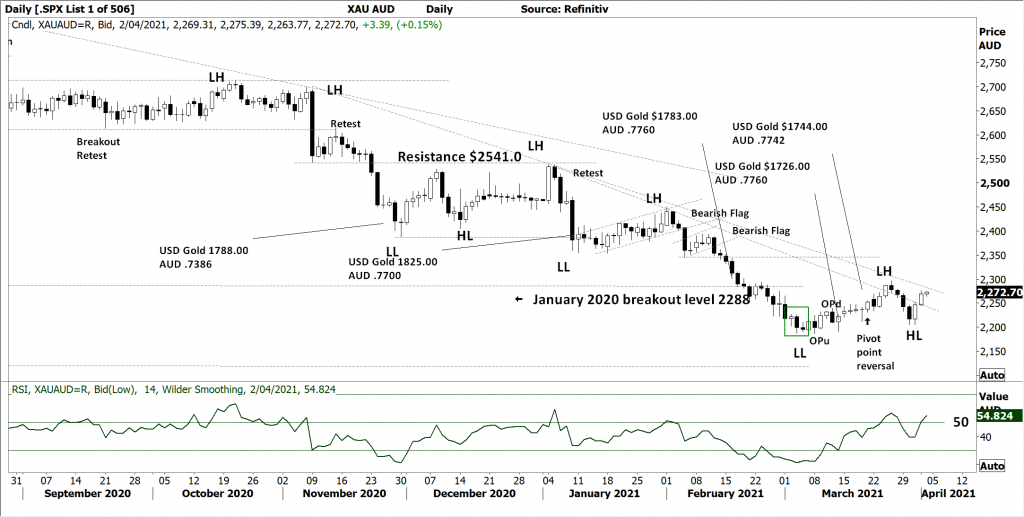
Comments from last week: As the $USD gains strength the $AUD remains under pressure, for Australian Gold producers this remains a positive as the AUD related Gold price moves higher increasing producers’ production and refining margins.
Overall, the Trend remains DOWN, it is important to acknowledge the short down trend lines are being challenged, giving the first signal of increasing upward momentum.
SILVER DAILY
Price structure:
Last week Silver set a bullish fake out (FO) with an immediate reversal to confirm a Bullish pivot point. That said, Silver remains within a Daily down trend, the earlier 3 bar reversal failed to set the low with key resistance at $26.00 remaining. This will be the first go to level for this current price rally should a breakout of the short down trend line occur.
Indicator: Relative Strength
Relative Strength has turned higher below the 50 level, operating in line with the underlying advancing price movement. A good signal for further improvement in price momentum would be a move above the 50 level. Wednesday – Thursday turn higher is a good start.
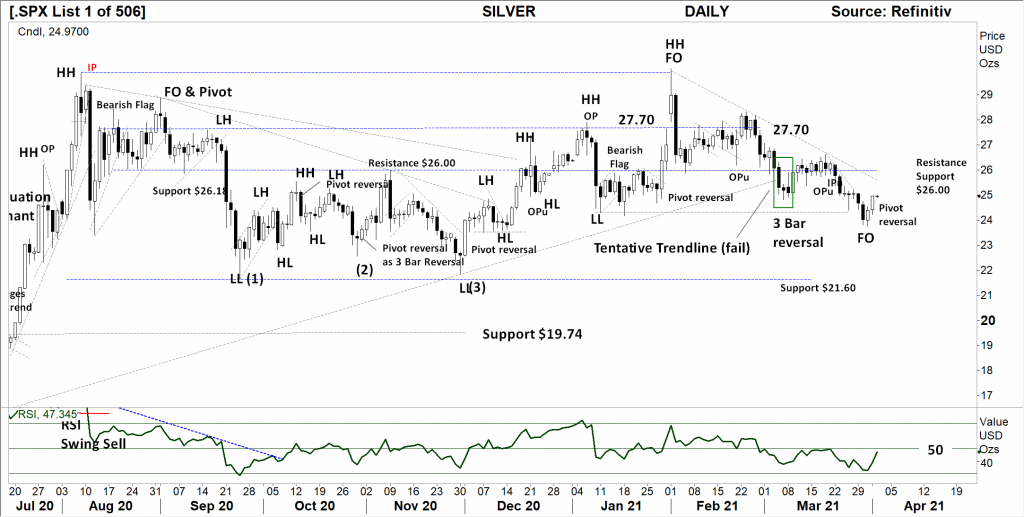
Comments from last week: Last Thursday the $24.30 was again retested with Friday a short-range day also setting a 2nd 3 Bar bullish reversal pattern. The $26.00 resistance level remains in play as the potential retest level on any upward momentum.
Two important levels are developing $24.30 support and $26.00 resistance, a close below or above these levels will be an important outcome for momentum traders in the coming weeks.
COPPER DAILY
Price structure: Inventories under pressure.
Persistent consolidation above the key $4.00 level remains a very bullish signal for further gains.
However, traders should aware the closing price is lowest for the past 5 weeks. A breakdown below the $4.00 level would bring further selling in the short term as holders protect profits.
The underlying fundamentals for remain extremely bullish for the coming 12 months with the potential for supply shortages.
Indicator: Relative Strength
Relative Strength has moved just below the 70 level.
An early BEARISH divergence signal has continued to develop. Further confirmation will shown as a move below the “70” level and below the internal low set during February. The highlighted level in red.
It should be remembered the RSI can track above the 50 -70 level for many weeks at a time and currently remains a signal of very strong price momentum.
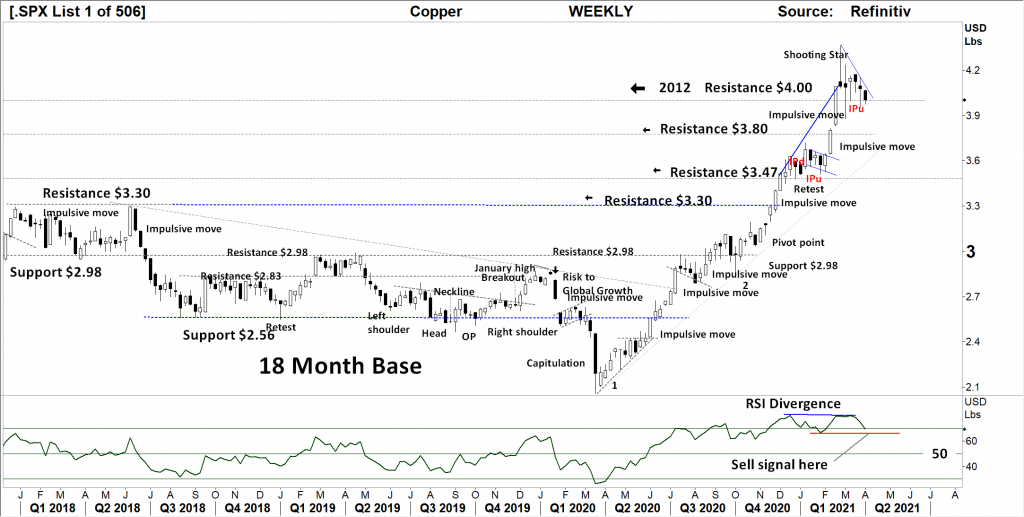
Comments from last week: Copper remains within a tight consolidation zone above the key $4.00 level. The test reject of 2 weeks ago remain in play for higher prices. The early signal of weakness may be the RSI (see below) turning lower, if accompanied by a strong close below the $4.00 level.
AUSTRALIAN VOLATILITY INDEX
Volatility continues to decline, last week closing reading of 11.9 is a bullish sign for further gains in the equities market for the coming week.
Bad news is being discounted as markets begin an accumulation phase.
A continuing close below the “13” level would be ideal for the bullish view to remain in place.
The XVI is the difference of 1-month forward pricing of ETO Options against current month.
As markets anticipate events, the forward priced option volatility changes, hence as forward price changes, this “skew” in pricing is measured in this XVI.
The XVI value works as an inverse observation to the underlying market.
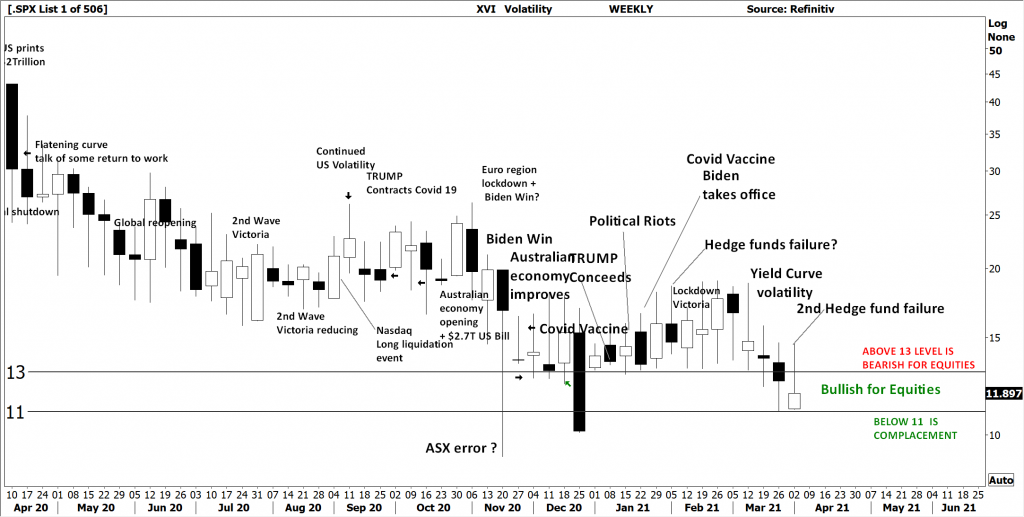
Comments from last week: A good move for local equities as the XVI moves and closes below the 13 level, indicates the falling requirement for forward “insurance” via PUT options. This current level will remain supportive for further gains in the XJO and XAO.
USD DOLLAR INDEX
Price structure:
The USD Index remains within a very strong daily UP trend, with a potential 2nd Bullish flag developing, markets would be cognisant of a breakout higher in the offering. The next resistance levels around the 94 – 95 area will offer some insight into the overall bullishness of this Index. Current price targets from the 2nd Bullish flag are set around 96 – 97.
Indicator: Relative Strength
While the RSI has made a sharp recovery above the 50 level and moved over the 70 level. Traders will look for an RSI to remain above the 50 level to confirm a more significant momentum move higher is underway, this remains highly probable.
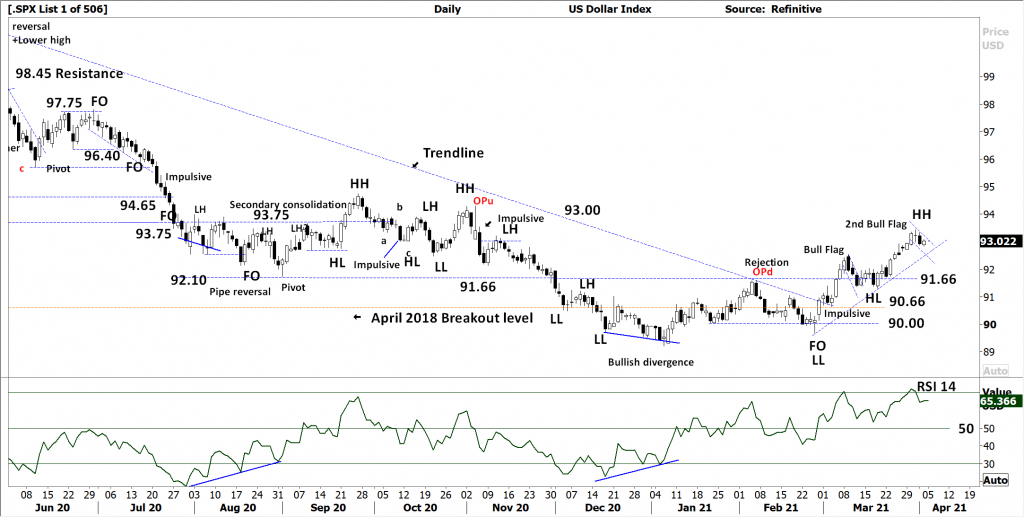
Comments from last week: A strong early breakout last week has ended in a short-range last Friday. What cannot be denied is the overall Bullish breakout above the long term down trend line and price remaining above the key 91.66 level.
This may have longer term pricing pressure in the commodities space, BUT this is yet to play out.
WTI CRUDE OIL
Price structure: This commodity is news driven by supply -demand.
The new “tentative” trend line is in place, last week WTI attempted to set a new low, but again found buyers to close towards the high of the week, BUT BELOW THE $61.80 level.
As the current structure still remains a bullish flag, a breakout higher could be expected.
$61.80 and $66.00 will remain the key levels of resistance in the coming days.
Indicator: Relative Strength
RSI turning higher over the 50 level and has now moved below the 70 level, momentum remains positive until a move below the key 50 level.
The indicator is “rolling” higher in line with current price consolidation closing towards the highs.
As the indicator moved over 70 and has now dipped below 70, this should also be monitored for a potential divergence signal in the coming weeks.
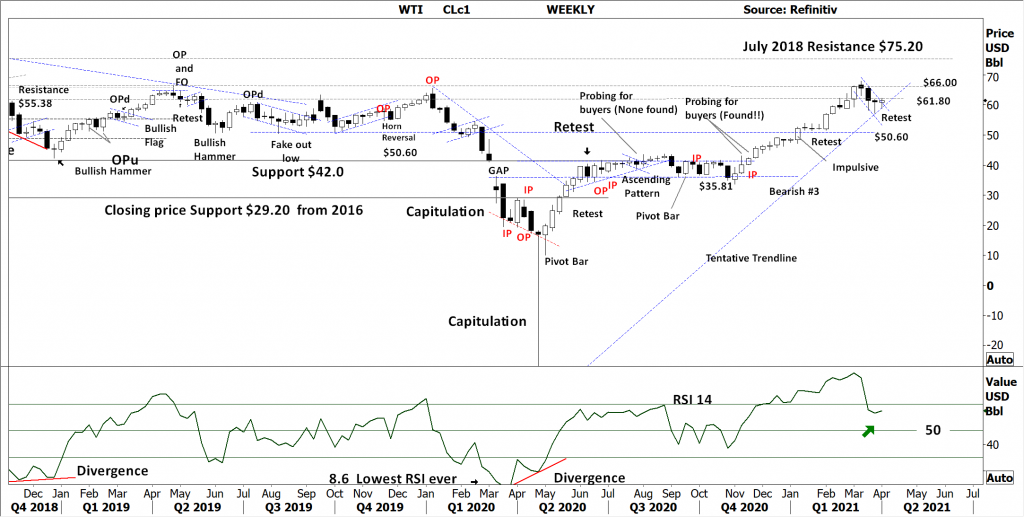
Comments from last week WTI is developing a Bullish flag pattern, the current close below the key level of $61.80 should be monitored as resistance in the coming days. A close over this level would be a strong signal for the Bullish view to remain place.
The trendline has been redrawn following the recent break and again remain a tentative line to hold in the coming weeks.
WTI remains within a Primary UP trend with $75.20 as the next upside target price.


 Access +10,000 financial
instruments
Access +10,000 financial
instruments