
EUR/USD:
Monthly timeframe:
(Technical change on this timeframe is often limited though serves as guidance to potential longer-term moves)
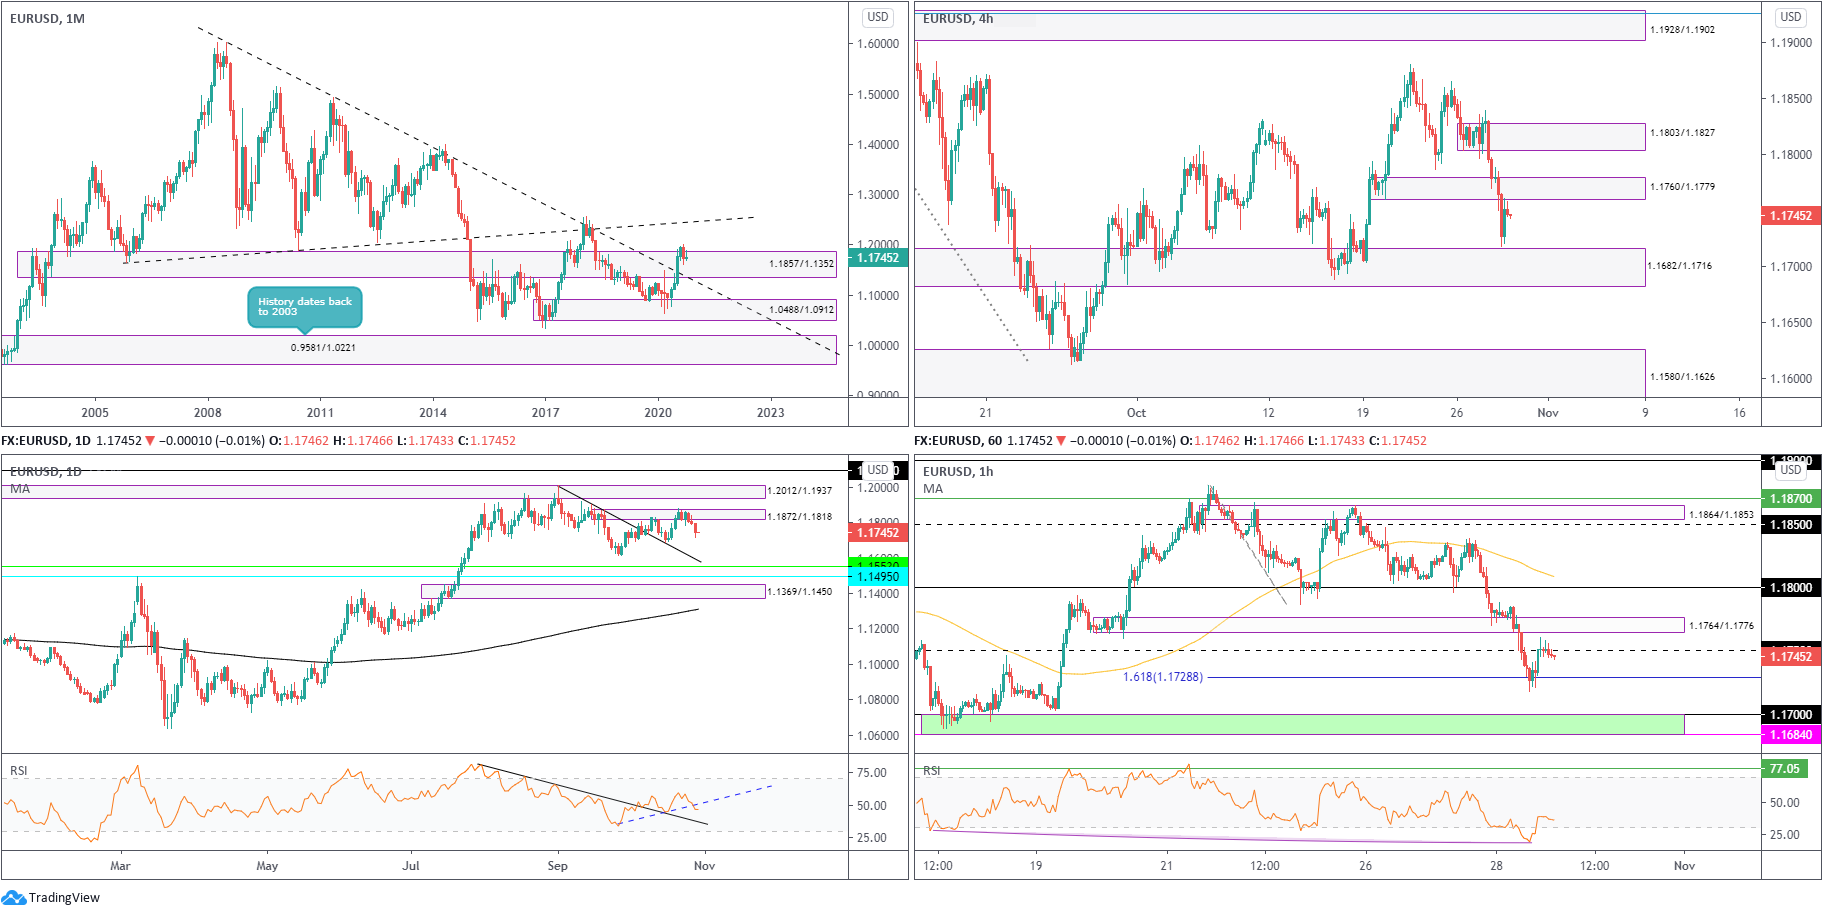
Following the break of long-term trendline resistance (1.6038) in July, buyers and sellers have since been squaring off around the upper section of supply from 1.1857/1.1352. Technically, this argues additional upside may be on the horizon, targeting ascending resistance (prior support – 1.1641).
Before seeking higher territory, though, a dip to retest the recently penetrated trendline resistance (support) could materialise.
The primary downtrend (since July 2008) remains intact until 1.2555 is engulfed (Feb 1 high [2018]).
Daily timeframe:
Partially modified from previous analysis –
After four successive daily bull candles formed off descending support (prior resistance – 1.2011), buyers and sellers traded blows around supply at 1.1872/1.1818, a rally-base-drop configuration. It was only until yesterday did sellers make an entrance, pushing for lows at 1.1717.
Addressing lower territory, however, throws light on support from 1.1553.
The RSI oscillator, for those who follow this particular indicator, will note the value recently flipped off trendline support (prior resistance), though recently close under another trendline support from 33.60.
H4 timeframe:
Demand at 1.1760/1.1779 came under pressure as buyers continued to ditch the euro for safe-haven dollars on Wednesday. This led to a near-test of a demand area from 1.1682/1.1716 and a subsequent 1.1760/1.1779 retest.
Areas of consideration beyond the noted zones can be seen at supply from 1.1803/1.1827 and demand at 1.1580/1.1626.
H1 timeframe:
Following Wednesday’s 0.4% decline, we reached a 161.8% Fib projection level at 1.1728, with price holding off this base and delivering a 1.1750 retest. Although the pair continues to emphasise resistance off 1.1750, supply also calls for attention at 1.1764/1.1776.
1.1728 giving way today unlocks the possibility of further selling towards 1.17 and support at 1.1684 (green).
Potential direction:
Holding off daily supply at 1.1872/1.1818, with H4 also fading supply at 1.1760/1.1779, an intraday sell from 1.1750 resistance could come to fruition today. However, before sellers change gears, do be aware we could witness a push to H1 supply at 1.1764/1.1776.
AUD/USD:
Monthly timeframe:
(Technical change on this timeframe is often limited though serves as guidance to potential longer-term moves)
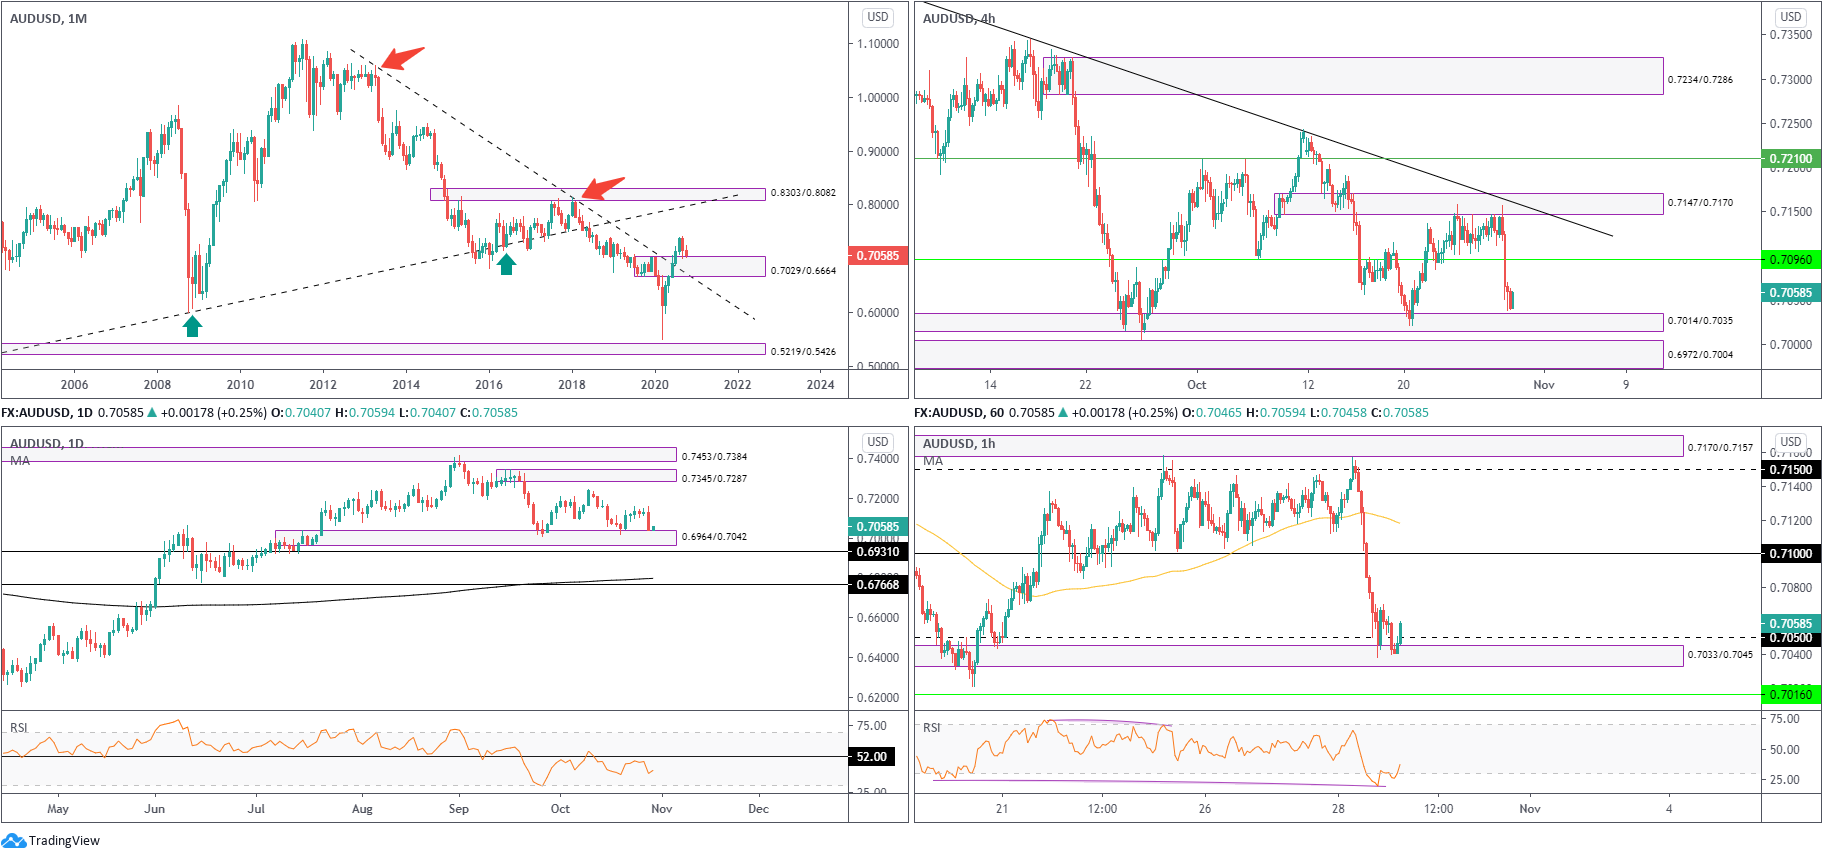
The month of September (lower by 2.9 percent) shattered a five-month winning streak and tested the upper border of demand at 0.7029/0.6664 (prior supply). Structurally speaking, therefore, buyers still have a strong advantage, free to explore as far north as 0.8303/0.8082 in the coming months, a supply zone aligning closely with trendline resistance (prior support – 0.4776).
In terms of trend, though, the primary downtrend (since mid-2011) remains south until breaking 0.8135 (January high [2018]).
Daily timeframe:
Recent flow withdrew to nearby demand at 0.6964/0.7042, with Wednesday plunging more than 1.2 percent and closing at session lows. Note this area is also secured a few pips above a support level coming in at 0.6931.
Clearing supports shines light on the 200-day simple moving average at 0.6798 and a neighbouring support level marked at 0.6931.
From the RSI oscillator, we are turning lower ahead of 52.00 resistance.
H4 timeframe:
Supply at 0.7147/0.7170 (prior demand), intersecting with trendline resistance (0.7413), was well received by sellers yesterday, as price tunnelled through support at 0.7096 and landed within a stone’s throw from demand at 0.7014/0.7035 (fixed just ahead of another demand at 0.6972/0.7004).
H1 timeframe:
The supply from 0.7170/0.7157 (mild rally-base-drop structure), secured within H4 supply at 0.7147/0.7170, received sellers on Wednesday. After a number of supports collapsed, US flows found some respite from demand at 0.7033/0.7045, confirmed by hidden RSI bullish divergence.
Taking out the nearby peak at 0.7060 could see buyers shift gears to approach 0.71.
Potential direction:
Each timeframe represents demand right now. For that reason, continued strength out of H1 demand at 0.7033/0.7045 may attract fresh bids today, with the 0.71 level targeted.
USD/JPY:
Monthly timeframe:
(Technical change on this timeframe is often limited though serves as guidance to potential longer-term moves)
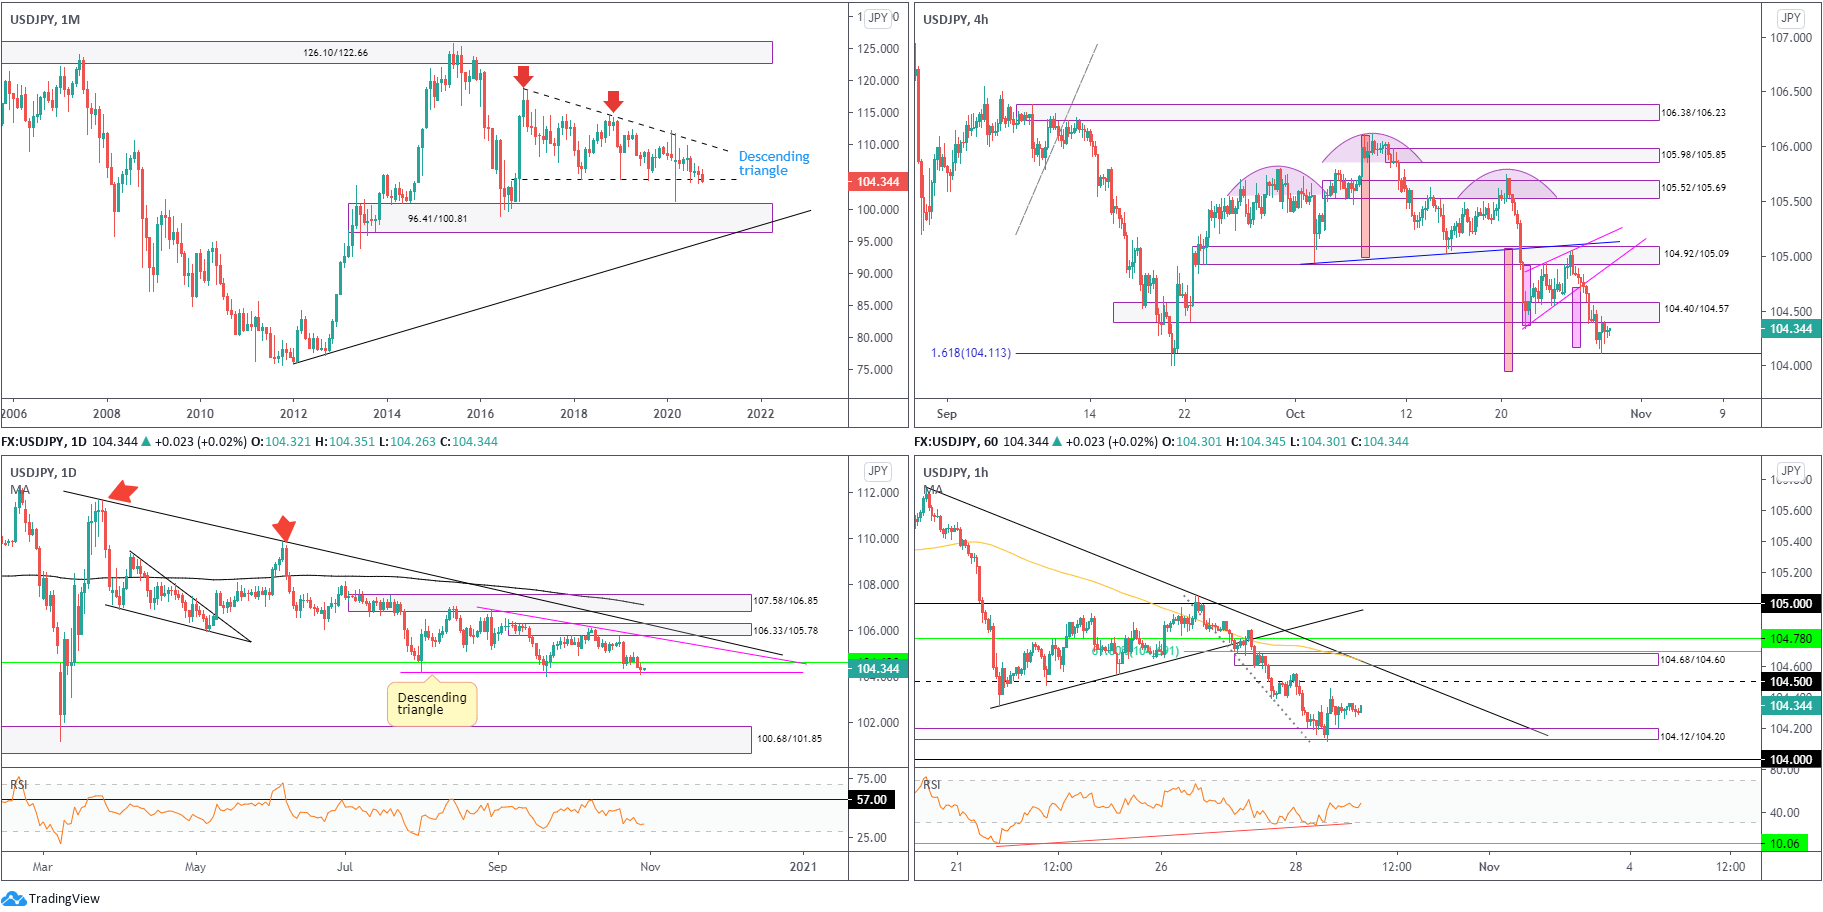
Since kicking off 2017, USD/JPY has been carving out a descending triangle pattern between 118.66/104.62. July 2020 onwards, as you can see though, has had price toying with the lower boundary of the aforesaid pattern. Notably, October is trading lower by more than 1 percent.
Areas of interest outside of the triangle can be seen at supply from 126.10/122.66 and demand coming in at 96.41/100.81.
Daily timeframe:
Brought forward from previous analysis –
Since August, daily price has also been in the process of shaping a descending triangle pattern between 106.94/104.18. Traders will also note the lower edge of the monthly descending triangle (green – 104.62) sits just north of the daily pattern’s lower border line.
Breaking beneath both the daily and monthly timeframe’s descending triangle supports (monthly currently under pressure) shifts focus back to daily demand at 100.68/101.85, fastened to the upper edge of monthly demand at 96.41/100.81.
H4 timeframe:
After penetrating the lower edge of a rising wedge (104.34/104.92) from supply at 104.92/105.09 (prior demand), Wednesday’s depreciation drilled through demand at 104.40/104.57 and greeted the rising wedge take-profit target (pink), seen fixed just ahead of a 161.8% Fib projection at 104.11. Note the head and shoulder’s take-profit target, as per the pattern’s rules of engagement, is still seen around 103.95 (red).
H1 timeframe:
Price action, from the H1 chart, discovered some support out of demand from 104.12/104.20 on Wednesday, though appears to have recently stumbled ahead of 104.50 resistance.
Upside shows that beyond 104.50, technicians may be watching supply at 104.68/104.60 (and 61.8% Fib level at 104.69 as well as trendline resistance), whilst south of aforesaid demand throws light on the 104 level.
Potential direction:
Until we cross under the daily timeframe’s descending triangle support, executing bearish positions might be a challenge, particularly for swing traders.
Despite the above, traders are likely expecting to see sellers emerge between H1 supply at 104.68/104.60 and 104.50 resistance (areas positioned just above H4 supply at 104.40/104.57).
GBP/USD:
Monthly timeframe:
(Technical change on this timeframe is often limited though serves as guidance to potential longer-term moves)
Leaving trendline resistance (2.1161) unopposed, the month of September fell 3.4 percent by way of a bearish outside reversal candle and snapped a three-month winning streak. This, in spite of October trading higher by 0.5 percent right now, advertises a possible dip to retest trendline support (prior resistance – 1.7191).
In terms of trend, the primary trend has faced lower since early 2008, unbroken (as of current price) until 1.4376 gives way – April 2 high 2018.
Daily timeframe:
Wednesday saw price extend its recent retracement beginning from just under resistance at 1.3201, enough to perhaps shine some light on demand at 1.2645/1.2773 (and the 200-day simple moving average).
Also noteworthy on this timeframe is the RSI oscillator seen testing 47.00 support.
H4 timeframe:
Trendline support (1.2687) made a show on Wednesday and, in spite of a mild whipsaw to lows at 1.2916, the ascending support held. Resistance at 1.3006, as well as supply from 1.3063/1.3020, however, could cause buyers to lose enthusiasm. Of particular interest is the supply given it was within this zone a decision was made to burrow through 1.3006 support.
Familiar demand at 1.2836/1.2881 is seen in case sellers take control; continued upside, on the other hand, could have the candles make their way to supply at 1.3116/1.3160 (prior demand).
H1 timeframe:
1.2950 welcomed rather aggressive price action on Wednesday, movement that brought in channel support (1.3019) and ultimately rebounded to 1.30 resistance. Whilst we are seeing some interest from sellers here, tasty resistance inhabits territory above in the form of 61.8% and 38.2% Fib levels at 1.3015, levels that join channel resistance (1.3176).
Potential direction:
Aligning just under H4 supply at 1.3063/1.3020, the H1 Fib/channel resistance confluence vibrates a bearish tone this morning, enough to potentially draw in sellers back towards 1.2950 support on the H1.

DISCLAIMER:
The information contained in this material is intended for general advice only. It does not take into account your investment objectives, financial situation or particular needs. FP Markets has made every effort to ensure the accuracy of the information as at the date of publication. FP Markets does not give any warranty or representation as to the material. Examples included in this material are for illustrative purposes only. To the extent permitted by law, FP Markets and its employees shall not be liable for any loss or damage arising in any way (including by way of negligence) from or in connection with any information provided in or omitted from this material. Features of the FP Markets products including applicable fees and charges are outlined in the Product Disclosure Statements available from FP Markets website, www.fpmarkets.com and should be considered before deciding to deal in those products. Derivatives can be risky; losses can exceed your initial payment. FP Markets recommends that you seek independent advice. First Prudential Markets Pty Ltd trading as FP Markets ABN 16 112 600 281, Australian Financial Services License Number 286354.


 Access +10,000 financial
instruments
Access +10,000 financial
instruments