
EUR/USD:
Monthly timeframe:
(Technical change on this timeframe is often limited though serves as guidance to potential longer-term moves)
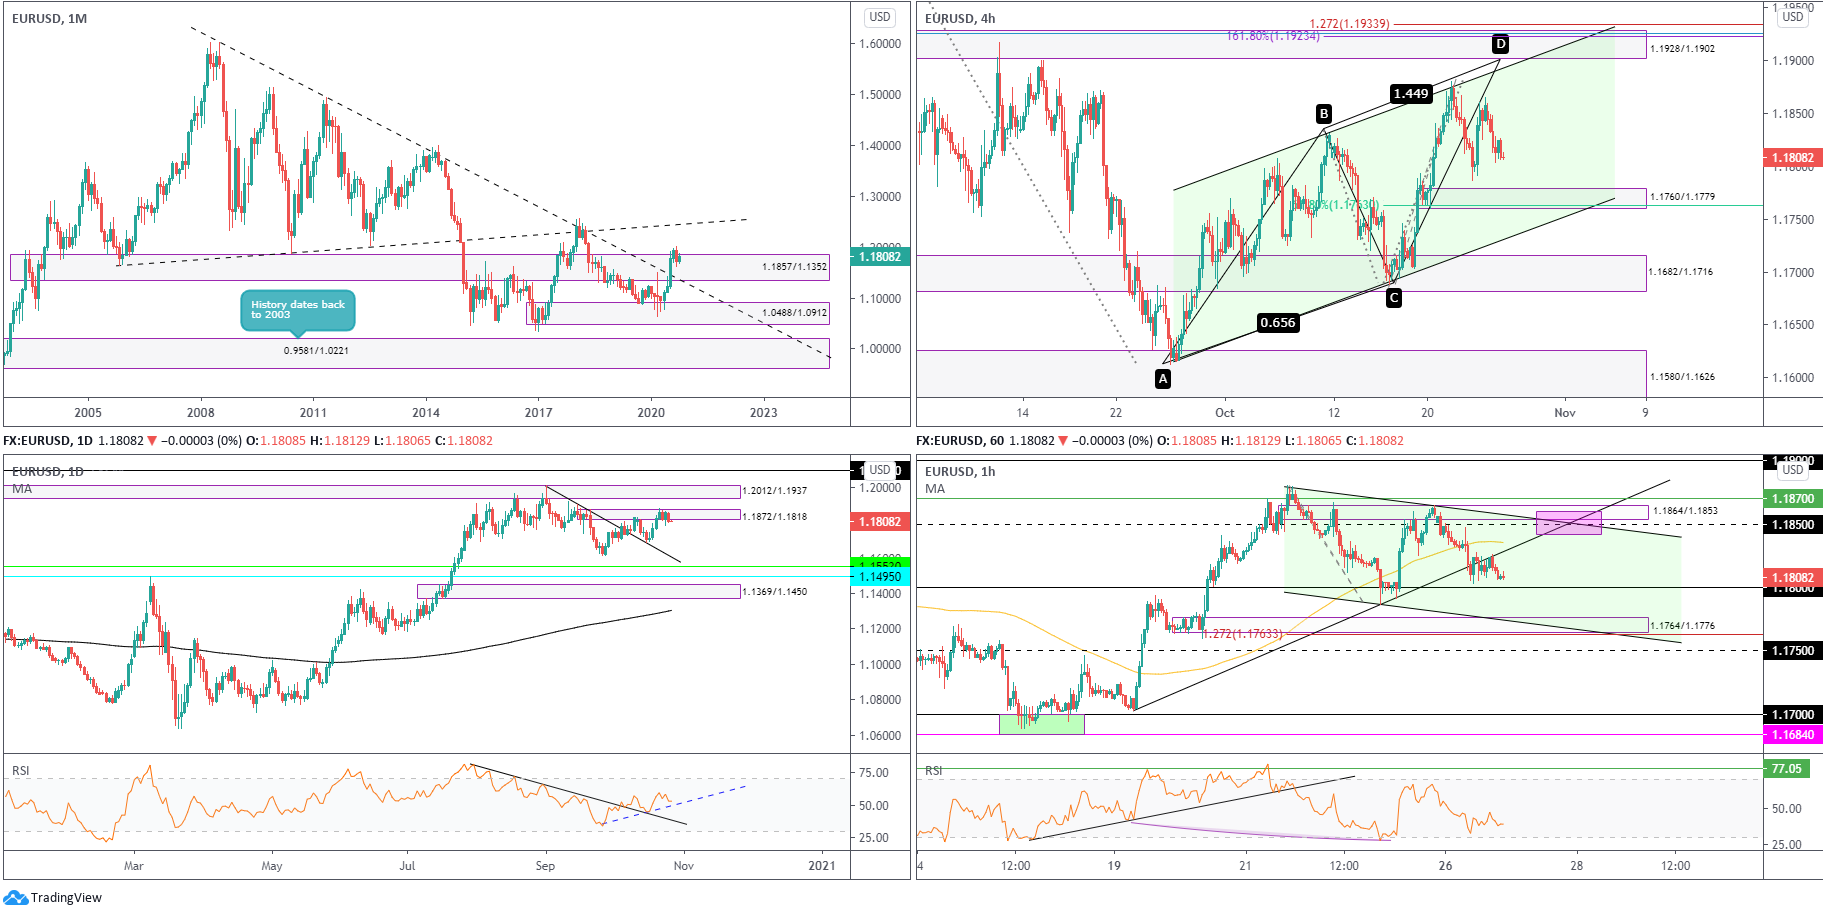
Following the break of long-term trendline resistance (1.6038) in July, buyers and sellers have since been squaring off around the upper section of supply from 1.1857/1.1352. Technically, this argues additional upside may be on the horizon, targeting ascending resistance (prior support – 1.1641).
Before seeking higher territory, though, a dip to retest the recently penetrated trendline resistance (support) could materialise.
The primary downtrend (since July 2008) remains intact until 1.2555 is engulfed (Feb 1 high [2018]).
Daily timeframe:
Partially modified from previous analysis –
After four successive daily bull candles formed off descending support (prior resistance – 1.2011), buyers and sellers are now seen trading around supply at 1.1872/1.1818, a rally-base-drop configuration.
Supply at 1.2012/1.1937, extended from May 2018, lies directly above current supply. Addressing lower territory, however, throws light on support from 1.1553.
The RSI oscillator, for those who follow this particular indicator, will note the value recently flipped off trendline support (prior resistance) and is in the middle of establishing a trendline support from 33.60.
H4 timeframe:
By submerging Friday’s advance Monday, EUR/USD now faces the possibility of crossing paths with demand at 1.1760/1.1779 and a 61.8% Fib level at 1.1763. Traders will also note channel support (1.1612) hovers just beneath the demand area.
North, we can see channel resistance (1.1830) shares a bond with a supply from 1.1928/1.1902, as well as an AB=CD bearish correction and 1.618% BC projection at 1.1923 (in addition to a 78.6% Fib level at 1.1926 and a 127.2% Fib projection at 1.1933).
H1 timeframe:
Volatility dried up considerably on Monday as we transitioned into European trading, seizing the underside of trendline support (1.1703).
1.18 is viewed as the next support on this timeframe, with a break unmasking demand at 1.1764/1.1776, together with channel support (1.1786) and a 127.2% Fib projection at 1.1763.
The north side of the chart, nonetheless, features resistance by way of supply from 1.1864/1.1853, two trendline resistances (1.1703/1.1880) and 1.1850 resistance.
Structures of Interest:
Price action on the monthly and daily timeframes, as you can see, represent an indecisive tone at the moment.
H1 appears ready to retest 1.18, yet H4 demonstrates possible follow-through selling beyond here to test H1 demand at 1.1764/1.1776, an area conveniently sitting within the limits of H4 demand at 1.1760/1.1779.
AUD/USD:
Monthly timeframe:
(Technical change on this timeframe is often limited though serves as guidance to potential longer-term moves)
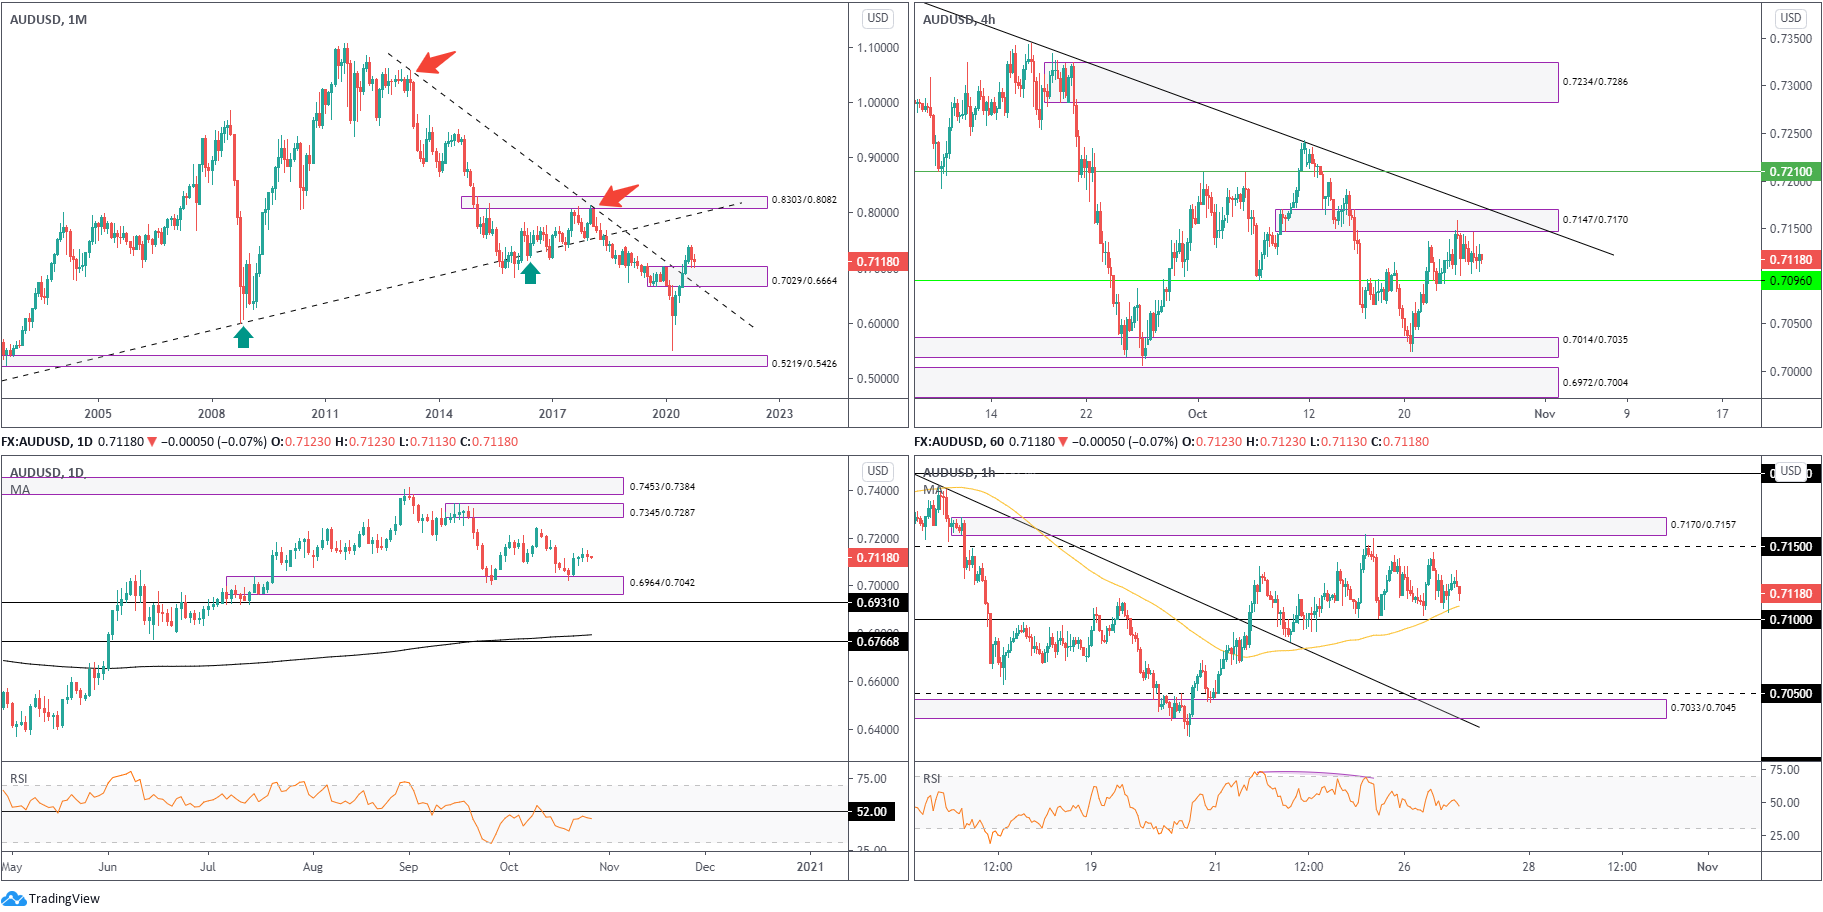
The month of September (lower by 2.9 percent) shattered a five-month winning streak and tested the upper border of demand at 0.7029/0.6664 (prior supply). Structurally speaking, therefore, buyers still have a strong advantage, free to explore as far north as 0.8303/0.8082 in the coming months, a supply zone aligning closely with trendline resistance (prior support – 0.4776).
In terms of trend, though, the primary downtrend (since mid-2011) remains south until breaking 0.8135 (January high [2018]).
Daily timeframe:
Brought forward from previous analysis –
Recent flow withdrew to deeper waters and cast light on nearby demand at 0.6964/0.7042, with Wednesday rebounding strongly from the said zone and highlighting the 0.7243 peak (Oct 9) and supply at 0.7345/0.7287 (a rally-base-drop supply). Friday and Monday, nevertheless, offered little in terms of volatility, with both days printing doji indecision candles.
In terms of the RSI oscillator, 52.00 resistance remains a key watch, with a break likely to persuade the indicator to approach overbought terrain.
H4 timeframe:
Brought forward from previous analysis –
Support at 0.7096 welcomed a retest on Thursday and guided price to supply at 0.7147/0.7170 (prior demand) on Friday, meeting closely with neighbouring trendline resistance (0.7413).
Monday was messy, offering little in terms of clear direction, therefore remained between the aforesaid areas.
Additional areas to be mindful of are demand at 0.7014/0.7035 and 0.7210 resistance.
H1 timeframe:
Partially modified from previous analysis –
AUD/USD continues to dance inside the 0.71 level and 100-period SMA as well as 0.7150 resistance and neighbouring supply from 0.7170/0.7157 (mild rally-base-drop structure).
Levels likely monitored beyond the aforesaid areas are demand at 0.7033/0.7045 and 0.7050 support, in addition to 0.72 resistance.
Structures of Interest:
As reported in Monday’s analysis, room to extend gains out of daily demand at 0.6964/0.7042, and monthly price testing the upper rim of demand from 0.7029/0.6664, enhances the possibility of a bullish theme.
0.71 and nearby 100-period simple moving average on the H1, on top of H4 support at 0.7096, is potentially watched support. H4 supply at 0.7147/0.7170 and trendline resistance, nonetheless, is problematic for buyers, yet knowing higher timeframes trade from demand could surpass any H4 arrangement.
USD/JPY:
Monthly timeframe:
(Technical change on this timeframe is often limited though serves as guidance to potential longer-term moves)
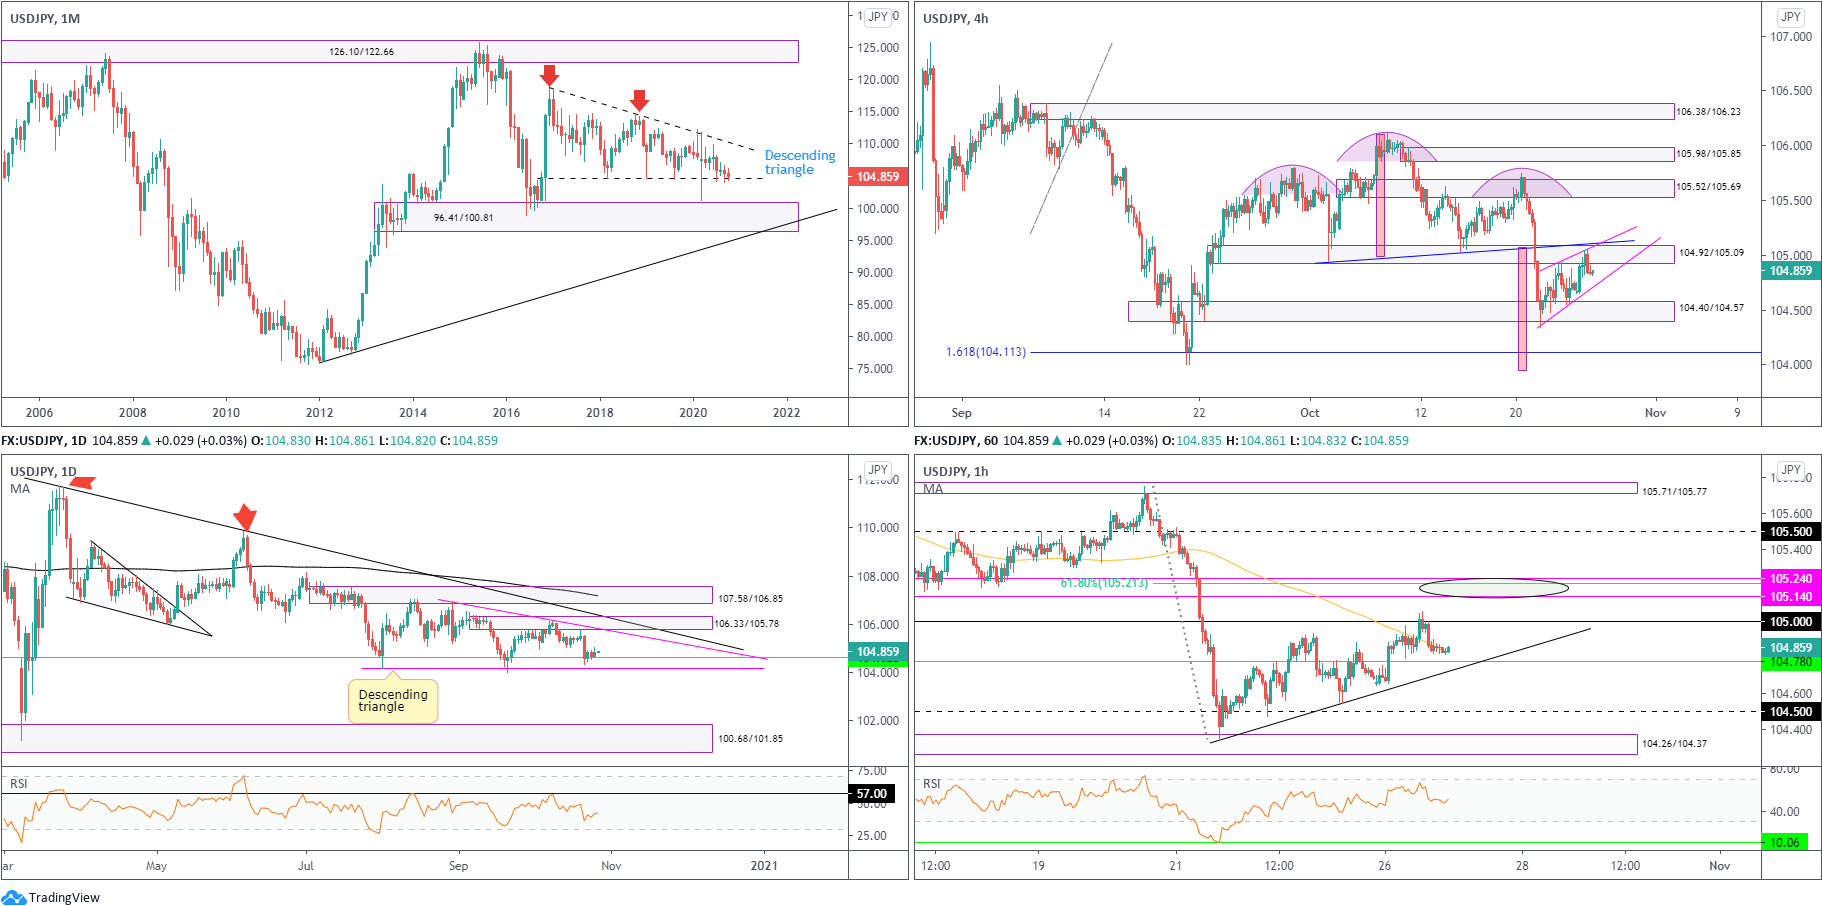
Since kicking off 2017, USD/JPY has been carving out a descending triangle pattern between 118.66/104.62. July 2020 onwards, as you can see though, has had price toying with the lower boundary of the aforesaid pattern.
Areas of interest outside of the triangle can be seen at supply from 126.10/122.66 and demand coming in at 96.41/100.81.
Daily timeframe:
Brought forward from previous analysis –
Interestingly, since August, daily price has also been in the process of shaping a descending triangle pattern between 106.94/104.18.
Traders will note supply at 106.33/105.78 aligns with the upper perimeter of the descending triangle, while the lower edge of the monthly descending triangle (green – 104.62) sits just north of the daily pattern’s lower border line.
Breaking beneath both the daily and monthly timeframe’s descending triangle supports shifts focus back to daily demand at 100.68/101.85, fastened to the upper edge of monthly demand at 96.41/100.81.
H4 timeframe:
Partially modified from previous analysis –
Wednesday’s energetic sell-off blew through a head and shoulder’s top pattern neckline, drawn from 104.94 (and demand at 104.92/105.09), and crossed paths with an area of demand at 104.40/104.57. Moderate buying developed thereafter, building what appears to be a rising wedge (104.34/104.92) into the base of 104.92/105.09.
Continued support off 104.40/104.57 feeds a possible 104.92/105.09 break and subsequent advance to supply at 105.52/105.69. Yet, selling could take on the head and shoulder’s take-profit target, as per the pattern’s rules of engagement, around 103.95 (red), arranged just south of a 161.8% Fib projection at 104.11.
H1 timeframe:
105 resistance, as you can see, did a superb job holding back buyers on Monday, forcing a mild close back through the 100-period simple moving average around 104.83.
Although 105 was clearly enough to tempt a bearish play and may draw in support at 104.78 (particularly at the point the level intersects with trendline support), a rally to the resistance area above at 105.24/105.14 (holds the 61.8% Fib level at 105.21 within) could be seen.
Structures of Interest:
Partially modified from previous analysis –
Longer term, we are at an interesting juncture, made up of monthly and daily descending triangle supports from 104.62 and 104.18, respectively.
Shorter term, a rebound from H1 support at 104.78 would not surprise, a move that is likely to topple 105 to reach for resistance at 105.24/105.14 (a point active selling could arise).
GBP/USD:
Monthly timeframe:
(Technical change on this timeframe is often limited though serves as guidance to potential longer-term moves)
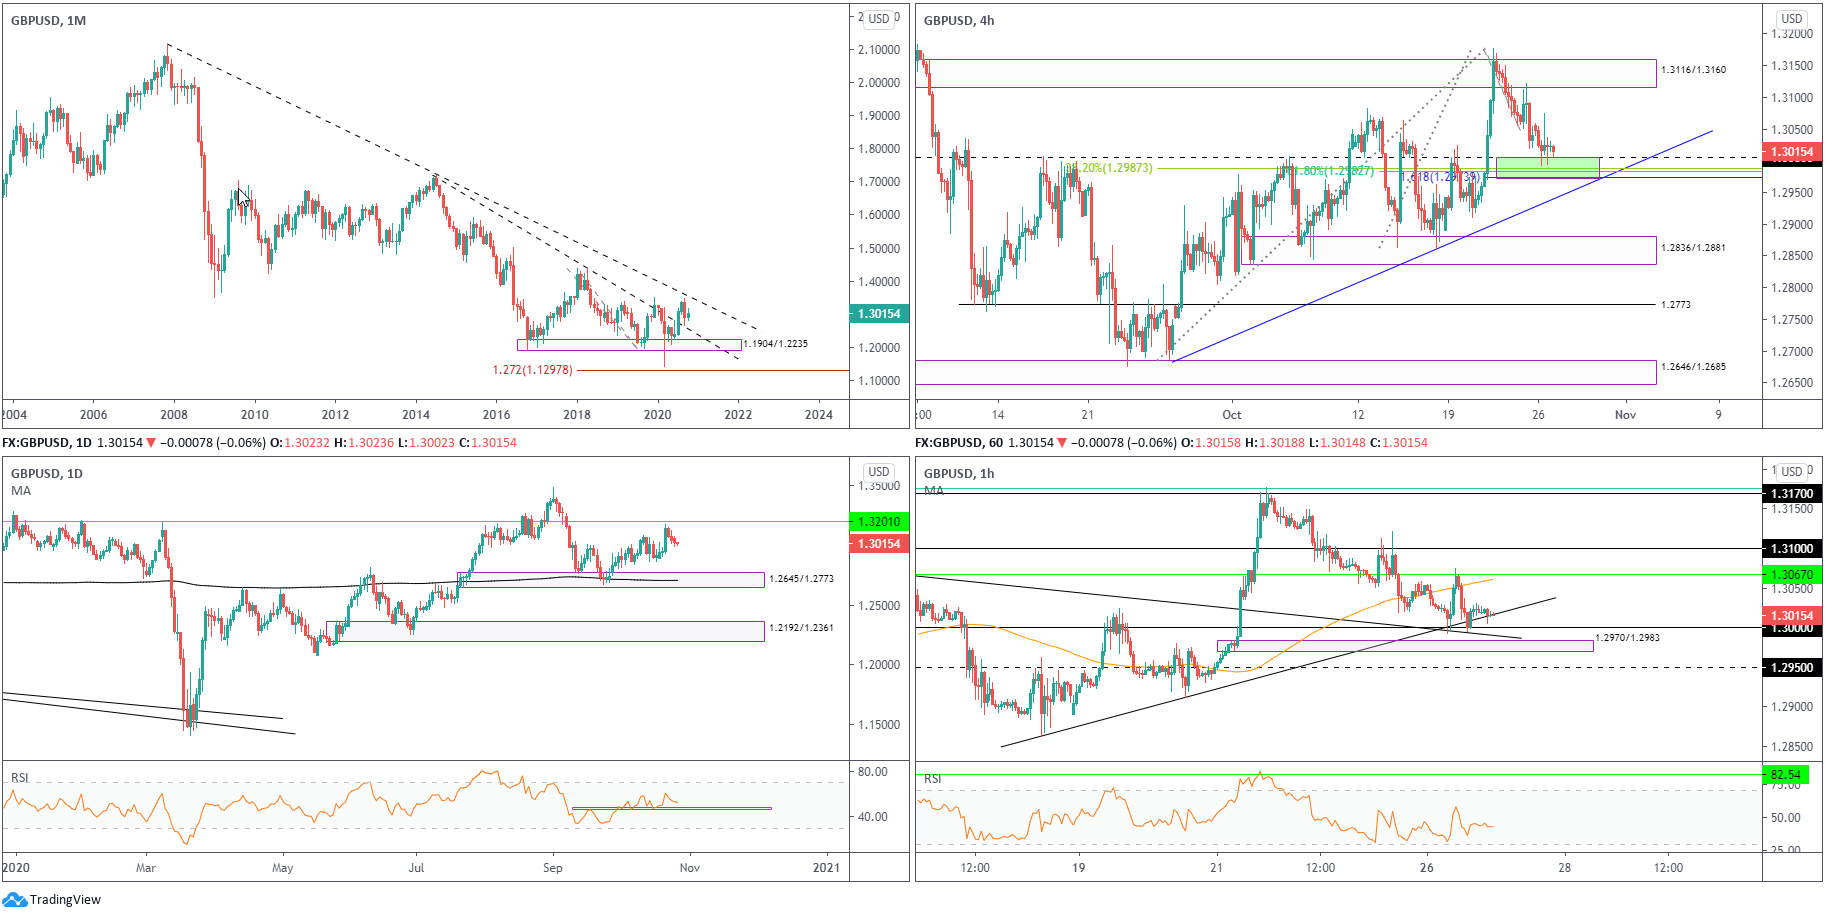
Leaving trendline resistance (2.1161) unopposed, the month of September fell 3.4 percent by way of a bearish outside reversal candle and snapped a three-month winning streak. This, in spite of October trading higher by 0.8 percent right now, advertises a possible dip to retest trendline support (prior resistance – 1.7191).
In terms of trend, the primary trend has faced lower since early 2008, unbroken (as of current price) until 1.4376 gives way – April 2 high 2018.
Daily timeframe:
Brought forward from previous analysis –
GBP/USD recently sailed to fresh pinnacles at 1.3176, surfacing a few pips below resistance at 1.3201.
Following this, the latter part of the week, and also Monday, saw a mild correction, though nothing to really get excited about and not yet enough to shine light on demand at 1.2645/1.2773 (and the 200-day simple moving average). Also noteworthy on this timeframe is the RSI oscillator attempting to make its way above 60.00, balancing off 47.00 support.
H4 timeframe:
Partially modified from previous analysis –
After discovering thin air above 1.3116/1.3160 supply (prior demand) last week, the charts highlighted an interesting zone of support (green) between 1.2973/1.3006 (formed from a collection of Fib studies and a support at 1.3006). Also worthy of mention is the nearby trendline support (1.2687).
As you can see, the aforesaid support zone made an entrance on Monday, though buyers were unable to pull off much, fading peaks around 1.3075.
H1 timeframe:
Partially modified from previous analysis –
In line with the H4 timeframe’s support zone at 1.2973/1.3006, the H1 timeframe reveals demand at 1.2970/1.2983, formed alongside two trendline supports (1.2862/1.3082) and the widely watched psychological level 1.30.
The above zone, an area underlined in Monday’s writing, served buyers well yesterday, enough to challenge resistance at 1.3067.
Structures of Interest:
Partially modified from previous analysis –
There are no immediate higher timeframe areas in play right now. Keeping an eye on the 1.3201 daily resistance, however, is recommended and also daily demand at 1.2645/1.2773, should further selling occur.
The combination of H4 support at 1.2973/1.3006 and H1 support at 1.2970/1.30 may remain supportive as we head into Tuesday, with price perhaps dethroning H1 resistance at 1.3067 to meet 1.31. Breaking below the zones, nevertheless, will likely see immediate support at 1.2950 develop.
DISCLAIMER:
The information contained in this material is intended for general advice only. It does not take into account your investment objectives, financial situation or particular needs. FP Markets has made every effort to ensure the accuracy of the information as at the date of publication. FP Markets does not give any warranty or representation as to the material. Examples included in this material are for illustrative purposes only. To the extent permitted by law, FP Markets and its employees shall not be liable for any loss or damage arising in any way (including by way of negligence) from or in connection with any information provided in or omitted from this material. Features of the FP Markets products including applicable fees and charges are outlined in the Product Disclosure Statements available from FP Markets website, www.fpmarkets.com and should be considered before deciding to deal in those products. Derivatives can be risky; losses can exceed your initial payment. FP Markets recommends that you seek independent advice. First Prudential Markets Pty Ltd trading as FP Markets ABN 16 112 600 281, Australian Financial Services License Number 286354.


 Access +10,000 financial
instruments
Access +10,000 financial
instruments