
EUR/USD:
Monthly timeframe:
(Technical change on this timeframe is often limited though serves as guidance to potential longer-term moves)
August, as you can see, toppled supply from 1.1857/1.1352 and extended space north of long-term trendline resistance (1.6038), arguing additional upside may eventually be on the horizon, targeting trendline resistance (prior support – 1.1641).
Before seeking higher territory, a dip to the recently penetrated trendline resistance (support) could materialise, backed by September’s monthly outside bearish reversal candle that snapped a four-month winning streak.
The primary downtrend (since July 2008) remains intact until 1.2555 is engulfed (Feb 1 high [2018]).
Daily timeframe:
Supply at 1.1872/1.1818, a rally-base-drop configuration, in addition to ascending resistance (prior support – 1.1695), made an entrance on Tuesday, following a 0.5 percent rally (third successive daily gain off ascending support [prior resistance – 1.2011]). Should buyers take charge, price taking on current supply and zeroing in on another layer of supply at 1.2012/1.1937 is a possible scenario.
The trend on the daily timeframe has displayed a bullish vibe since March. The RSI oscillator, on the other hand, recently flipped off trendline support (prior resistance).
H4 timeframe:
Following the formation of a demand area at 1.1760/1.1779, a spirited recovery took shape Tuesday and threw price into a supply zone at 1.1872/1.1838 (a rally-base-drop formation).
Above here, price action traders will also note channel resistance (1.1830), as well as a 127.2% Fib projection at 1.1893 and a supply at 1.1928/1.1902 that joins with an AB=CD bearish correction (and a 1.618% BC Fib projection at 1.1923).
H1 timeframe:
1.18 resistance, as you can see, was dethroned and retested (as a support level) during afternoon trading in London Tuesday, setting the stage for fresh weekly pinnacles at 1.1840.
Overhead, two trendline resistances linger close by (both drawn from the low 1.1615), backed by additional 1.1850 resistance and a 161.8% Fib projection at 1.1849.
RSI analysis also shows trendline support forming since last Thursday, with mild bearish divergence kicking in yesterday.
Structures of Interest:
Thanks to the recent advance so far this week, we’re dealing with some pretty heavyweight resistances. Most notably is daily supply at 1.1872/1.1818 and joining H4 supply at 1.1872/1.1838. However, the AB=CD bearish pattern at the underside of H4 supply from 1.1902 is also likely to appeal.
With that, active selling may develop from 1.1850 resistance on the H1. Failure to secure a position here may see buyers head for 1.19 resistance, essentially the lower ledge of H4 supply and AB=CD confluence.

AUD/USD:
Monthly timeframe:
(Technical change on this timeframe is often limited though serves as guidance to potential longer-term moves)
The month of September (lower by 2.9 percent) shattered a five-month winning streak and tested the upper border of demand at 0.7029/0.6664 (prior supply). Structurally speaking then, despite October trading lower by 1.6 percent, buyers still have the advantage, free to explore as far north as 0.8303/0.8082 in the coming months, a supply zone aligning closely with trendline resistance (prior support – 0.4776).
In terms of trend, though, the primary downtrend (since mid-2011) remains south until breaking 0.8135 (January high [2018]).
Daily timeframe:
Partially modified from previous analysis –
Leaving supply at 0.7345/0.7287 (a rally-base-drop supply) untested, recent flow withdrew to deeper waters and cast light on nearby demand at 0.6964/0.7042, an area secured above support at 0.6931.
Another key observation on the daily chart is the RSI oscillator fading support-turned resistance at 52.00, with the value now trading a touch under 40.00.
H4 timeframe:
Demand at 0.7014/0.7035 (located above another demand at 0.6972/0.7004), stretched from July 2020, made a show Tuesday and generated enough bullish interest to test (a pip short) supply at 0.7073/0.7097 (prior demand). Brushing aside the latter today provides a basis for a run to supply at 0.7147/0.7170 (prior demand).
H1 timeframe:
After aggressively whipsawing through the lower edge of demand at 0.7033/0.7045 to lows at 0.7020, early US on Tuesday staged a recovery to peaks at 0.7072.
The day, as you can see, ended retesting demand (and nearby 0.7050 support).
Structures of Interest:
Price testing monthly demand at 0.7029/0.6664, as well as daily demand at 0.6964/0.7042 places H1 demand at 0.7033/0.7045 in a solid position today, with 0.7067 initially targeted.

USD/JPY:
Monthly timeframe:
(Technical change on this timeframe is often limited though serves as guidance to potential longer-term moves)
Since kicking off 2017, USD/JPY has been carving out a descending triangle pattern between 118.66/104.62. July 2020 onwards, as you can see, has had price toying with the lower boundary of the aforesaid pattern.
Areas of interest outside of the triangle can be seen at supply from 126.10/122.66 and demand coming in at 96.41/100.81.
Daily timeframe:
Partially modified from previous analysis –
Supply at 106.33/105.78, encouraged by the RSI oscillator also fading resistance at 57.00, echoes a reasonably dominant presence on the daily chart. Traders will also note a trendline resistance (111.71) intersecting with the area and another nearby supply zone at 107.58/106.85 that aligns with the 200-day simple moving average at 107.29.
Monthly support at 104.62 (the lower boundary of the monthly descending triangle) lies beneath current price should sellers eventually improve their position.
H4 timeframe:
Current action is caught within an ascending channel pattern, pinched from a low at 105.05 and a high at 105.49; traders will have also noticed yesterday’s two-candle whipsaw above supply at 105.52/105.69 (prior demand). Demand at 104.92/105.09 (includes a 50.0% retracement) is seen on the hit list in the event channel support gives way, while a rejection targets supply seen at 105.98/105.85.
H1 timeframe:
Following an energetic rally to peaks at 105.75, activity that tested supply at 105.71/105.77 (prior demand), we headed sub 105.50 support into the close and are, as we write, retesting the underside of this barrier. It should also be pointed out that RSI trendline support suffered a hit in recent trading.
Folding over the nearby 100-period simple moving average at 105.38 today shines light on support at 105.24, with a break unmasking a 50.0% retracement level at 105.05 (green line) and 105 support.
Structures of Interest:
Longer term, technical structure offers contradictory views: monthly support at 104.62 suggests buyers could make a show, while daily price hovering under supply at 106.33/105.78 forecasts a dip.
Intraday, the H1 retesting (and holding for the time being) 105.50 resistance indicates additional bearish sentiment could be in the offing. The question, however, is whether sellers have enough energy to topple channel support on the H4 timeframe.

GBP/USD:
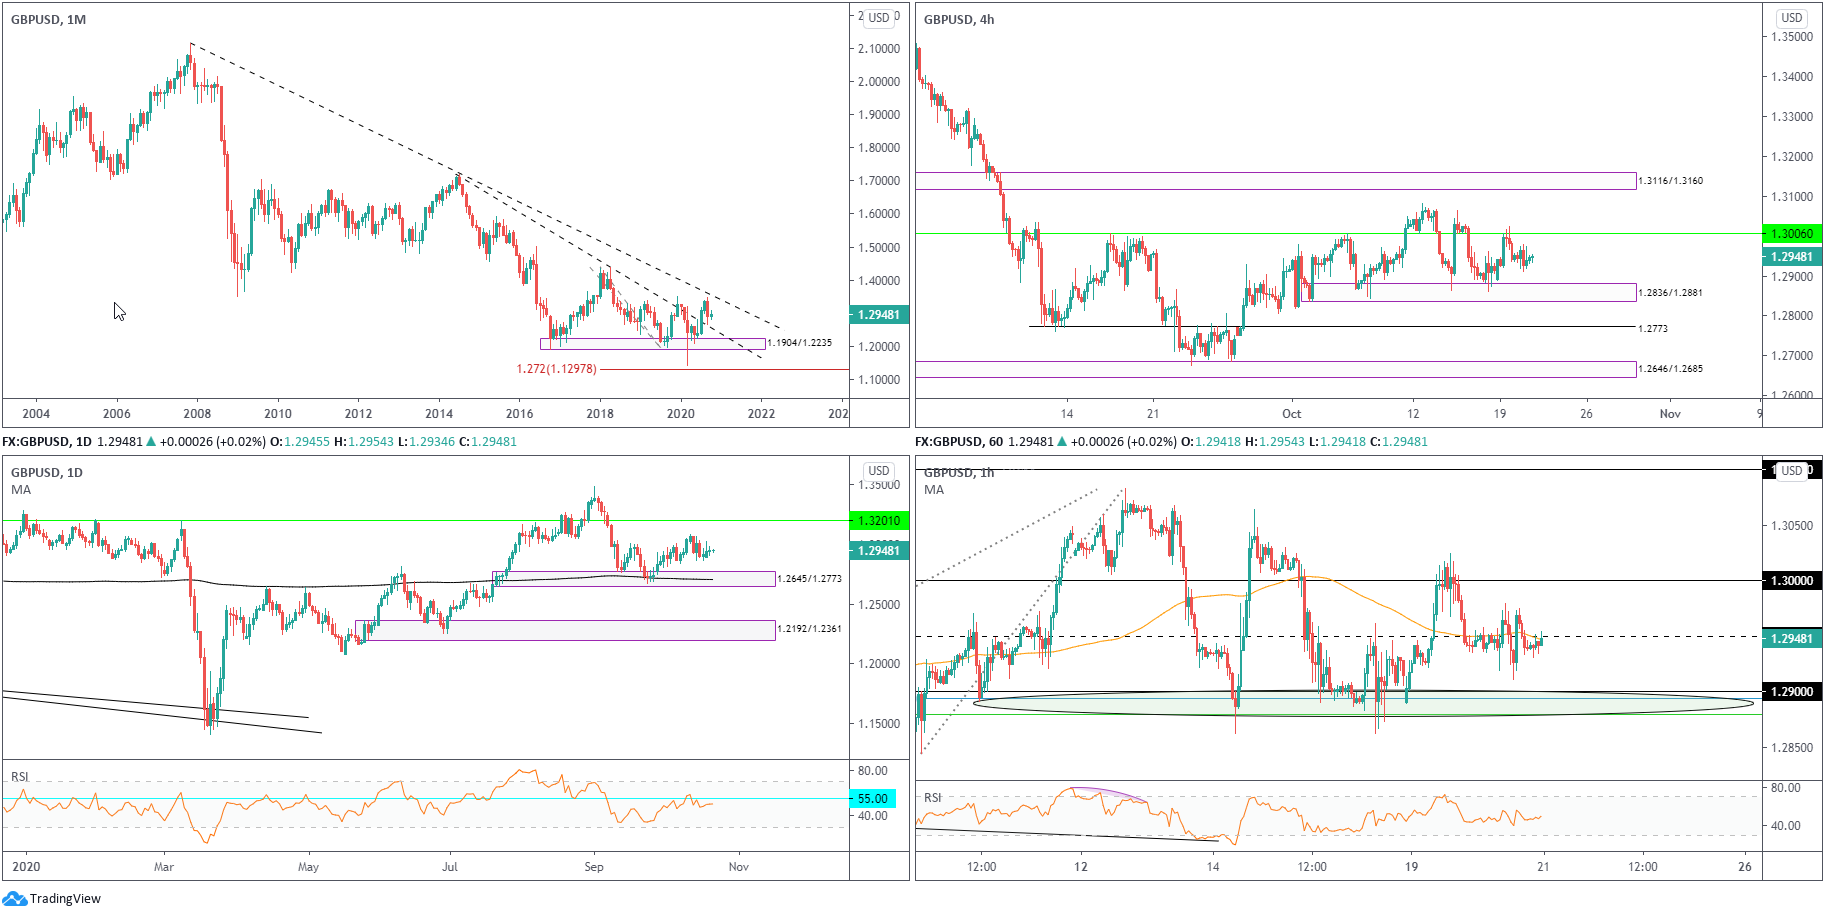
Monthly timeframe:
(Technical change on this timeframe is often limited though serves as guidance to potential longer-term moves)
Leaving trendline resistance (2.1161) unopposed, the month of September fell 3.4 percent by way of a bearish outside reversal candle and snapped a three-month winning streak. This advertises a possible dip to retest trendline support (prior resistance – 1.7191).
In terms of trend, the primary trend has faced lower since early 2008, unbroken (as of current price) until 1.4376 gives way – April 2 high 2018.
Daily timeframe:
Brought forward from previous analysis –
Demand at 1.2645/1.2773 (and 200-day simple moving average at 1.2706) is an area worth highlighting on the daily timeframe, due to it being a location a decision was made to break the 1.2813 peak (June 10).
Another area drawing attention is resistance at 1.3201.
RSI enthusiasts will also note the value recently met with 55.00 resistance.
H4 timeframe:
Partially modified from previous analysis –
Resistance at 1.3006 and familiar demand at 1.2836/1.2881, a drop-base-rally formation, remain firmly on the radar as we head into Wednesday’s session.
A decisive break to the upside uncovers supply around 1.3116/1.3160 (prior demand); additional selling, however, movement that dethrones the aforesaid demand, throws light on support at 1.2773.
H1 timeframe:
There’s really no two ways about it – the H1 chart is a mess.
1.29, however, has served well as support since October 8, helped by a 78.6% Fib level at 1.2894 (blue line) and a 50.0 retracement level at 1.2879 (green line). Though, as you can see, the area has suffered a number of whipsaws. The widely watched 1.30 level stands as resistance, with 1.2950, although proved a solid resistance into the latter part of last week, did little to hold price movement yesterday (despite sharing space with a 100-period simple moving average).
Structures of Interest:
Partially modified from previous analysis –
The bigger picture on GBP/USD shows technical elements favouring a bearish setting, at least until daily demand at 1.2645/1.2773 makes an entrance.
Shorter-term action, technicians are currently working with a collection of H1 supports around 1.29 and a H4 demand at 1.2836/1.2881. With this taken on board, a whipsaw through 1.29 into H4 demand could occur and, similar to last week, pencil in an intraday rebound.
DISCLAIMER:
The information contained in this material is intended for general advice only. It does not take into account your investment objectives, financial situation or particular needs. FP Markets has made every effort to ensure the accuracy of the information as at the date of publication. FP Markets does not give any warranty or representation as to the material. Examples included in this material are for illustrative purposes only. To the extent permitted by law, FP Markets and its employees shall not be liable for any loss or damage arising in any way (including by way of negligence) from or in connection with any information provided in or omitted from this material. Features of the FP Markets products including applicable fees and charges are outlined in the Product Disclosure Statements available from FP Markets website, www.fpmarkets.com and should be considered before deciding to deal in those products. Derivatives can be risky; losses can exceed your initial payment. FP Markets recommends that you seek independent advice. First Prudential Markets Pty Ltd trading as FP Markets ABN 16 112 600 281, Australian Financial Services License Number 286354.


 Access +10,000 financial
instruments
Access +10,000 financial
instruments