
Charts: Trading View
EUR/USD:
(Italics: previous analysis)
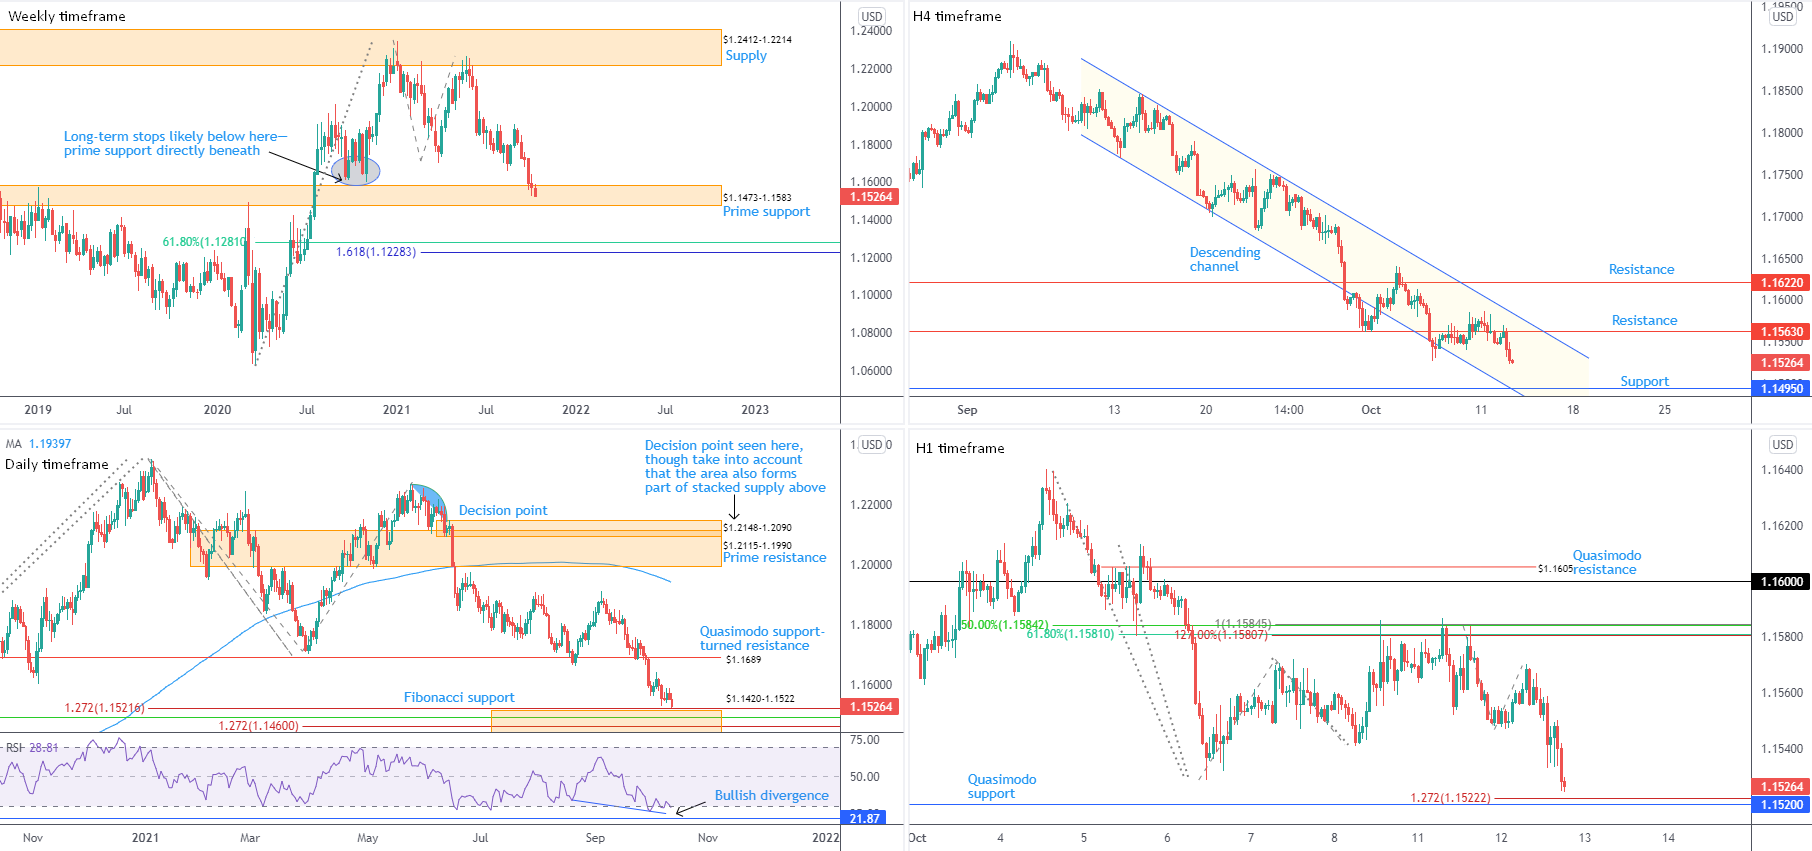
Weekly timeframe:
Down 0.4 percent heading into mid-week trade and refreshing yearly lows at $1.1525, prime support at $1.1473-1.1583 remains under pressure.
Selling—action breaching current support—exposes a 61.8% Fibonacci retracement at $1.1281, organised above a 1.618% Fibonacci projection from $1.1228. Further downside is in line with current trend studies, showing the break of lows at $1.1612 (2020) is perhaps the early phase of a bearish trend change.
The flip side, of course, is we witness buyer interest emerge due to long-term sell-stops tripped beneath $1.1612 lows.
Daily timeframe:
Bearish forces, as you can see, hauled Tuesday within reach of Fibonacci support between $1.1420 and $1.1522. Interestingly, this is an area fastened to the lower side of the weekly timeframe’s prime support. The question is whether this is sufficient to withstand selling pressure and boost confidence within weekly prime support.
In terms of the relative strength index (RSI), the indicator is in the early stages of establishing what’s referred to as hidden bullish divergence, sited around oversold territory.
H4 timeframe:
Movement on the H4 scale continues to operate inside a descending channel, shaped from a high of $1.1846 and a low from $1.1770. Of note, $1.1563 failed to find acceptance by way of support in recent candles and subsequently reverted back to resistance.
Medium-term sentiment facing southbound since June could pressure the currency pair south of support to take aim at channel support, and support at $1.1495 (early March 2020 high).
H1 timeframe:
Intraday flow out of the H1 chart Tuesday—thanks to recent declines—is in reach of Quasimodo support from $1.1520 and a 1.272% Fibonacci projection at $1.1522. Technically, these levels share chart space with the upper perimeter of the daily timeframe’s Fibonacci support between $1.1420 and $1.1522.
In the event buying is thin from $1.1522, watch $1.15 to develop support.
Observed Technical Levels:
Traders are urged to pencil in the possibility of buyers making a show from $1.1520 on the H1 scale, due to this level representing the upper boundary of support on the daily timeframe from $1.1522.
AUD/USD:
(Italics: previous analysis)
Weekly timeframe:
Buyers are beginning to emerge from prime support at $0.6968-0.7242. Prime resistance at $0.7849-0.7599 is a reasonable target, though failure to preserve gains opens up support at $0.6673.
Trend studies on the weekly scale show we’ve been higher since early 2020. Consequently, any decisive response from $0.6968-0.7242 might be the start of a dip-buying attempt to join the current trend.
Daily timeframe:
Unaffected by the dollar’s advance, the Australian dollar extended higher Tuesday, refreshing weekly tops at $0.7385.
Decorating the chart with additional upside has prime resistance at $0.7506-0.7474 in sight. Immediately above here, Quasimodo support-turned resistance is at $0.7621, which happens to join closely with the 200-day simple moving average at $0.7574, a 61.8% Fibonacci retracement at $0.7585 and a 100% Fibonacci projection at $0.7551.
Latest out of the relative strength index (RSI) reveals the value journeyed above the 50.00 centreline, informing traders that average gains exceed average losses: momentum is to the upside.
H4 timeframe:
Easing from one-month tops at $0.7385, movement came within touching distance of Quasimodo resistance at $0.7394 (enclosed within a 1.618% Fibonacci expansion at $0.7386 and a 1.272% Fibonacci projection at $0.7398) on Tuesday, clocking a low of $0.7347 before discovering modest respite.
Support falls in at $0.7317, while overthrowing noted resistance shifts focus to Quasimodo resistance parked at $0.7441.
H1 timeframe:
Early US Tuesday, sellers made an entrance and landed candles back within striking distance of support from $0.7339, leaving $0.74 unchallenged. This, as you can see, is a level that served buyers well earlier in the Asian session.
It should be noted that prime support resides directly beneath the said support at $0.7320-0.7327, with subsequent selling throwing light on $0.73 and trendline support, extended from the low $0.7170. Technicians will recognise $0.73 aligns closely with H4 support at $0.7317.
Observed Technical Levels:
In similar fashion to yesterday’s analysis, we know price on the weekly timeframe is coming from prime support at $0.6968-0.7242, in addition to the daily timeframe exhibiting scope to approach resistance at $0.7506-0.7474.
This, once again, positions H1 support at $0.7339 as a base buyers could show from, along with H1 prime support at $0.7320-0.7327—H4 support is visible beneath the aforementioned area at $0.7317.

USD/JPY:
(Italics: previous analysis)
Weekly timeframe:
Up 1.3 percent this week, and on track to chalk up a fifth consecutive weekly gain, supply at ¥113.81-112.22 remains under considerable pressure. Neighbouring resistance at ¥114.38, therefore, is a prominent base.
Clearing the aforementioned supply will raise eyebrows, in view of the area capping downside since April 2019.
Sellers taking the wheel directs flow to familiar demand at ¥108.40-109.41—arranged north of descending resistance-turned support, taken from the high ¥118.61.
In terms of the immediate trend, we’ve been advancing since the beginning of this year.
Daily timeframe:
The US dollar upheld a bullish spirit against the Japanese yen on Tuesday, boosted amidst a broad dollar bid—the US dollar index reached fresh 2021 peaks.
Clipped to the upper border of weekly supply, daily prime resistance at ¥113.93-113.07 is active. Traders based out of the daily timeframe may also acknowledge weekly resistance from ¥114.38 working with two 1.272% Fibonacci projections on the daily scale at ¥114.12 and ¥114.48.
From the relative strength index (RSI), following support emerging from 56.85 early last week, the indicator’s value is exploring overbought space. However, with the trend facing northbound this year, overbought signals should be viewed in this context.
H4 timeframe:
Recognising active weekly and daily supply zones, H4 activity is shaking hands with channel resistance, extended from the high ¥112.05, as well as a 100% Fibonacci projection at ¥113.74 and a 1.618% Fibonacci expansion at ¥113.90.
A retracement from the aforesaid resistances, shines the spotlight on support at ¥112.63, dovetailing closely with channel support, drawn from the low ¥109.12.
H1 timeframe:
Early London on Tuesday welcomed the decision point at ¥112.87-113.03 into the frame, an area encasing the psychological level ¥113. A sharp dip-buying formation ensued, leading to resistance at ¥113.71 putting in an appearance (shadowed by ¥114).
Between ¥114 and ¥113.71, knowing this area converges with H4 resistance structure (see above), a retreat to reassess the spirit of ¥112.87-113.03 could be in the offing.
Observed Technical Levels:
Technically, weekly, daily, H4 and H1 timeframes all indicate resistance. Consequently, between ¥114 and ¥113.71 on the H1 scale, a retracement back to the H1 decision point at ¥112.87-113.03 is possible—plotted just above H4 support from ¥112.63 and the upper boundary of daily demand at ¥112.66.

GBP/USD:
(Italics: previous analysis)
Weekly timeframe:
Supply-turned demand at $1.3629-1.3456 continues to emphasise a distressed atmosphere after having its lower limits clipped at the end of September. In spite of recovery attempts last week, it’s important to note price also closed below a double-top pattern’s ($1.4241) neckline at $1.3669, signalling bears are looking to take charge.
The double-top pattern’s profit objective—measured by taking the distance between the highest peak to the neckline and extending this value lower from the neckline—sits around $1.3093. Conservative pattern sellers are likely to pursue a candle close beneath $1.3629-1.3456 before pulling the trigger.
Daily timeframe:
The $1.3736-1.3659 decision point had its lower boundary tested Monday, with Tuesday finishing the session off best levels.
Trendline resistance, taken from the high $1.4250, and the 200-day simple moving average at $1.3840 are seen above; below is the $1.3412 low (29th September), with subsequent selling highlighting a Fibonacci cluster (support) around $1.3164.
Respecting the aforementioned decision point helps confirm bearish intent within the weekly timeframe’s supply-turned demand at $1.3629-1.3456, and reinforces the idea of a successful double-top pattern.
Momentum studies, according to the relative strength index (RSI), shows momentum has been to the upside since connecting with oversold at the end of September. The 50.00 centreline is a key watch and could form resistance, aiding a bearish picture from the decision point underlined above at $1.3736-1.3659.
H4 timeframe:
Support from $1.3570 capped selling Tuesday, following Monday’s dive from ascending resistance, projected from the low $1.3572.
Trendline resistance-turned support, taken from the high $1.3913, could offer a floor should current support at $1.3570 give way.
H1 timeframe:
Despite H4 support remaining intact at the close of trade Tuesday, the H1 timeframe unearthed a candle close south of $1.36. Recognising $1.36 giving way is viewed as a bearish signal, sterling making its way lower to test trendline support, drawn from the low $1.3415, is perhaps on the cards.
Moving through the noted trendline support unmasks $1.35 as a potential downside target.
Observed Technical Levels:
Chart studies underlining the daily timeframe’s decision point at $1.3659, combined with the H1 timeframe pushing below $1.36, informs traders that H4 support at $1.3570 is hanging by a thread.
H1 holding $1.36 on a retest may excite sellers, as would a H1 close below trendline support, taken from the low $1.3415.

DISCLAIMER:
The information contained in this material is intended for general advice only. It does not take into account your investment objectives, financial situation or particular needs. FP Markets has made every effort to ensure the accuracy of the information as at the date of publication. FP Markets does not give any warranty or representation as to the material. Examples included in this material are for illustrative purposes only. To the extent permitted by law, FP Markets and its employees shall not be liable for any loss or damage arising in any way (including by way of negligence) from or in connection with any information provided in or omitted from this material. Features of the FP Markets products including applicable fees and charges are outlined in the Product Disclosure Statements available from FP Markets website, www.fpmarkets.com and should be considered before deciding to deal in those products. Derivatives can be risky; losses can exceed your initial payment. FP Markets recommends that you seek independent advice. First Prudential Markets Pty Ltd trading as FP Markets ABN 16 112 600 281, Australian Financial Services License Number 286354.


 Access +10,000 financial
instruments
Access +10,000 financial
instruments