
EUR/USD:
Monthly timeframe:
(Technical change on this timeframe is often limited though serves as guidance to potential longer-term moves)
August, as you can see, toppled supply from 1.1857/1.1352 and extended space north of long-term trendline resistance (1.6038), arguing additional upside may eventually be on the horizon, targeting trendline resistance (prior support – 1.1641). Despite this, before seeking higher territory, a dip to the recently penetrated trendline resistance (support) could materialise.
The primary downtrend (since July 2008) remains intact until 1.2555 is engulfed (Feb 1 high [2018]).
Daily timeframe:
Partially modified from previous analysis –
After a fleeting advance north of support at 1.1553 and a subsequent period of inactivity around 1.1750, EUR/USD chalked up an animated bullish candle Friday with enough force to test supply at 1.1872/1.1818, a rally-base-drop configuration.
Monday, nonetheless, echoed a subdued tone amid thin trading conditions due to Columbus Day in the US, with price action remaining around the underside of the aforesaid supply.
The trend on the daily timeframe has displayed a bullish vibe since March, and the RSI oscillator recently took over trendline resistance. Together, these two factors may weaken the appeal of 1.1872/1.1818 supply and shine light on another supply coming in from 1.2012/1.1937.
H4 timeframe:
Partially modified from previous analysis –
The picture from the H4 timeframe reveals candle movement spent Monday’s session just south of channel resistance (1.1769). The latter, as you can see, closely shares space with supply at 1.1872/1.1838 (fits within daily supply at 1.1872/1.1818), a rally-base-drop formation, which is also joined by a collection of Fib levels.
Fresh selling is likely to target channel support (1.1684), while should upside gain speed buyers could embrace supply at 1.1928/1.1902 (prior demand).
H1 timeframe:
In spite of Monday’s uninspiring performance, price readers did observe the H1 candles whipsaw into stops under the 1.18 level and challenge a demand at 1.1790/1.1772 (prior supply). The reaction from the area, likely fuelled on sell-stop LQ, drew price to highs at 1.1816, potentially calling for another wave of buying towards a 127.2% Fib proj. level at 1.1836 (located just under 1.1850 resistance).
Interestingly, the RSI oscillator also spun higher from trendline support and finished the day just above 50.00.
Structures of Interest:
Intraday buyers off 1.18 are likely eyeballing the H1 127.2% Fib proj. level at 1.1836 as initial resistance, which aligns closely with the lower boundary of H4 supply at 1.1838.
For sellers, however, the combination of H4 supply at 1.1872/1.1838 as well as daily supply at 1.1872/1.1818, along with the H4 fib levels located within the aforementioned H4 supply, could be of interest.

AUD/USD:
Monthly timeframe:
(Technical change on this timeframe is often limited though serves as guidance to potential longer-term moves)
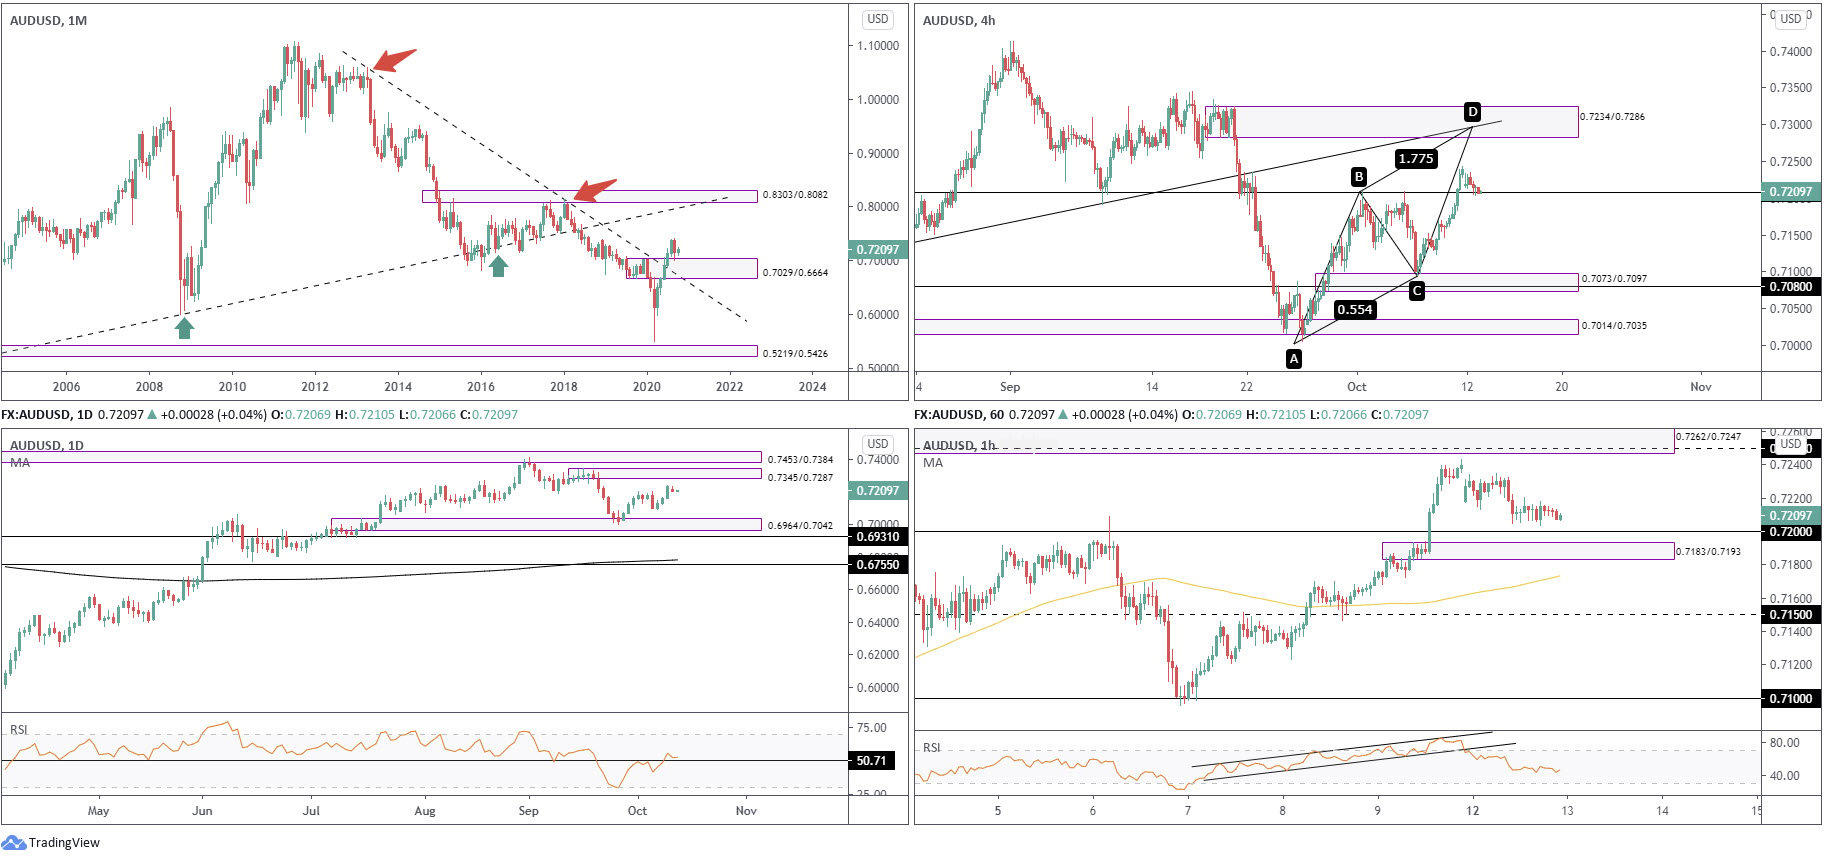
The month of September (lower by 2.9 percent) snapped a five-month winning streak and tested the upper border of demand at 0.7029/0.6664 (prior supply). From a structural standpoint, buyers appear to have the upper hand, free to explore as far north as 0.8303/0.8082 in the coming months, a supply zone aligning closely with trendline resistance (prior support – 0.4776).
In terms of trend, though, traders might want to take into account the primary downtrend (since mid-2011) remains south until breaking 0.8135 (January high [2018]).
Daily timeframe:
Brought forward from previous analysis –
Three successive daily bullish candles, with Friday scoring 1 percent, positions a rally-base-drop supply formation at 0.7345/0.7287 in sight, shaded closely by another area of supply at 0.7453/0.7384.
Other key observations on the daily timeframe are demand at 0.6964/0.7042, and the fact AUD/USD has traded northbound since early 2020. Additionally, RSI momentum also ousted 50.71 resistance last week, en route to perhaps challenge overbought levels.
H4 timeframe:
Brought forward from previous analysis –
Supply at 0.7234/0.7286 is an interesting location on the H4 chart, positioned within the lower boundary of daily supply at 0.7345/0.7287. We can also see a H4 ABCD bearish pattern present around 0.7296 that unites not only with the aforesaid H4 supply, but also with trendline resistance (prior support – 0.7076).
Before reaching for the aforesaid H4 supply, traders will note a 0.7208 support retest has occurred, movement that may appeal to buyers.
H1 timeframe:
Monday’s mild bearish tone directed H1 candles to within close proximity of the 0.72 level, a hurdle accompanied by a demand area at 0.7183/0.7193.
Northbound, we can see a resistance area from 0.7262/0.7247, which holds 0.7250 resistance within. Beyond here, technicians will likely shift focus to the 0.73 level.
As far as the RSI oscillator goes, we’re currently treading water beneath 50.00 after rupturing channel support.
Structures of Interest:
Intraday, in light of the room to advance on the daily timeframe and monthly price testing 0.7029/0.6664 as demand, could see H1 candles whipsaw through 0.72 today to test 0.7183/0.7193, a move that may entice fresh buying.
USD/JPY:
Monthly timeframe:
(Technical change on this timeframe is often limited though serves as guidance to potential longer-term moves)
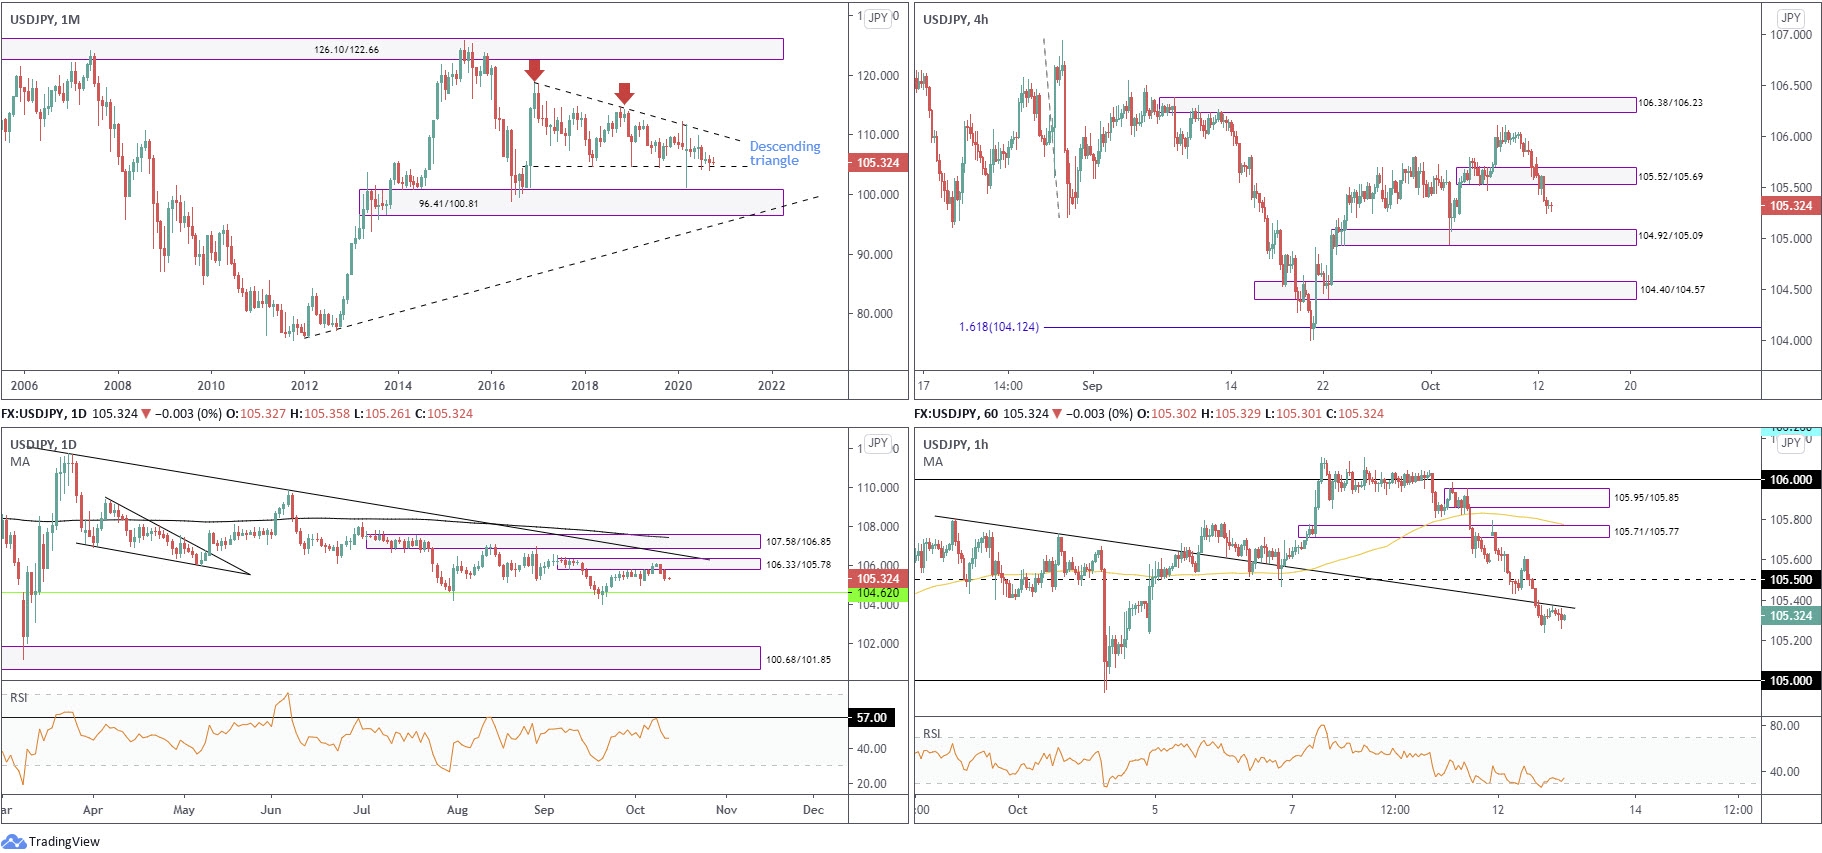
Since kicking off 2017, USD/JPY has been carving out a descending triangle pattern between 118.66/104.62.
September, as you can see, tested the lower boundary of the aforesaid pattern and ended the month modestly off worst levels, with October now emphasising a hesitant phase.
Areas of interest outside of the triangle can be seen at supply from 126.10/122.66 and demand coming in at 96.41/100.81.
Daily timeframe:
Brought forward from previous analysis –
Since recovering from monthly support at 104.62 (the lower boundary of the monthly descending triangle), action on the daily timeframe has been defending daily supply at 106.33/105.78, potentially encouraged by the RSI oscillator also fading resistance at 57.00.
Areas of note above the aforesaid supply, however, are nearby trendline resistance (111.71), supply at 107.58/106.85 and the 200-day simple moving average at 107.42.
H4 timeframe:
Demand seen at 105.52/105.69 put up little to no fight Monday, with scope now seen to approach demand at 104.92/105.09 and, with a little enthusiasm, the support area coming in from 104.40/104.57.
H1 timeframe:
The week, as you can see, kicked off with a modest gap to peaks at 105.79. After establishing a shooting star candlestick configuration at a supply zone from 105.71/105.77 (prior demand), the session witnessed decisive downside with the day ending sub 105.50 and beneath a trendline support (105.80), which is currently serving as resistance.
As far as support goes, according to the H1 chart, there’s little stopping the pair from declining to the 105 neighbourhood.
The RSI oscillator, however, is seen crawling along its oversold line.
Structures of Interest:
Daily, H4 and H1 timeframes all exhibit room to extend losses. The retest at H1 trendline resistance, therefore, may be a location sellers look to get involved, with the 105 region targeted (H4 demand at 104.92/105.09), followed by monthly support at 104.62.
GBP/USD:
Monthly timeframe:
(Technical change on this timeframe is often limited though serves as guidance to potential longer-term moves)
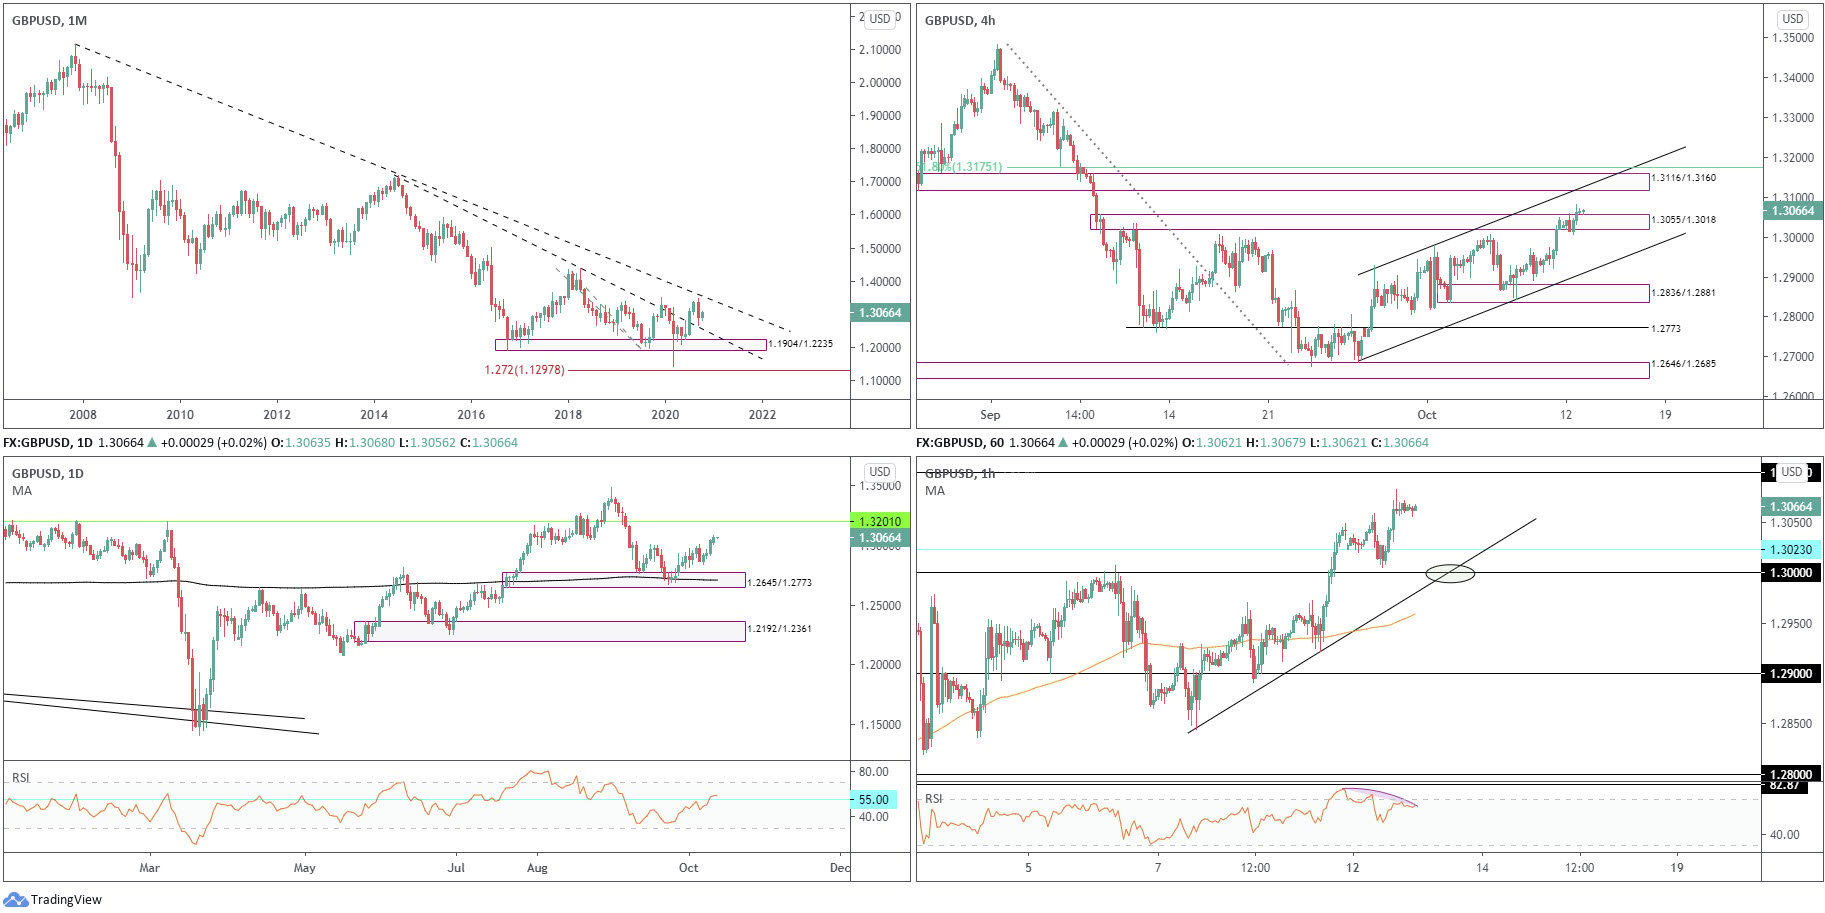
Leaving trendline resistance taken from 2.1161 unopposed, the month of September sunk 3.4 percent by way of a bearish outside reversal candle. This advertises a potential trendline support (prior resistance – 1.7191) retest.
In terms of trend, the primary trend has faced lower since early 2008, unbroken (as of current price) until 1.4376 gives way – April 2 high 2018.
Daily timeframe:
Partially modified from previous analysis –
Demand at 1.2645/1.2773 (and 200-day simple moving average at 1.2709) proved valuable support heading into the close of September.
Monday’s extension to the upside, marking a fourth successive daily gain for the pair, argues resistance at 1.3201 is likely to make an entrance today/tomorrow. Furthermore, RSI followers will note the value recently climbed above 55.00 resistance.
H4 timeframe:
Supply from 1.3055/1.3018, as you can see, yielded ground on Monday, shining light on another supply at 1.3116/1.3160 (prior demand) which shares space with a channel resistance (1.2978) and also a neighbouring 61.8% Fib level at 1.3175.
H1 timeframe:
Monday, bolstered by support at 1.3023, witnessed a pick-up in demand for the British pound ahead of the widely watched 1.30 level as we moved into US trading.
This has firmly positioned 1.31 in the firing range as resistance today, sheltered by a supply zone at 1.3159/1.3127. In the event GBP/USD decides to retreat and revisit the 1.30 region, however, the point at which the round number intersects (green circle) with trendline support (1.2844) could be interesting.
With respect to the RSI indicator, we are seeing the value establish bearish divergence, hovering just outside of overbought territory.
Structures of Interest:
Although monthly price echoes the prospect of downside, the daily candles show room to reach for resistance at 1.3201. With daily price sending across a bullish vibe, and H4 supply at 1.3055/1.3018 giving way, a retest at 1.30/1.3023 on the H1 timeframe today may impress dip-buyers.
DISCLAIMER:
The information contained in this material is intended for general advice only. It does not take into account your investment objectives, financial situation or particular needs. FP Markets has made every effort to ensure the accuracy of the information as at the date of publication. FP Markets does not give any warranty or representation as to the material. Examples included in this material are for illustrative purposes only. To the extent permitted by law, FP Markets and its employees shall not be liable for any loss or damage arising in any way (including by way of negligence) from or in connection with any information provided in or omitted from this material. Features of the FP Markets products including applicable fees and charges are outlined in the Product Disclosure Statements available from FP Markets website, www.fpmarkets.com and should be considered before deciding to deal in those products. Derivatives can be risky; losses can exceed your initial payment. FP Markets recommends that you seek independent advice. First Prudential Markets Pty Ltd trading as FP Markets ABN 16 112 600 281, Australian Financial Services License Number 286354.


 Access +10,000 financial
instruments
Access +10,000 financial
instruments