
EUR/USD:
Monthly timeframe:
(Technical change on this timeframe is often limited though serves as guidance to potential longer-term moves)
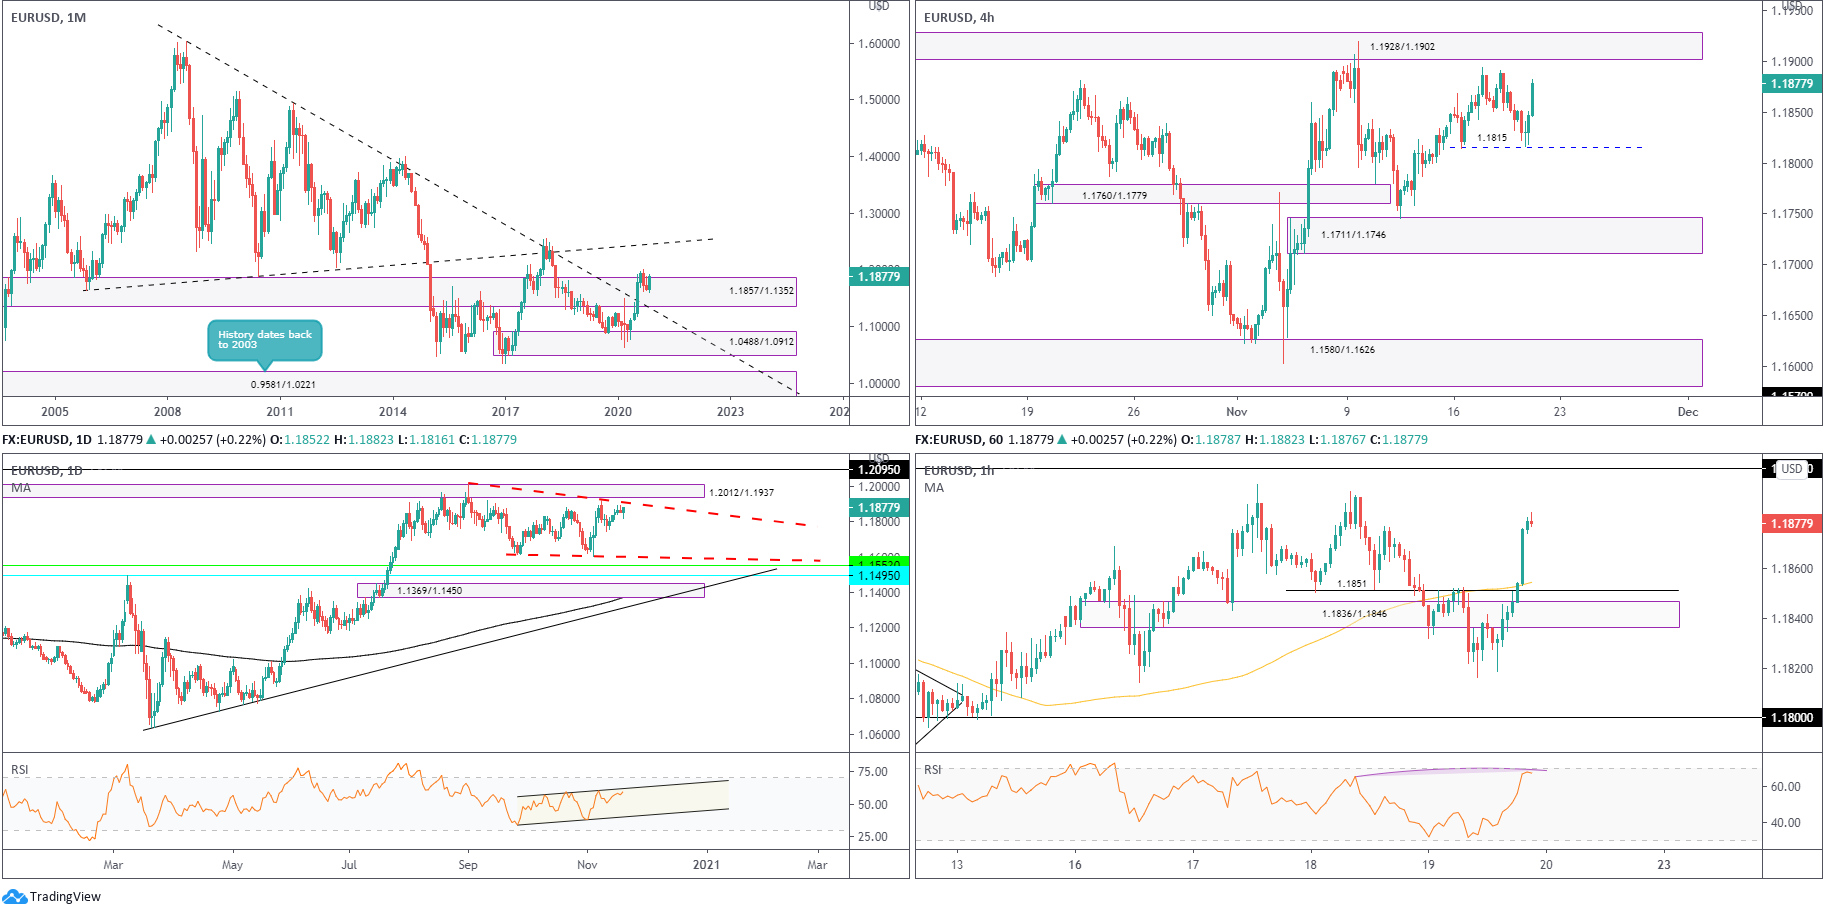
Following the break of long-term trendline resistance (1.6038) in July, buyers and sellers have since squared off around the upper section of supply from 1.1857/1.1352. Though this argues additional upside may be on the horizon, targeting ascending resistance (prior support – 1.1641), a dip to retest the recently penetrated trendline resistance (support) is also still on the table.
The primary downtrend (since July 2008) remains intact until 1.4940 is engulfed (May 2 high [2011]).
Daily timeframe:
Brought forward from previous analysis –
Supply at 1.2012/1.1937 remains a key zone to be mindful of on the daily chart, active since May 2018. Another interesting feature is an early falling wedge pattern between 1.2011 and 1.1612. Yet, be aware some may interpret this arrangement as a descending triangle pattern.
In terms of support beyond the aforesaid pattern, 1.1553 and 1.1495 offer prominent levels.
RSI fans will also note the value recently rotated higher above 50.00, though remains rooted within the upper region of an ascending channel.
H4 timeframe:
EUR/USD acknowledged fresh buying heading into the closing stages of Thursday’s session amid optimistic Brexit news, bound for mid-week tops around 1.1892 and supply at 1.1928/1.1902 (prior demand). This also puts across a possible double bottom support around 1.1815.
It should be noted the aforesaid supply is sited underneath daily supply parked at 1.2012/1.1937, currently encasing the upper line of the daily falling wedge pattern.
H1 timeframe:
Late buying Thursday hauled RSI action into close range of overbought territory, forming what’s known as hidden bearish divergence.
1.19 stands as possible resistance, while a EUR/USD correction could have dip-buyers surface from around demand at 1.1836/1.1846, located just beneath support at 1.1851 and the 100-period simple moving average.
Observed levels:
Scope for monthly and daily price to occupy higher levels, together with H4 price also displaying room to push into supply at 1.1928/1.1902, a correction to H1 demand at 1.1836/1.1846 may interest buyers.
AUD/USD:
Monthly timeframe:
(Technical change on this timeframe is often limited though serves as guidance to potential longer-term moves)
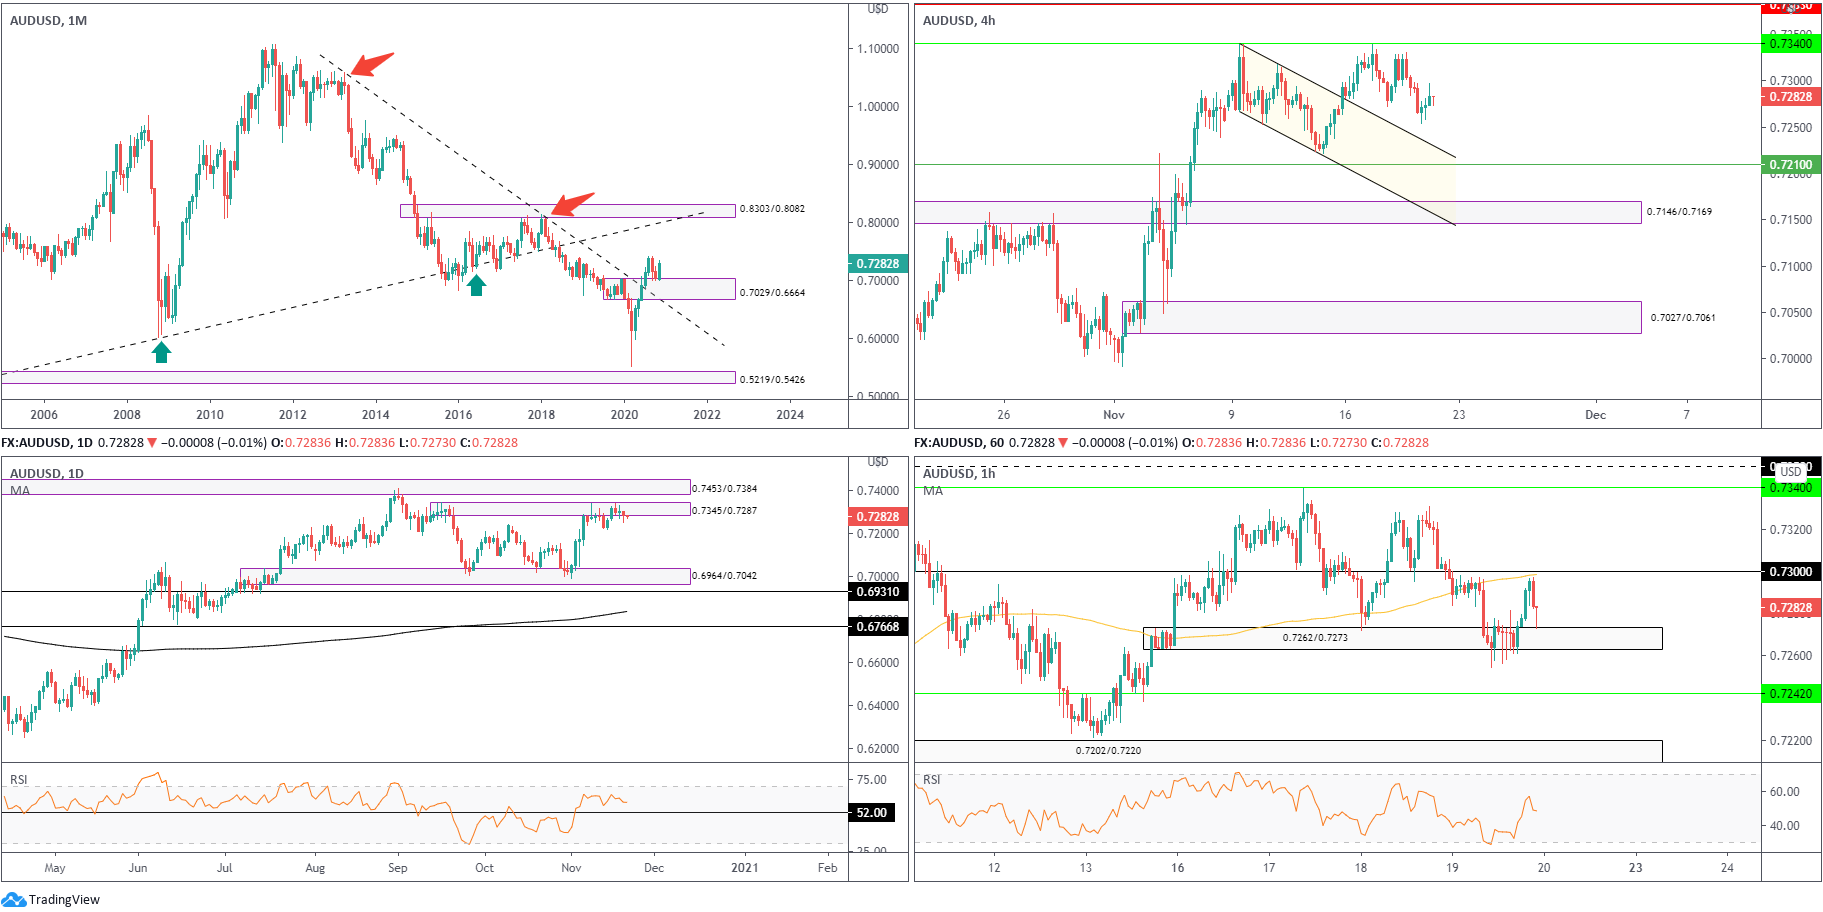
The months of September and October, as you can see, developed a mild correction and addressed the upper border of demand at 0.7029/0.6664 (prior supply). Buyers have so far responded well from the demand (up by 3.9 percent in November), free to explore as far north as 0.8303/0.8082 in the coming months, a supply zone aligning closely with trendline resistance (prior support – 0.4776).
In terms of trend, though, the primary downtrend (since mid-2011) remains south until breaking 0.8135 (January high [2018]).
Daily timeframe:
Brought forward from previous analysis –
Supply at 0.7345/0.7287 (a rally-base-drop formation) has remained in the frame since November 9, yet sellers have so far displayed a non-committal tone as monthly buyers continue to flex off demand. Neighbouring supply at 0.7453/0.7384, extended from August 2018, therefore, could soon be thrown in the mix.
The RSI indicator continues to languish beneath overbought space, following the removal of 52.00 resistance at the beginning of November.
H4 timeframe:
0.7340 remains a focal point in terms of resistance; yet continued weakness throws light on channel support (prior resistance – 0.7340) and support charged at 0.7210.
H1 timeframe:
The lower side of demand at 0.7262/0.7273 suffered several downside attempts Thursday, likely rattling intraday sell-stops south of the zone. Upside gained speed during US trading, though was short-lived, topping ahead of the 100-period simple moving average and returning to the aforesaid demand as well as throwing light on support around 0.7242.
Recent price action also bumped RSI movement below 50.00, fading peaks at 57.00.
Observed levels:
Healthy buying off monthly demand at 0.7029/0.6664, in conjunction with what appears to be fragile daily supply from 0.7345/0.7287, emphasises a bullish vibe. However, having seen H1 demand at 0.7262/0.7273 take a hit, with room for H4 to push towards 0.7210 support, a move to H1 support at 0.7242 or H1 demand at 0.7202/0.7220 is in the offing before buyers make an entrance.
USD/JPY:
Monthly timeframe:
(Technical change on this timeframe is often limited though serves as guidance to potential longer-term moves)
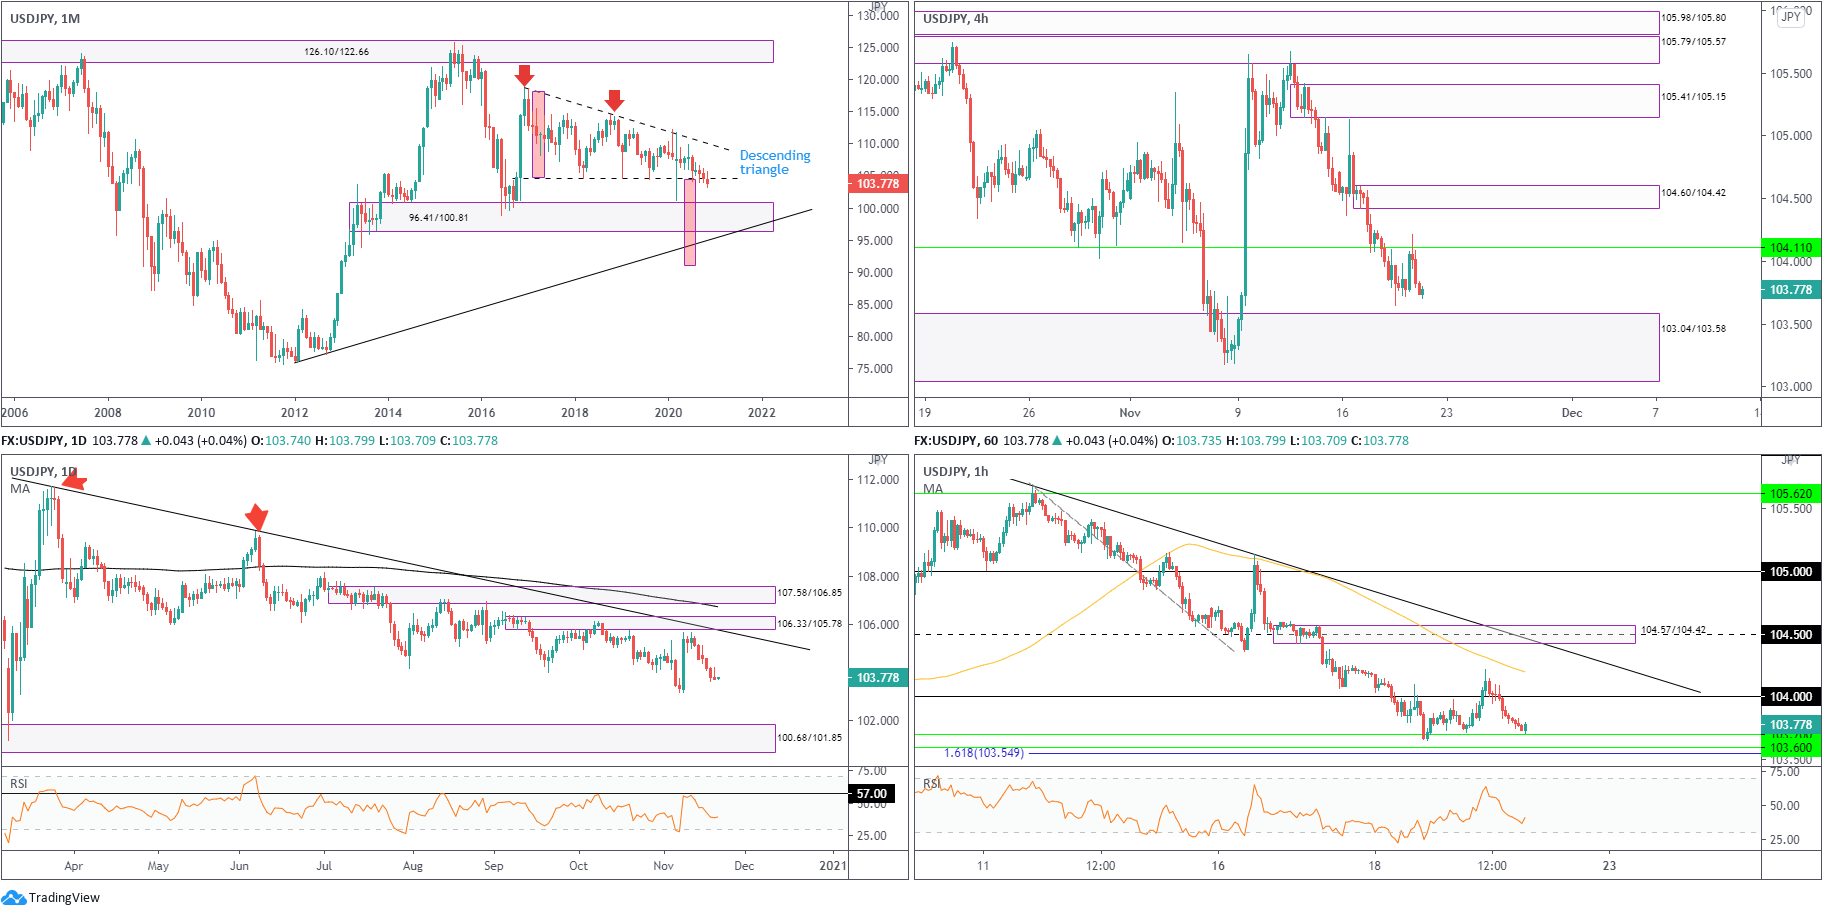
Since kicking off 2017, USD/JPY has been carving out a descending triangle pattern between 118.66/104.62.
November, as you can see, is working through the lower edge of the aforesaid pattern, down by 0.9 percent.
104.62 ceding ground shines light on demand from 96.41/100.81, followed by trendline support (76.15) and the descending triangle’s take-profit level at 91.04 (red).
Daily timeframe:
Partly modified from previous analysis –
Leaving behind supply from 106.33/105.78 and trendline resistance (111.68), as well as RSI resistance at 57.00, sellers have since made a strong show in the shape of six successive daily bear candles.
Downside risk remains, with light on the 103.17 low (November 6), demand at 100.68/101.85, drawn from September 2016, as well as RSI overbought levels.
H4 timeframe:
Partly modified from previous analysis –
104.11 resistance stood firm Thursday, hindering efforts to navigate higher levels. This clears space for a test of rather large demand priced from 103.04/103.58, extended from March 2020 (holds the 103.17 lows on the daily timeframe).
H1 timeframe:
Following a failed attempt to secure ground above 104 Thursday, price settled a few pips above 103.60/103.70 support (and 161.8% Fib projection level at 103.55).
Observed levels:
Monthly price tunnelling through descending triangle support at 104.62 signals sellers are gathering strength. This, on top of space seen for daily sellers to approach the 103.17 low and demand at 100.68/101.85 (fastened to the upper side of monthly demand at 96.41/100.81) indicates H4 sellers may test the mettle of H4 demand from 103.04/103.58 (holds 103.17 low). With this being the case, another bullish attempt may arise from H1 support at 103.60/103.70, yet is unlikely to be anything earthshattering.
On account of the above, sellers may pursue bearish strategies beneath 103.60/103.70.
GBP/USD:
Monthly timeframe:
(Technical change on this timeframe is often limited though serves as guidance to potential longer-term moves)
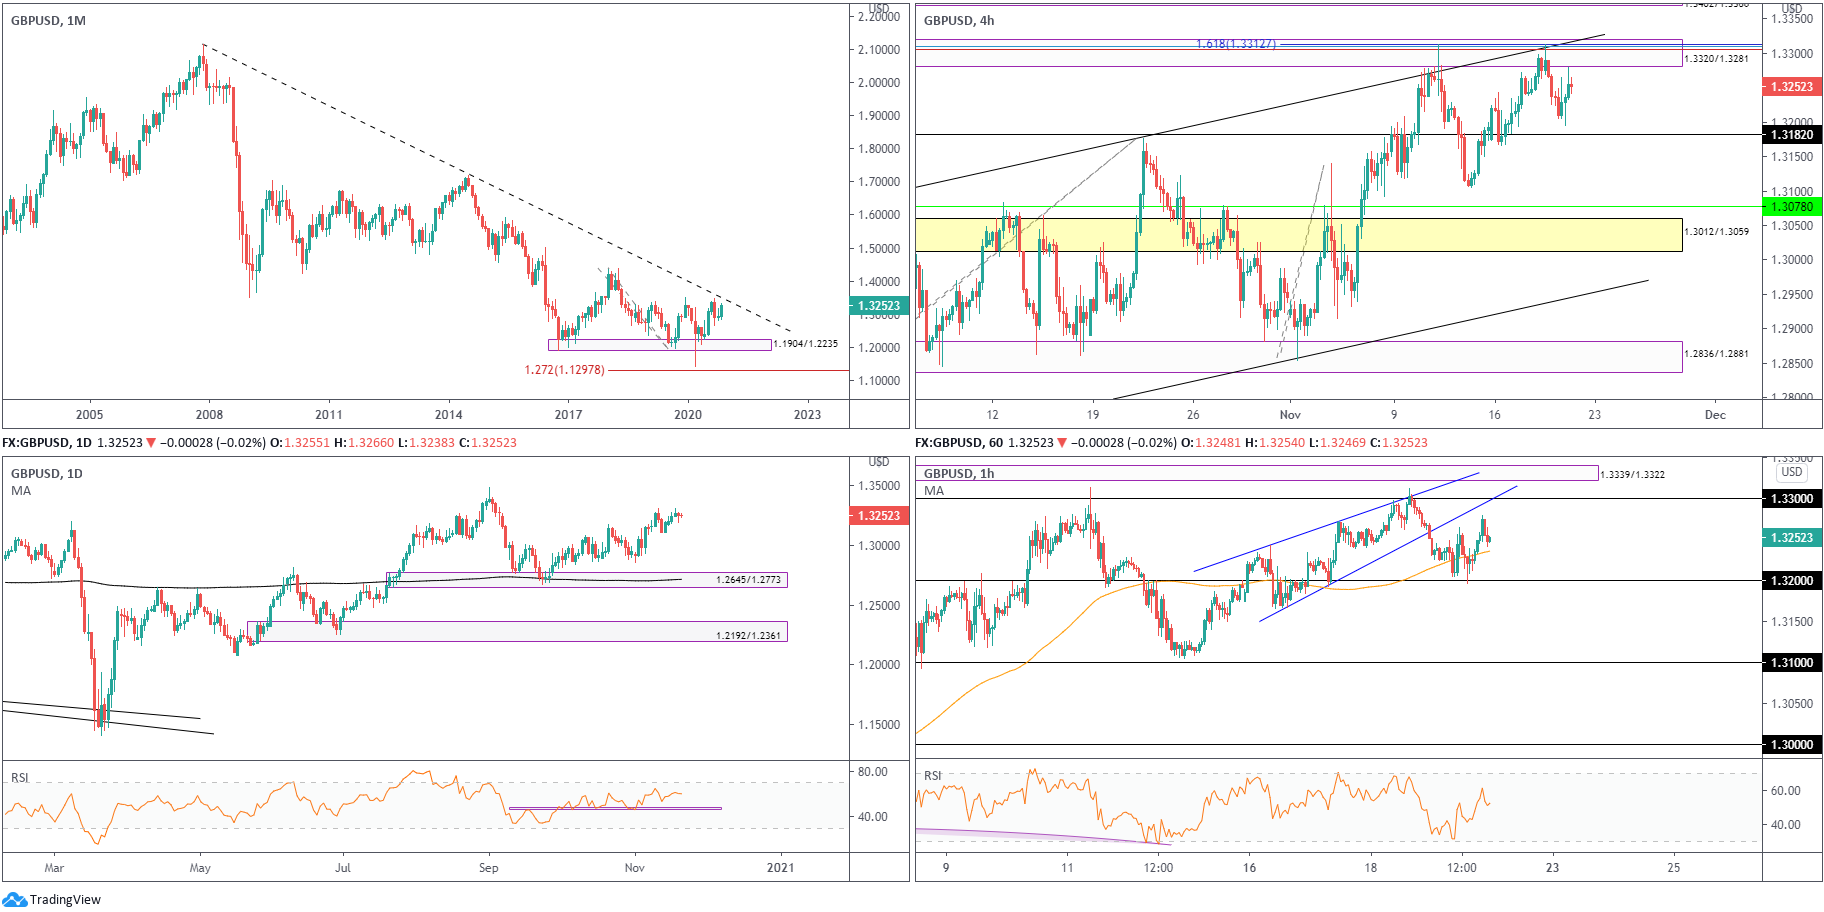
November trading higher by 2.4 percent places trendline resistance (2.1161) in the line of fire on the monthly chart.
In terms of trend, the primary trend has faced lower since early 2008, unbroken (as of current price) until 1.4376 gives way – April high 2018.
Daily timeframe:
Brought forward from previous analysis –
Since crossing paths with demand at 1.2645/1.2773 and 200-day simple moving average in late September, GBP/USD has displayed a gradual interest to the upside. Taking on higher levels targets the 1.3483 September peak.
H4 timeframe:
Supply at 1.3320/1.3281, an area joined by channel resistance (1.3176) and a collection of Fib studies around 1.3307, held back buyers in recent candles, declining to lows just ahead of support at 1.3182.
With strength emerging into Thursday’s close, amidst upbeat Brexit news, clearing the above said supply today could have supply at 1.3402/1.3368 move into position.
H1 timeframe:
The rising wedge pattern had its lower edge penetrated moving into Thursday’s session, eventually guiding candle movement into 1.32 support, a level aided by the 100-period simple moving average.
The US open, as you can see, formed a hammer candlestick configuration off 1.32 (bullish signal), encouraging fresh buyers on to the scene to peaks at 1.3279. North of here, 1.33 is in sight, with a subsequent push to welcome supply at 1.3339/1.3322 (from September).
Observed levels:
Technical evidence, according to the price action presented, implies buyers possibly have the upper hand. H4 supply exhibits weakness as sellers failed to test H4 support at 1.3182. Couple this with scope for higher levels on the monthly and daily timeframes could have H1 buyers extend gains off 1.32 support to approach 1.33 and H1 supply at 1.3339/1.3322.
DISCLAIMER:
The information contained in this material is intended for general advice only. It does not take into account your investment objectives, financial situation or particular needs. FP Markets has made every effort to ensure the accuracy of the information as at the date of publication. FP Markets does not give any warranty or representation as to the material. Examples included in this material are for illustrative purposes only. To the extent permitted by law, FP Markets and its employees shall not be liable for any loss or damage arising in any way (including by way of negligence) from or in connection with any information provided in or omitted from this material. Features of the FP Markets products including applicable fees and charges are outlined in the Product Disclosure Statements available from FP Markets website, www.fpmarkets.com and should be considered before deciding to deal in those products. Derivatives can be risky; losses can exceed your initial payment. FP Markets recommends that you seek independent advice. First Prudential Markets Pty Ltd trading as FP Markets ABN 16 112 600 281, Australian Financial Services License Number 286354.


 Access +10,000 financial
instruments
Access +10,000 financial
instruments