
EUR/USD:
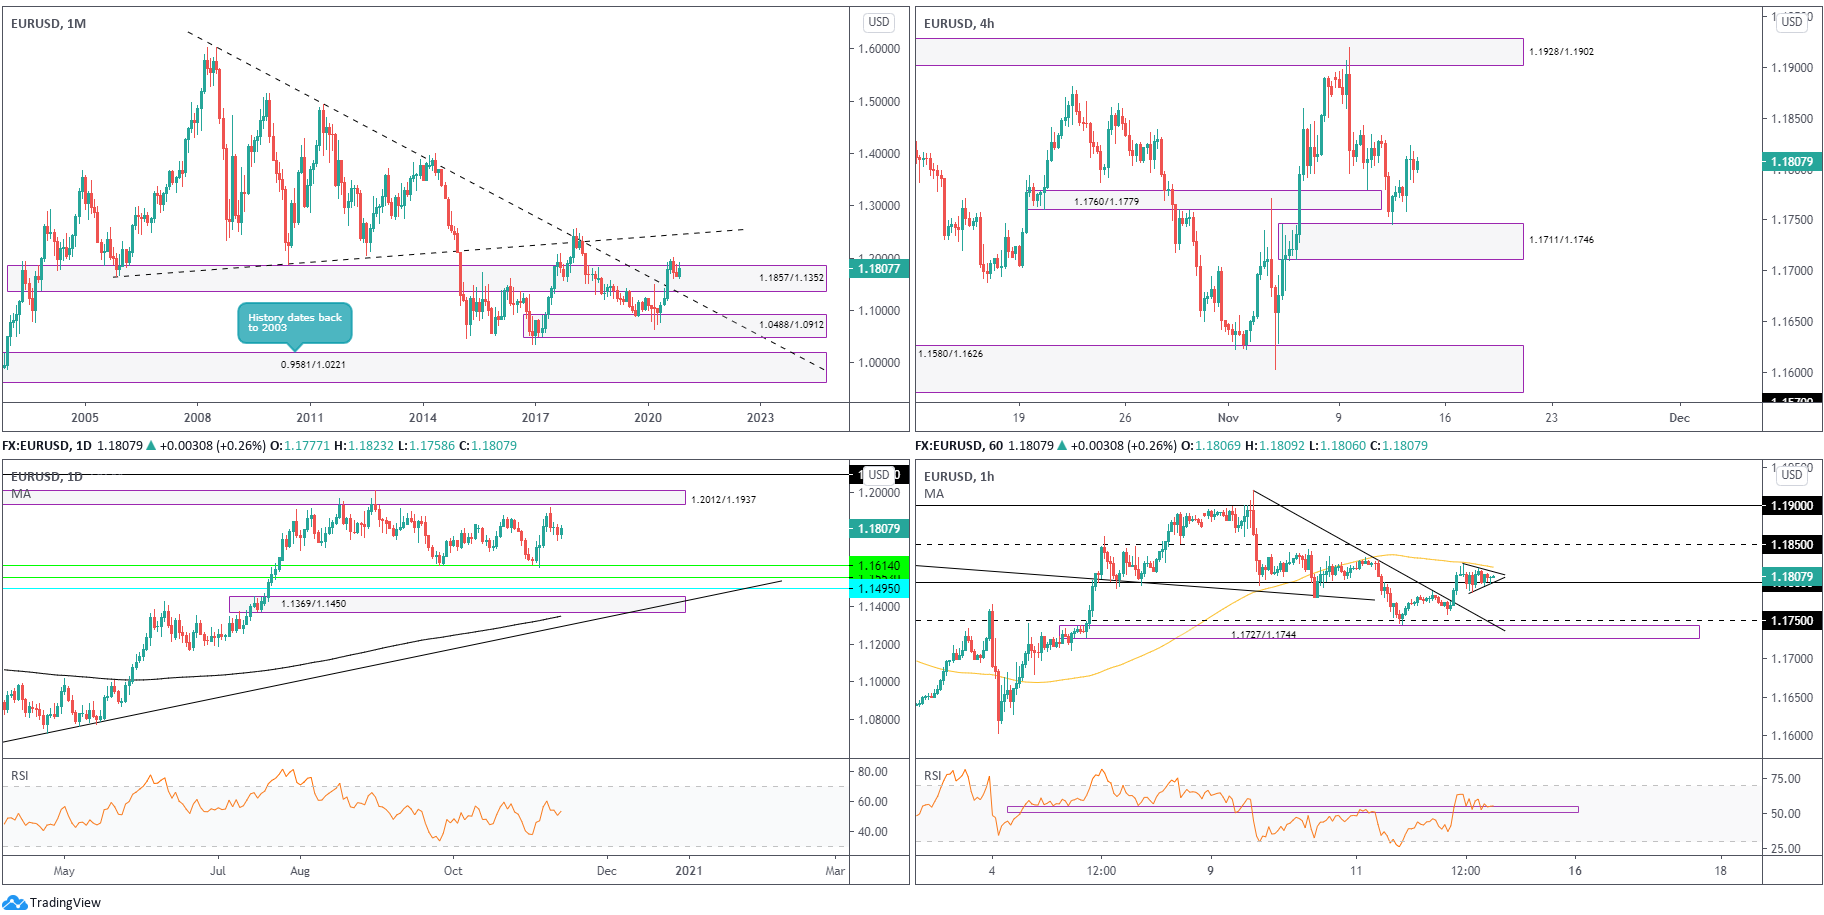
Monthly timeframe:
(Technical change on this timeframe is often limited though serves as guidance to potential longer-term moves)
Following the break of long-term trendline resistance (1.6038) in July, buyers and sellers have since been squaring off around the upper section of supply from 1.1857/1.1352. Whilst this argues additional upside may be on the horizon, targeting ascending resistance (prior support – 1.1641), a dip to retest the recently penetrated trendline resistance (support) is still on the table.
The primary downtrend (since July 2008) remains intact until 1.4940 is engulfed (May 2 high [2011]).
Daily timeframe:
Partly modified from previous analysis –
Since recoiling lower from beneath supply at 1.2012/1.1937 (extended from May 2018), sellers have lacked passion.
A bearish revival, however, shines light on support at 1.1614, together with support close by at 1.1553.
RSI fans will also note we modestly rotated higher above 50.00.
H4 timeframe:
Partly modified from previous analysis –
Thursday’s session, as you can see, extended a bullish position above fresh demand at 1.1711/1.1746. The reaction from this area is not a surprise – as stated in Wednesday’s piece, this demand is an important zone; it was here a decision was made to dethrone last Wednesday’s high at 1.1770.
Although there’s some wood to chop through around the 1.1830 region, buyers long this market will likely note supply from 1.1928/1.1902 (prior demand).
H1 timeframe:
US trading observed a drop in volatility on Thursday, following an early rally in London that claimed trendline resistance (1.1920) and the 1.18 level.
The round number, however, has so far served well as support, establishing a tight bullish pennant pattern (with the 100-period simple moving average trailing its upper edge.
RSI enthusiasts will also note the value retesting a support area between 50.92/55.21.
Observed levels:
The H1 bullish pennant pattern, forming off 1.18 support, could have buyers change gears today and attempt to topple the nearby 100-period simple moving average. Should the pennant welcome a breakout to the upside, the bullish target falls in just ahead of the 1.19 level.
AUD/USD:
Monthly timeframe:
(Technical change on this timeframe is often limited though serves as guidance to potential longer-term moves)
The months of September and October, as you can see, developed a mild correction and addressed the upper border of demand at 0.7029/0.6664 (prior supply). Buyers have so far responded well from demand (up by 2.9 percent in November), free to explore as far north as 0.8303/0.8082 in the coming months, a supply zone aligning closely with trendline resistance (prior support – 0.4776).
In terms of trend, though, the primary downtrend (since mid-2011) remains south until breaking 0.8135 (January high [2018]).
Daily timeframe:
Sellers re-established some control out of supply at 0.7345/0.7287 (a rally-base-drop formation) on Thursday, wrapping up nearby session lows.
Demand fixed from 0.6964/0.7042 represents a reasonable target if sellers maintain their grip.
The RSI indicator is seen correcting ahead of overbought levels, poised to retest 52.00 support.
H4 timeframe:
Demand at 0.7253/0.7237 (prior supply), despite a relatively strong effort from buyers to hold the zone, surrendered its position yesterday and unmasked support at 0.7210 and a 161.8% Fib projection level at 0.7204. Subsequent selling may bring light to demand at 0.7146/0.7169.
H1 timeframe:
Partly modified from previous analysis –
Following on from recent writing, traders will note Monday’s volatility shaped a head and shoulder’s top pattern, with the peak (the head) formed off resistance at 0.7327 and a neckline drawn from 0.7267.
Although now not the prettiest of technical patterns, the H&S top remains in play following bearish moves under 0.73 Wednesday that took on nearby trendline support (0.6993) and the 100-period simple moving average. In fact, the latter offered resistance on Thursday, promoting a drive to 0.72, the H&S pattern’s take-profit target (yellow).
It might also interest some readers to note the RSI oscillator has made a clear run towards oversold levels.
Observed levels:
Sellers from daily supply at 0.7345/0.7287 were clearly in control Thursday, rebelling against monthly price rebounding from demand at 0.7029/0.6664.
H1 recently penetrating the head and shoulder’s neckline and taking on H1 supports as well as H4 demand at 0.7253/0.7237 appears to have finally allowed H1 H&S sellers to consider a breakeven stop, with 0.72 ultimately targeted (set just beneath H4 support at 0.7210).
0.72, therefore, could also be an angle buyers welcome today, having seen the level fuse with H4 support at 0.7210 and essentially form in line with monthly price bouncing from demand.

USD/JPY:
Monthly timeframe:
(Technical change on this timeframe is often limited though serves as guidance to potential longer-term moves)
Since kicking off 2017, USD/JPY has been carving out a descending triangle pattern between 118.66/104.62.
Notably, November, up by 0.5 percent, is seen rebounding from the lower edge of the aforesaid pattern.
However, 104.62 ceding ground would shine light on demand from 96.41/100.81, followed by trendline support (76.15) and the descending triangle’s take-profit level at 91.04 (red).
Daily timeframe:
Despite Monday’s advance, the week so far has emphasised a lacklustre state, almost teasing pending sell orders arranged at supply from 106.33/105.78 and intersecting trendline resistance (111.68).
On top of the above, RSI resistance at 57.00, a level that has capped momentum on three occasions since July, remains active.
H4 timeframe:
Demand at 104.84/105.07 and supply at 105.79/105.57 are two prominent areas to be mindful of on the H4 chart.
Although a range may form between the two aforesaid zones, prudent traders will note additional supply at 105.98/105.80 and support coming in from 104.11.
H1 timeframe:
Partly modified from previous analysis –
Since the beginning of the week, the arrangement of price action on the H1 formed an ascending triangle pattern (105.64/104.82). According to some, this is considered a continuation pattern; others have noted resistance can sometimes prove too strong and form a reversal pattern. In this case, it appears the ascending triangle may have shaped a reversal signal, with a target set around 104.50 support (yellow).
As you can see though, in order to reach 104.50, sellers must first dethrone 105 support, a demand at 104.74/104.96 and the 100-period simple moving average at 104.97.
Observed levels:
- Buyers on the monthly timeframe could still hold descending triangle support at 104.62, supported by H4 demand at 104.84/105.07.
- Sellers short the break of the H1 ascending triangle likely target 104.50, despite a number of H1 supports in play, and daily price yet to connect with supply at 106.33/105.78 (and trendline resistance).

GBP/USD:
Monthly timeframe:
(Technical change on this timeframe is often limited though serves as guidance to potential longer-term moves)
Leaving trendline resistance (2.1161) unopposed, the month of September fell 3.4 percent by way of a bearish outside reversal candle and snapped a three-month winning streak. This, despite November trading higher by 1.3 percent at the moment, advertises a possible dip to retest trendline support (prior resistance – 1.7191).
In terms of trend, the primary trend has faced lower since early 2008, unbroken (as of current price) until 1.4376 gives way – April 2 high 2018.
Daily timeframe:
A DEEP fakeout above resistance at 1.3201 was recently observed on the daily chart. This, in addition to Thursday closing a touch off session lows, highlights 1.2860 bottoms and demand at 1.2645/1.2773.
The RSI oscillator has also turned over ahead of overbought space and appears set to retest support around 48.00.
H4 timeframe:
Partly modified from previous analysis –
Channel resistance (1.3176), surfacing just south of supply at 1.3320/1.3281 (and a collection of Fib studies around 1.3307) did a superb job holding back buyers on Wednesday. Follow-through weakness piloted Thursday under support at 1.3182 to within close range of support at 1.3078 and demand at 1.3012/1.3059.
H1 timeframe:
Following a breach of the 1.32 level and demand at 1.3167/1.3200, and rebounding from the underside of a 100-period simple moving average, early Asia today is seen greeting trendline support (1.2854). Also in close range is the 1.31 level.
Notably, a bearish break of 1.31 today could clear the runway south for sellers to take aim at the widely watched round number 1.30.
With respect to the RSI oscillator, the value tested oversold levels on Thursday.
Observed levels:
Initial thoughts, through the lens of a technical trader, is a break of 1.31 owing to the room seen for H4, daily and monthly price to discover lower levels. Yet, H1 trendline support, combined with nearby 1.31 support, may be sufficient fuel for buyers to at least bounce things back to 1.3167/1.3200 (H1 supply) before sellers make a play.
Another area to be aware of, however, is H4 demand at 1.3012/1.3059 and H4 support from 1.3078. Though, similar to H1 supports, any upside attempt from the H4 zones could be short-lived, owing to daily price potentially seeking lower levels (and maybe, at this point, H1 traders also pushing for a 1.30 test).

DISCLAIMER:
The information contained in this material is intended for general advice only. It does not take into account your investment objectives, financial situation or particular needs. FP Markets has made every effort to ensure the accuracy of the information as at the date of publication. FP Markets does not give any warranty or representation as to the material. Examples included in this material are for illustrative purposes only. To the extent permitted by law, FP Markets and its employees shall not be liable for any loss or damage arising in any way (including by way of negligence) from or in connection with any information provided in or omitted from this material. Features of the FP Markets products including applicable fees and charges are outlined in the Product Disclosure Statements available from FP Markets website, www.fpmarkets.com and should be considered before deciding to deal in those products. Derivatives can be risky; losses can exceed your initial payment. FP Markets recommends that you seek independent advice. First Prudential Markets Pty Ltd trading as FP Markets ABN 16 112 600 281, Australian Financial Services License Number 286354.


 Access +10,000 financial
instruments
Access +10,000 financial
instruments