
Charts: Trading View
EUR/USD:
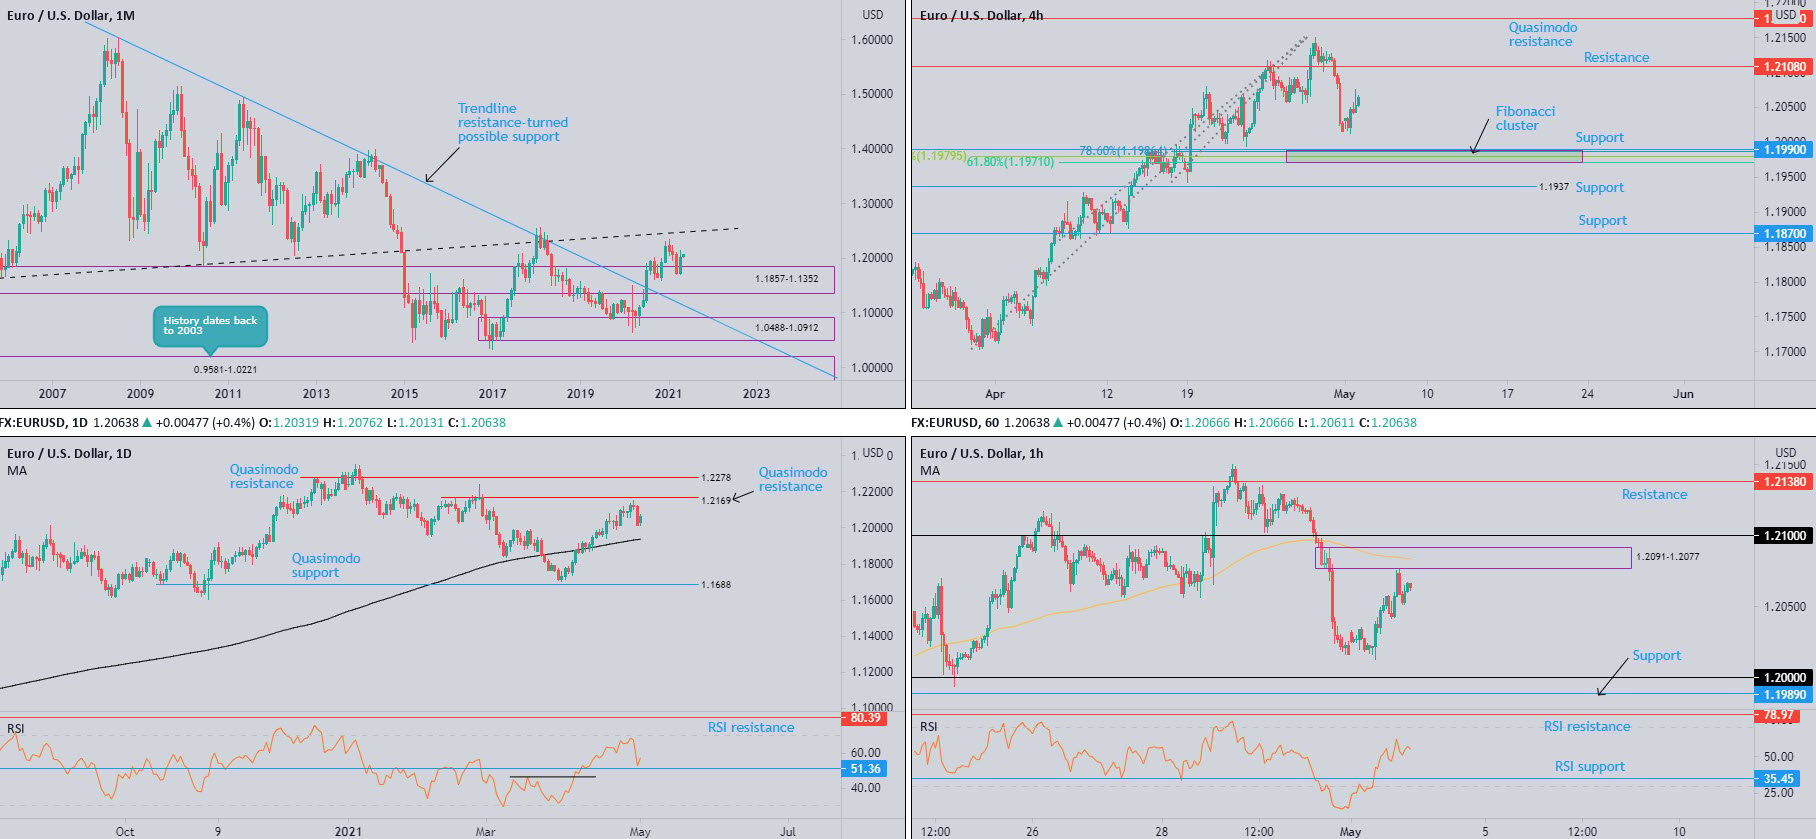
Monthly timeframe:
(Technical change on this timeframe is often limited, though serves as guidance to potential longer-term moves)
Following a three-month retracement, demand at 1.1857-1.1352 made an entrance and inspired a bullish revival in April, up 2.4 percent at the close.
April upside throws light on the possibility of fresh 2021 peaks in the months ahead, followed by a test of ascending resistance (prior support [1.1641]).
Based on trend studies, the primary uptrend has been underway since price broke the 1.1714 high (Aug 2015) in July 2017. Additionally, price also breached trendline resistance, taken from the high 1.6038, in July 2020.
Daily timeframe:
The 200-day simple moving average at 1.1937 serves as dynamic support, in the event of a push southbound.
Quasimodo resistance at 1.2169, on the other hand, commands attention to the upside.
Despite the 2021 retracement, trend studies reveal the currency pair has been entrenched within an uptrend since early 2020, movement that many traders will likely refer to as a primary trend on this timeframe.
In terms of RSI movement, last week’s withdrawal from 69.00 took the indicator to within striking distance of support at 51.36.
H4 timeframe:
Europe’s single currency, as can be seen from the H4 chart, eked out modest gains against the US dollar on Monday, leaving support at 1.1990 and a Fibonacci cluster between 1.1971 and 1.1986—a defined area on a price chart where Fib retracement levels converge—unchallenged.
As for risk events, the calendar was somewhat thin. Though according to the Institute for Supply Management (ISM), US manufacturing grew at a slower pace in April (60.7 vs. consensus estimate 65.0).
Overthrowing the aforesaid Fib cluster unearths additional support at 1.1937 (aligns with the 200-day simple moving average on the daily scale), while a continued rotation to the upside shines light on resistance at 1.2108.
H1 timeframe:
Monday discovered a floor just north of the 1.20 figure, a level stationed above another layer of support at 1.1989 (prior Quasimodo resistance). The bullish stance subsequently elevated EUR/USD to within a whisker of supply at 1.2091-1.2077—houses the 100-period simple moving average at 1.2083. Also of technical relevance is the 1.21 figure located just above current supply.
From the RSI oscillator, we can see the value climbed from oversold space, reclaimed resistance at 35.45 and engulfed the 50.00 centreline. This suggests further upside momentum could be on the cards, with RSI (overbought) resistance arranged at 78.97.
Observed levels:
Partly modified from previous analysis.
April showing life out of monthly demand from 1.1857-1.1352 reinforces a possible retest (dip-buying scenario) at the 200-day simple moving average from 1.1937 (daily timeframe).
Shorter-term action, however, has H1 facing supply at 1.2091-1.2077, the 100-period simple moving average and the 1.21 figure as a potential ceiling. This area also brings with it additional fuel in the shape of H4 resistance nearby at 1.2108 and, therefore, could ignite a bearish scenario.
AUD/USD:
Monthly timeframe:
(Technical change on this timeframe is often limited, though serves as guidance to potential longer-term moves)
Since the beginning of 2021, buyers and sellers have been battling for position south of trendline resistance (prior support – 0.4776 high) and supply from 0.8303-0.8082. Should a bearish scenario unfold, demand at 0.7029-0.6664 (prior supply) is featured to the downside.
Trend studies (despite the trendline resistance [1.0582] breach in July 2020) show the primary downtrend (since mid-2011) remains in play until breaking 0.8135 (January high [2018]).
Daily timeframe:
Since mid-April, AUD/USD has been seen consolidating around resistance from 0.7817.
Territory to the downside shines the technical spotlight on February’s low at 0.7563, followed closely by trendline resistance-turned support, extended from the high 0.8007.
Rupturing 0.7817, nevertheless, unbolts the door for an approach to supply at 0.8045-0.7985.
Interestingly, the RSI value is seen testing trendline support-turned resistance, extended from the low 36.55. North of here, traders are also urged to pencil in trendline resistance, drawn from the high 80.12.
H4 timeframe:
The consolidation visible on the daily scale also dominates the H4, as buyers and sellers square off between 0.7800 Quasimodo resistance and 0.7696-0.7715 demand (blends with trendline support, taken from the low 0.7531).
Should price rupture the noted demand, a Fibonacci cluster between 0.7657 and 0.7672, is seen lying in wait, while demand-turned supply at 0.7848-0.7867 calls for attention north of 0.7800.
H1 timeframe:
Amidst a bout of USD weakness Monday, EUR/USD lifted above resistance at 0.7752 and the 100-period simple moving average at 0.7757, with price action subsequently retesting 0.7752 as support and forming a dragonfly doji candle—bullish signal.
Quasimodo resistance is plotted overhead at 0.7777, with further outperformance casting focus towards the 0.78 figure (also represents H4 Quasimodo resistance).
With respect to momentum, as measured by the RSI, the value recorded a mild top, a stone’s throw from overbought territory.
Observed levels:
0.7800 Quasimodo resistance on the H4 is likely to attract technical attention. Not only does the level represent a psychological base (applied to the H1), 0.7800 aligns closely with daily resistance at 0.7817.
Short-term flow, on the other hand, shows that scaling higher could also be on the table. The retest of H1 support at 0.7752, and nearby 100-period simple moving average, may have intraday bulls take aim at H1 Quasimodo resistance at 0.7777, followed then by the noted 0.78 neighbourhood.

USD/JPY:
Monthly timeframe:
(Technical change on this timeframe is often limited, though serves as guidance to potential longer-term moves)
Following January’s bullish engulfing candle and February’s outperformance, March concluded up by 3.9 percent and marginally cut through descending resistance, etched from the high 118.66.
Although April finished lower by 1.3 percent and snapped the three-month winning streak, the pair is attempting to hold the breached descending resistance, echoing potential support.
Daily timeframe:
Partly modified from previous analysis.
Despite the monthly timeframe chalking up possible supportive structure, the daily timeframe watched price establish a half-hearted shooting star pattern on Monday—bearish candlestick signal—from supply pinned at 109.97-109.18. As you can see, the bearish formation also snapped a two-day winning streak.
Trendline support, extended from the low 102.59, serves as a downside target south of current supply; a bullish showing, on the other hand, casts light towards longer-term supply at 110.94-110.29, stationed under another supply at 111.73-111.19.
Trend studies show the unit has been trending higher since the beginning of 2021.
The RSI indicator, although ending last week above the 50.00 centreline (a sign of trend strength), is seen engaging resistance at 57.00.
H4 timeframe:
61.8% Fib resistance at 109.60—located under supply at 109.97-109.72—provided a platform for sellers to work with on Monday. This rejuvenated a bearish presence and pencilled in a retreat back to support at 108.99, which, for now, holds.
Space south of 108.99 shines light back on support at 108.50 and neighbouring demand from 108.20-108.43.
H1 timeframe:
Monday’s bearish narrative shaped clear-cut supply at 109.52-109.39—a decision point to break the 109.26 low and trendline support, pencilled in from the low 107.64. Ensuing action observed a 109 test, a level accompanied by the 100-period simple moving average at 108.99.
The lack of buyer intent from 109 unearths potential selling, targeting another trendline support, taken from the low 107.47.
The view from within the RSI has the value attempting to discover support around the 40.00 region. Dipping a toe in oversold waters, however, highlights support from 18.76.
Observed levels:
Though 109 has so far failed to stir much bullish curiosity on the H1, the psychological base still echoes strength, technically speaking, as it joins hands with the 100-period simple moving average, H4 support at 108.99, and also seeing monthly price defending the descending resistance-turned possible support.
H1 failing to hold 109, however, could see a short-term dip to trendline support, taken from the low 107.47, a move that may also stir dip-buying activity.

GBP/USD:
Monthly timeframe:
(Technical change on this timeframe is often limited, though serves as guidance to potential longer-term moves)
The pendulum swung in favour of buyers following December’s 2.5 percent advance, stirring major trendline resistance (2.1161). February subsequently followed through to the upside (1.7 percent) and refreshed 2021 highs at 1.4241, levels not seen since 2018. Contained within February’s range, however, March and April witnessed decreased volatility.
Despite the trendline breach (which could serve as possible support if retested), primary trend structure has faced lower since early 2008, unbroken (as of current price) until 1.4376 gives way (April high 2018).
Daily timeframe:
Partly modified from previous analysis.
Resistance at 1.4003 has proved a stubborn hurdle since March, capping upside attempts on multiple occasions. Any downside from this base throws light on 1.3670 bottoms, arranged north of Quasimodo support at 1.3609.
Should buyers regain consciousness and brush aside current resistance, Quasimodo resistance at 1.4250 could enter the frame.
From the RSI indicator, the value dropped from 58.20 peaks and crossed swords with trendline support, pencilled in from the low 36.14.
As for trend, GBP/USD has been trending higher since early 2020, despite the two-month retracement.
H4 timeframe:
1.3809-1.3832 demand, as you can see, survived Friday’s mild breach, with GBP/USD bulls entering an offensive phase and shaking hands with resistance at 1.3919. Should sellers fail to find grip from the aforementioned resistance, technicians are likely to watch Quasimodo resistance at 1.4007.
Below the aforesaid demand brings notice to Quasimodo support at 1.3750, which happens to align with a 1.272% Fib projection at 1.3746 and a 78.6% Fib level at 1.3739 (Fib cluster).
H1 timeframe:
Launching above 1.39 and the 100-period simple moving average on Monday guided H1 candles to neighbouring resistance at 1.3929 and put a cap on intraday gains.
The reaction from 1.3929 witnessed price retreat to within a pip of 1.39 and the 100-period simple moving average. Interestingly, a bullish showing north of 1.39, movement that scales 1.3929, unlocks the possibility of reaching as far north as the 1.40 figure.
From the RSI, we can see the indicator recently forged hidden bearish divergence at overbought territory, with the value settling Monday around the 60.00 region.
Observed levels:
1.39 buyers (H1) face H1 resistance at 1.3929 and H4 resistance at 1.3919. Buyers finding acceptance above the aforesaid resistances brings light to a potential bullish wave towards the 1.40 resistance area (1.40 figure [H1], H4 Quasimodo resistance at 1.4007 and daily resistance at 1.4003).
1.39 giving way, nonetheless, may spark a short-term bearish scenario, targeting at least H1 support at 1.3864.

DISCLAIMER:
The information contained in this material is intended for general advice only. It does not take into account your investment objectives, financial situation or particular needs. FP Markets has made every effort to ensure the accuracy of the information as at the date of publication. FP Markets does not give any warranty or representation as to the material. Examples included in this material are for illustrative purposes only. To the extent permitted by law, FP Markets and its employees shall not be liable for any loss or damage arising in any way (including by way of negligence) from or in connection with any information provided in or omitted from this material. Features of the FP Markets products including applicable fees and charges are outlined in the Product Disclosure Statements available from FP Markets website, www.fpmarkets.com and should be considered before deciding to deal in those products. Derivatives can be risky; losses can exceed your initial payment. FP Markets recommends that you seek independent advice. First Prudential Markets Pty Ltd trading as FP Markets ABN 16 112 600 281, Australian Financial Services License Number 286354.


 Access +10,000 financial
instruments
Access +10,000 financial
instruments