
EUR/USD:
Monthly timeframe:
(Technical change on this timeframe is often limited though serves as guidance to potential longer-term moves)
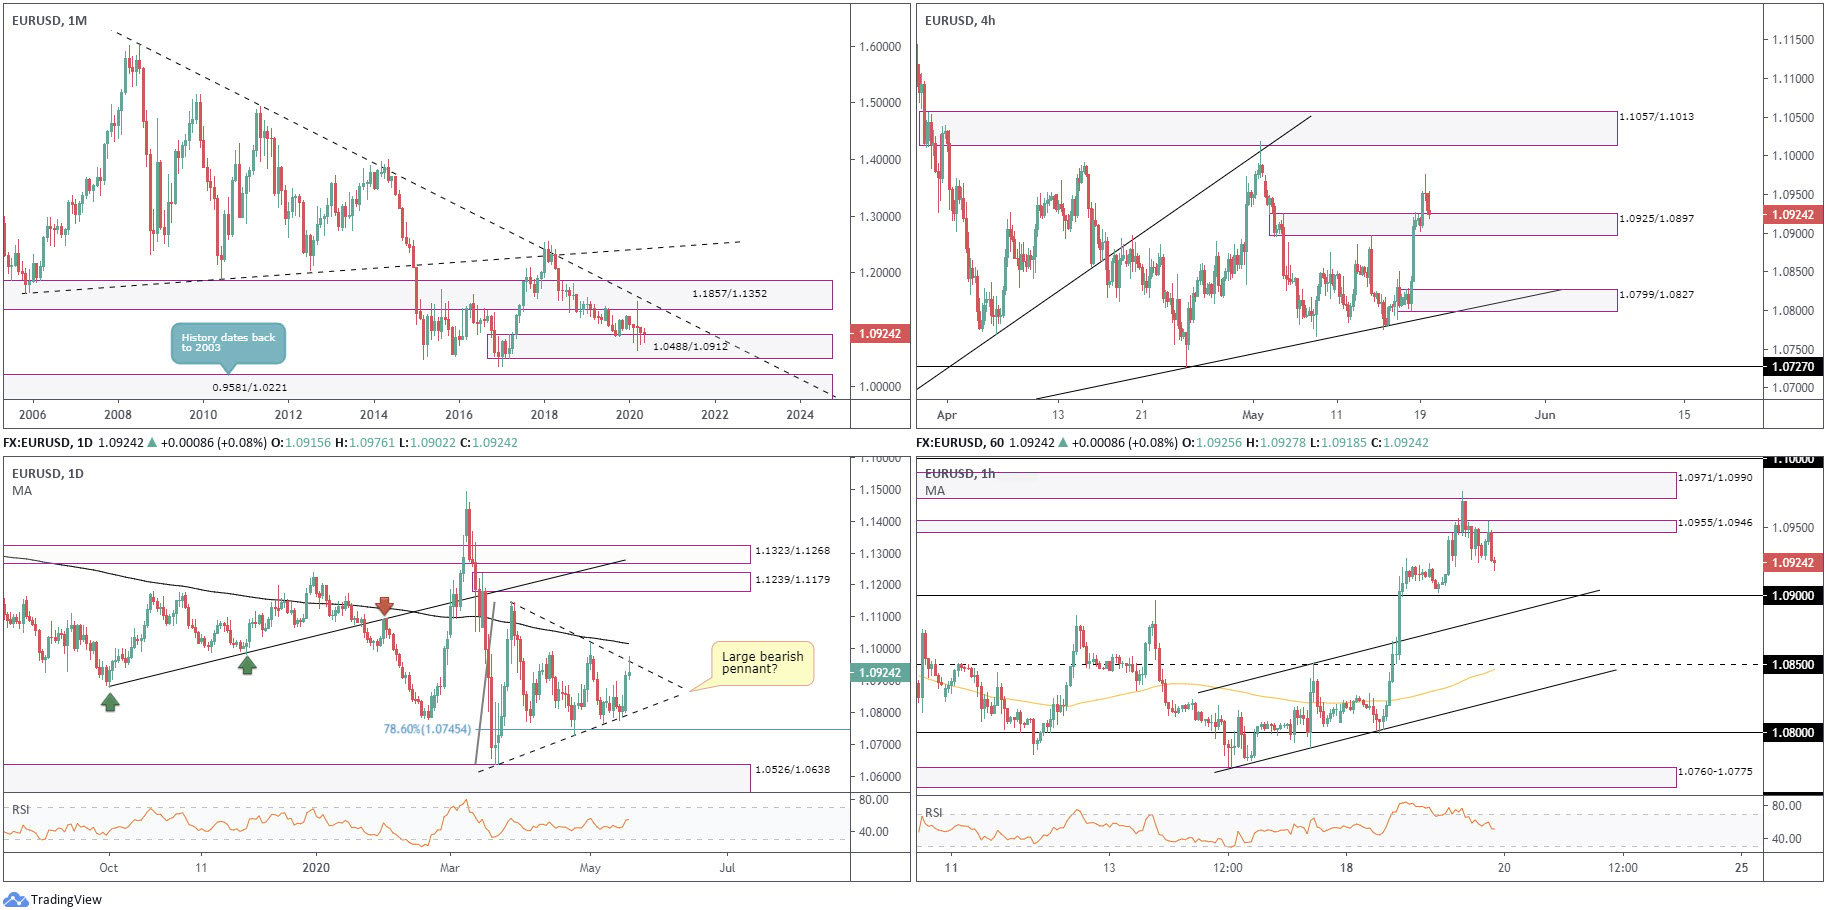
March, evident from the monthly chart, left behind a long-legged doji indecision candle, with its extremes crossing paths with heavyweight supply at 1.1857/1.1352 (intersects with a long-term trendline resistance [1.6038]) and demand at 1.0488/1.0912.
April, as you can see, spent the best part of the month feasting on the top edge of 1.0488/1.0912, squeezing out a Japanese hammer candlestick pattern, typically viewed as a bullish reversal signal.
May is seen recovering off worst levels, on track to perhaps form another Japanese hammer candlestick pattern out of current demand.
With reference to the primary trend, price has exhibited clear lower peaks and troughs since 2008.
Daily timeframe:
Partially altered from previous analysis –
Pattern traders will note a large potential bearish pennant pattern between 1.1147/1.0635, forming since late March.
Monday’s advance, coupled with an extension on Tuesday, witnessed the upper border of the aforesaid pattern brought into sight, with price action responding in the form of a Japanese shooting star candlestick pattern. Sustained upside may lead to a whipsaw through the pattern’s upper boundary into the 200-day simple moving average (SMA), currently circling 1.1015.
A convincing daily close out of the current pennant pattern structure might give rise to a fresh wave of selling. Breaking lower entails tipping a 78.6% Fib level at 1.0745 and ultimately competing with demand at 1.0526/1.0638, an area extended from March 2017.
H4 timeframe:
Technically, selling based off the upper edge of the current daily bearish pennant pattern forced a retreat to H4 demand at 1.0925/1.0897 (prior supply) on Tuesday. A decisive reversal out of the zone could lead to supply at 1.1057/1.1013. Sustained downside from current price, though, may shift focus to fresh demand at 1.0799/1.0827.
H1 timeframe:
Following a pivotal whipsaw through supply at 1.0955/1.0946 heading into Tuesday’s US session, a move that brought supply (prior demand) at 1.0971/1.0990 in focus, saw sellers pick up unfilled sell orders at 1.0955/1.0946 on the way down. This may take the currency pair to the 1.09 handle today, albeit echoing the possibility of a whipsaw to channel support (1.0850 – prior resistance).
Structures of Interest:
1.09, the point which the figure merges with H1 channel support, is an area likely on the watchlist for many intraday price action traders today. 1.09 is sited within the lower boundary of H4 demand at 1.0925/1.0897, and may glean additional support on the back of monthly price seen recovering from demand at 1.0488/1.0912.
AUD/USD:
Monthly timeframe:
(Technical change on this timeframe is often limited though serves as guidance to potential longer-term moves)
Overwhelmed by the effects of the coronavirus pandemic, the month of March scored seventeen-year lows at 0.5506 ahead of demand pencilled in from 0.5219/0.5426, before staging an impressive recovery.
April’s 370-pip advance has, as you can see, landed May within striking distance of supply fixed at 0.7029/0.6664, an area intersecting with a long-term trendline resistance (1.0582).
Regarding the market’s primary trend, a series of lower lows and lower highs has been present since mid-2011.
Daily timeframe:
Brought forward from previous analysis –
Supply at 0.6618/0.6544 remains a dominant fixture on this timeframe, though has, as of yet, been unable to deliver much in terms of downside. An extension to the downside faces possible support from 0.6372ish, with a break unmasking 0.6253 (April 21 low).
It should also be emphasised the current supply comes with a 127.2% Fib ext. level at 0.6578 and a nearby 161.8% Fib ext. level at 0.6642. Traders may include the 200-day simple moving average seen around 0.6660.
H4 timeframe:
Partially altered from previous analysis –
After forming an early peak out of supply from 0.6581/0.6545, price shaped a falling wedge between 0.6561/0.6432, on approach to demand at 0.6356/0.6384.
Monday had the candles penetrate the upper boundary of the falling wedge pattern. Tuesday extended upside, travelling to a high of 0.6584 and piercing the top edge of supply at 0.6581/0.6545. What’s also special is the falling wedge take-profit target, measured by taking the base and adding this value to the breakout point (yellow), came within a few pips of completing at 0.6595.
H1 timeframe:
Buyers took a back seat after testing the completion point of an ABCD bearish pattern at 0.6577 Tuesday, as we headed into the later phase of the session, sending price action back under 0.6550.
To the left of current price demand appears consumed until reaching possible support at 0.65. Interestingly, though, a whipsaw through 0.65 could be in the offing towards a demand zone at 0.6483/0.6472 (prior supply). Also note the 100-period simple moving average is seen crawling the underside of the noted demand at around 0.6470.
Structures of Interest:
As highlighted in the weekly technical market insight, in order to bring in monthly supply at 0.7029/0.6664, daily supply at 0.6618/0.6544 will need to be overturned.
Short term, however, shows H4 price rotating lower from supply at 0.6581/0.6545, by way of a bearish outside pattern, missing the falling wedge take-profit target by a hair. This, together with H1 price displaying scope to approach at least 0.65 out of an ABCD correction, may lure sellers into the market today.

USD/JPY:
Monthly timeframe:
(Technical change on this timeframe is often limited though serves as guidance to potential longer-term moves)
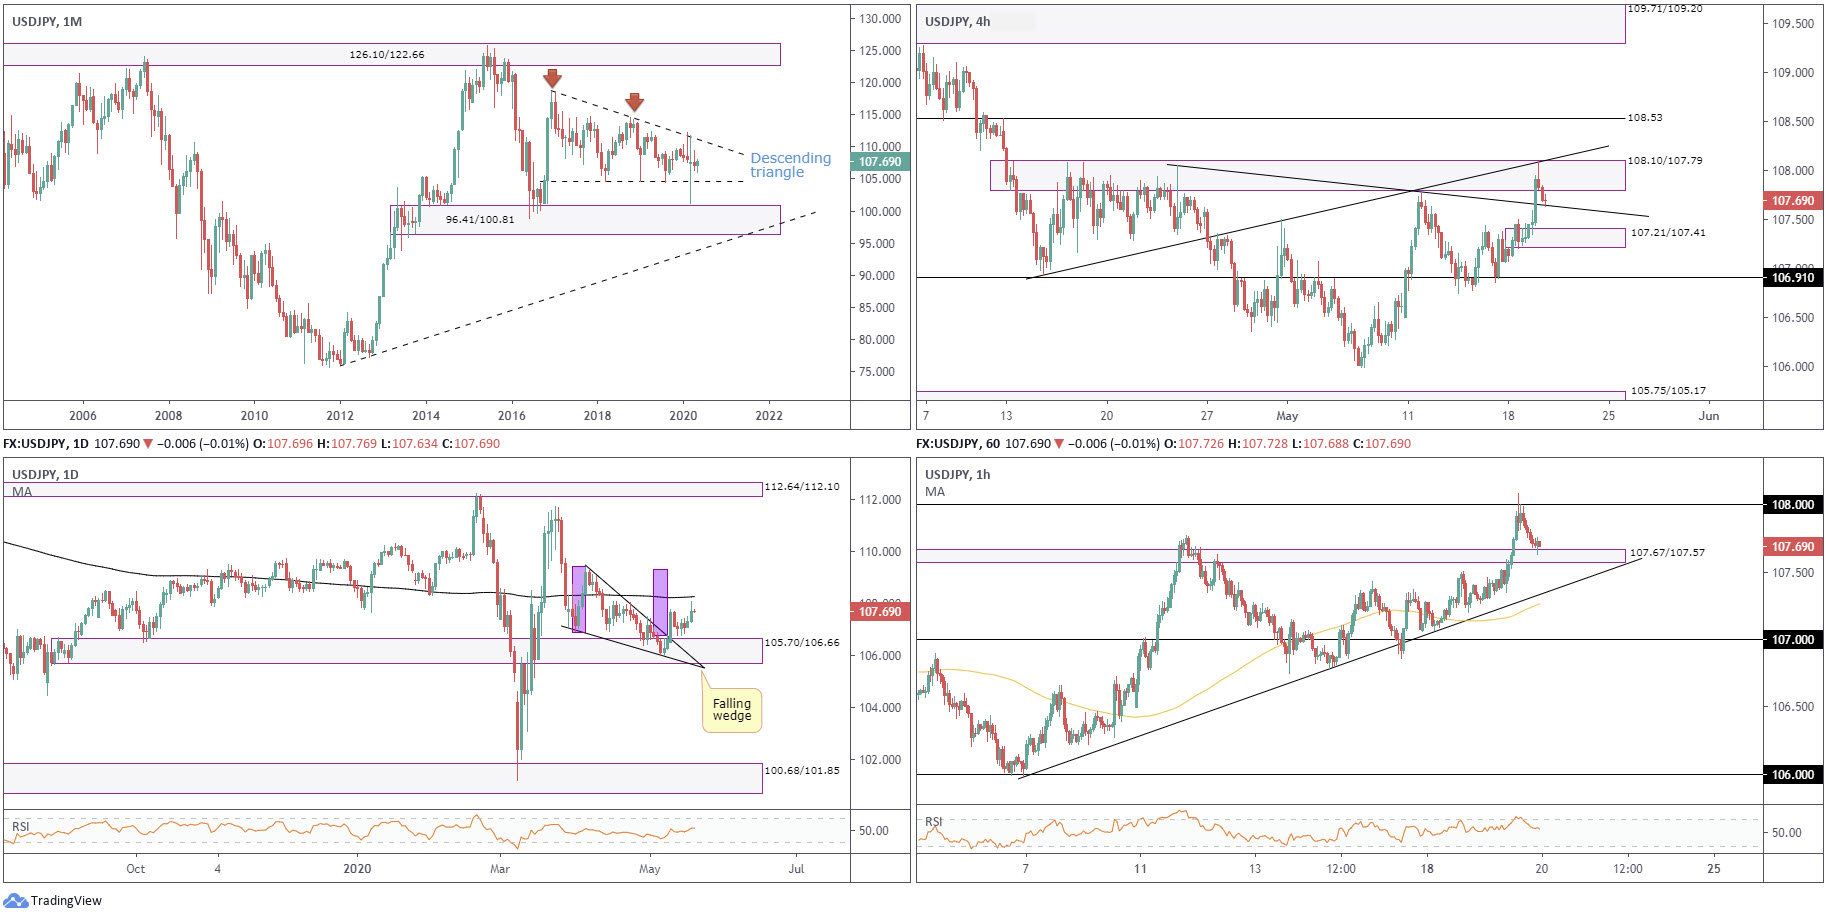
Since kicking off 2017, USD/JPY has been busy carving out a descending triangle pattern between 118.66/104.62. The month of March concluded by way of a long-legged doji candlestick pattern, ranging between 111.71/101.18, with extremes piercing the outer limits of the aforementioned descending triangle formation.
April was pretty uneventful, ranging between 109.38/106.35. May also remains subdued, ranging between 108.08/105.98.
Areas outside of the noted pattern can be seen at supply from 126.10/122.66 and demand coming in at 96.41/100.81.
Daily timeframe:
Partially altered from previous analysis –
Since registering a top from 109.38 at the beginning of April, USD/JPY moulded a falling wedge pattern, which had its upper limit breached early last week in strong fashion, boosted by demand at 105.70/106.66. The take-profit target out of the said pattern, traditionally measured by taking the value of the base and adding this to the breakout point (purple), sets an objective of around 109.30.
However, in order to reach the noted take-profit target, the 200-day simple moving average at 108.26 will need to be overthrown.
H4 timeframe:
Recent upside took the USD/JPY to highs of 108.08, invading familiar supply at 108.10/107.79 and crossing paths with trendline resistance (106.92). The US dollar clawed back some strength from here, though is attempting to defend a nearby trendline support (prior resistance – 108.04). A break lower here could see light thrown on demand at 107.21/107.41, which essentially is the decision point to break into the current supply area.
H1 timeframe:
Intraday activity swiftly changed hands at 108, turning lower from the psychological base heading into US hours Tuesday. Demand at 107.67/107.57 (prior supply) made a show and is, as of current price, holding.
Below demand re-opens the risk of a return to trendline support (106.03), trailed closely by the 100-period simple moving average at 107.25.
Structures of Interest:
H1 demand at 107.67/107.57 offers particularly potent confluence. The scope to approach higher levels is clearly evident on the higher timeframes, with intraday activity supported by a H4 trendline support. This could lead to moves higher, perhaps running for the 108 base and 200-day simple moving average, and maybe, with a little pressure, complete the daily falling wedge pattern at 109.30.
GBP/USD:
Monthly timeframe:
(Technical change on this timeframe is often limited though serves as guidance to potential longer-term moves)
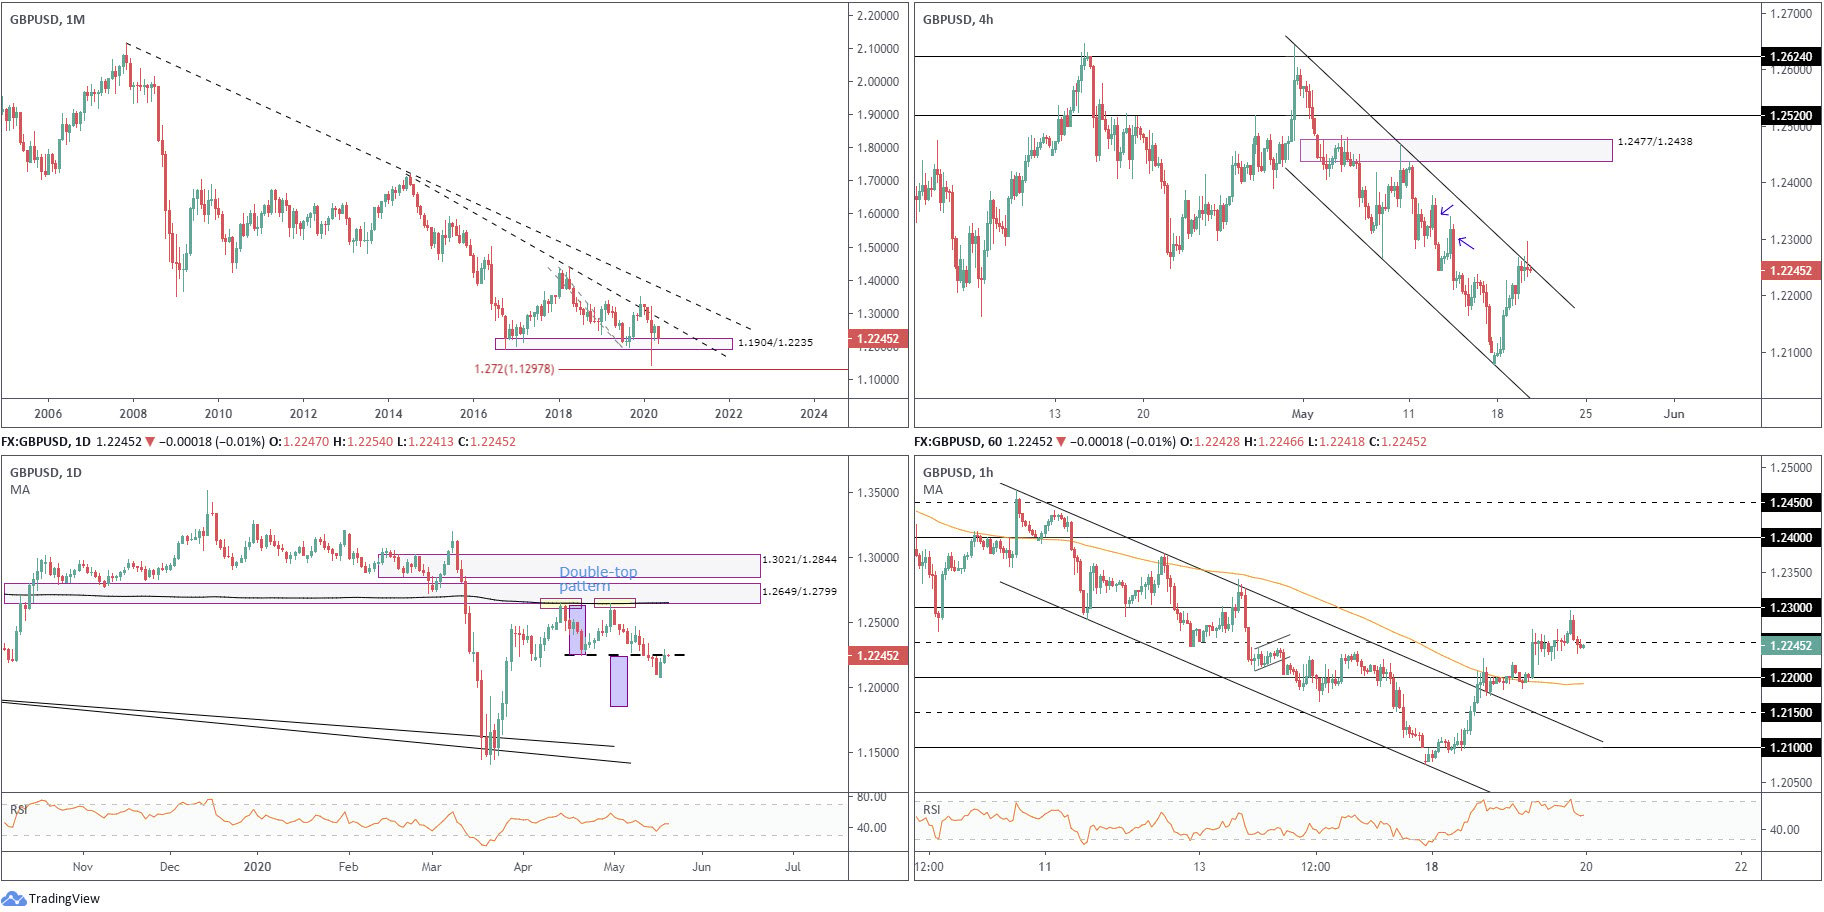
Though under pressure, support at 1.1904/1.2235 remains in motion in May. A violation of this area, nevertheless, puts forward a 127.2% Fib ext. level at 1.1297. Neighbouring resistance, should we see an attempt at recovery, can be found in the form of a trendline (1.7191).
Concerning the primary trend, lower peaks and troughs have decorated the monthly chart since early 2008.
Daily timeframe:
Partially altered from previous analysis –
A few pips south of supply at 1.2649/1.2799 (prior demand), a double-top pattern formed at 1.2647, with last Wednesday consuming the neckline (April 21 1.2247) and establishing a potential take-profit target (purple) around 1.1855.
As of late, nevertheless, the British pound clawed back some losses vs. the greenback, derailing downside attempts. However, traders, particularly pattern traders, will be watching the neckline at 1.2247 for signs of selling. Often times you’ll see a pattern breakout followed by a retest before moving to the take-profit target.
H4 timeframe
Sterling enjoyed considerable support since the week kicked off, drawing channel resistance (1.2642) into the frame on Tuesday, which appears to have derailed upside attempts for now. Additional supply is seen to the left of price around 1.2280 (lower arrow), though this base may simply be a reaction off the upper zone at 1.2324 (upper arrow).
A violation of the current channel resistance, therefore, shines the headlights on supply from 1.2477/1.2438, while downside could see price action attempt to fill the descending channel.
H1 timeframe:
After breaching channel resistance (1.2467), early Europe found legs Tuesday and advanced off 1.22, buoyed by additional support from the 100-period simple moving average.
Upside eventually ceded 1.2250 and reached a peak just south of 1.23, before mildly paring gains and closing sub 1.2250.
Structures of Interest:
As buyers and sellers butt heads around the daily double top neckline at 1.2247, along with H4 price closing under 1.2250 into the close and H4 rejecting channel resistance, this could put forward bearish themes today. There is, of course, one cautionary point to consider: monthly support at 1.1904/1.2235, though this area is positioned against the major trend.
DISCLAIMER:
The information contained in this material is intended for general advice only. It does not take into account your investment objectives, financial situation or particular needs. FP Markets has made every effort to ensure the accuracy of the information as at the date of publication. FP Markets does not give any warranty or representation as to the material. Examples included in this material are for illustrative purposes only. To the extent permitted by law, FP Markets and its employees shall not be liable for any loss or damage arising in any way (including by way of negligence) from or in connection with any information provided in or omitted from this material. Features of the FP Markets products including applicable fees and charges are outlined in the Product Disclosure Statements available from FP Markets website, www.fpmarkets.com and should be considered before deciding to deal in those products. Derivatives can be risky; losses can exceed your initial payment. FP Markets recommends that you seek independent advice. First Prudential Markets Pty Ltd trading as FP Markets ABN 16 112 600 281, Australian Financial Services License Number 286354.


 Access +10,000 financial
instruments
Access +10,000 financial
instruments