
This week’s economic calendar delivers several tier-1 risk events to monitor, including US consumer confidence data on Tuesday, Aussie inflation and US durable goods data on Wednesday, Q1 GDP and weekly jobless claims on Thursday in the US, followed by the Bank of Japan (BoJ) rate decision and the US Core PCE Price Index on Friday.
In the US, Advance Q1 US GDP data (2023) will be a key watch on Thursday this week at 1:30 pm GMT+1. Many desks expect a slightly lower annualised growth rate. Median estimates forecast growth to drop to 2.0% in Q1 from 2.6% in Q4 (2022). The forecast range, however, is set between 2.7% and 1.3%. Another widely watched US release will be the core personal consumer expenditure deflator. The median consensus estimate heading into the event calls for 0.3% MoM (in line with the previous month’s release) and 4.5% for YoY data (0.5 percentage points lower than the previous 5.0% print). As a note, should we print as expected, I do not feel this will be sufficient to discourage the Fed from hiking the Fed Funds rate by another 25 basis points the following week. Also of relevance, markets are currently pricing in a 90% probability of a 25 basis-point hike, bringing the Fed Funds Target range to between 5.0% and 5.25%.
Aussie Q1 (2023) CPI inflation will be released at 2:30 am GMT+1 on Wednesday. After reaching 7.8% in Q4 (2022), the highest quarterly inflation rate since 1990, Q1 inflation for 2023 is expected to cool to 6.8% compared to the year before, according to median forecasts. The Reserve Bank of Australia’s (RBA) Official Cash Rate is 3.6%, and according to the ASX 30-Day Interbank Cash Rate Futures (May 2023), markets are pricing in the likelihood of leaving the Cash Rate Target unchanged again on 2 May. However, following the minutes from the RBA’s previous meeting, Board members emphasised that the decision to pause policy tightening was close, providing the AUD with some fuel.
The Bank of Japan (BoJ) is also in the spotlight this week. Although there is no expectation of altering the central bank’s ultra-loose policy, this will be the first meeting under the new head Kazuo Ueda.
Earnings are also in the limelight this week, focussing on several key sectors in the US equities space. Out of the tech sector, Alphabet Inc. (GOOGL) and Microsoft Corp. (MSFT) release their Q1 (2023) earnings on Tuesday after the market close, followed by Meta Platforms (META) on Wednesday and Amazon (AMZN) on Thursday, also after the market close.
Technical Markets to Watch for the Week Ahead
Currencies:
Sell-On-Rally Scenario for the USD?
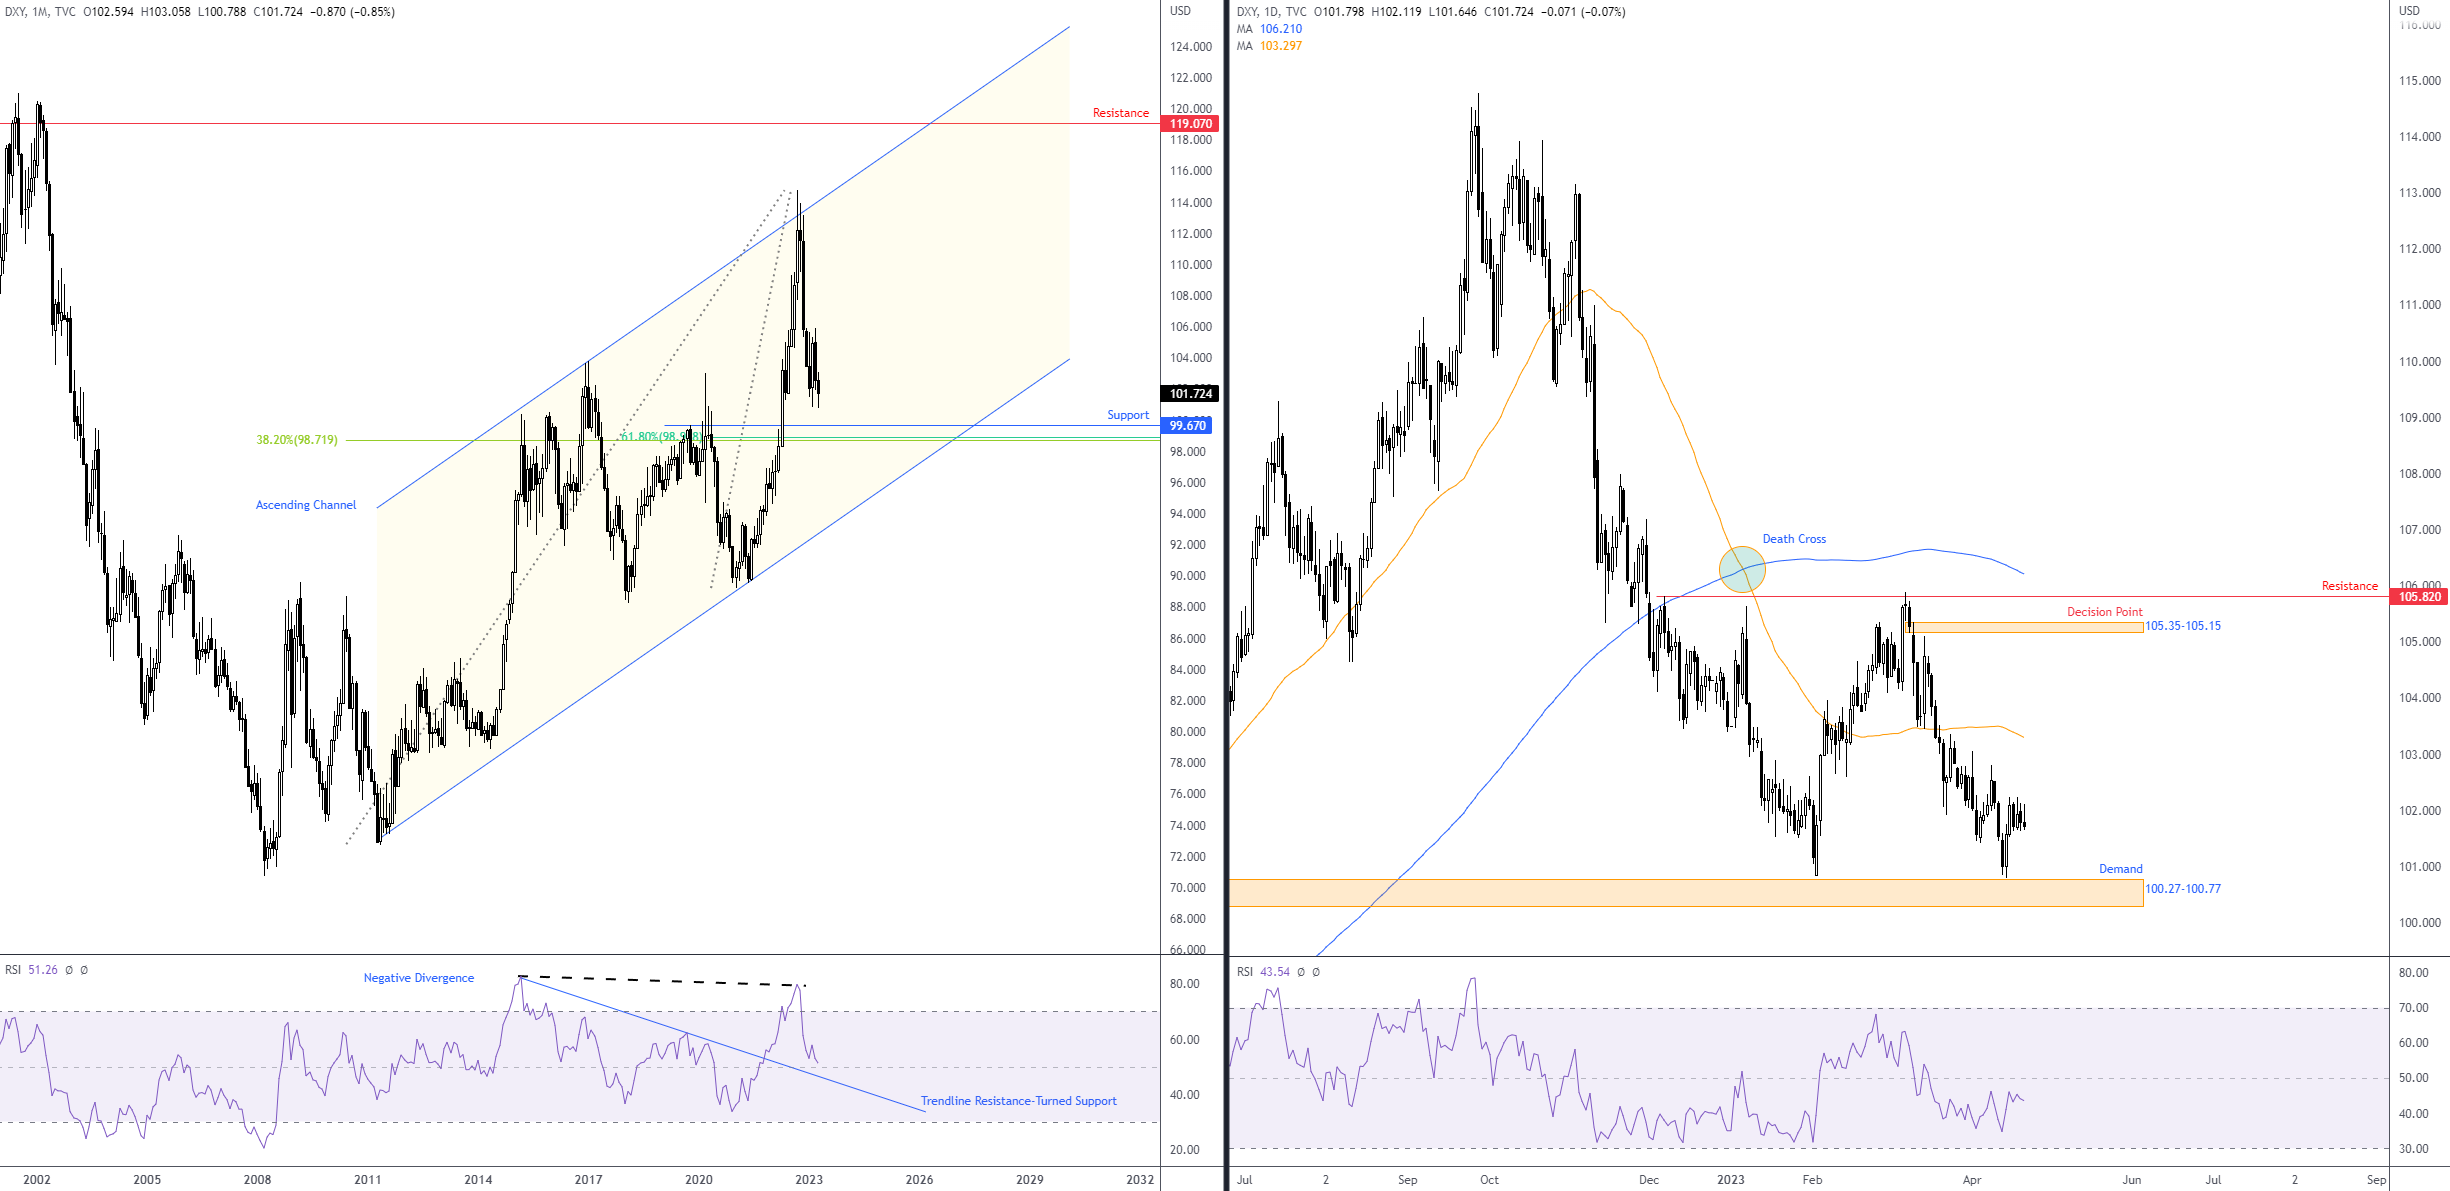
According to the US Dollar Index, the US dollar found some respite last week, eking out a marginal gain of 0.1%, a move that snapped a five-week bearish phase.
Those who read my previous Weekly Market Insight may recall the following (italics):
[…] Before sellers attempt to overthrow the 100.27-100.77 demand on the daily scale, chartists—given the demand—may want to pencil in the possibility of a pop higher. Nevertheless, this will unlikely be anything to write home about and is unlikely to move beyond the 50-day simple moving average at 103.46: a sell-on-rally scenario will likely be on the watchlist for many going forward.As evident from the daily chart, we observed the US dollar print a modest recovery last week that has, for now, displayed a lack of eagerness. So, with this being the case, my initial outlook remains unchanged as we step into the final full week of April: the potential to move higher in the short term, yet medium-term analysis suggests USD bears are likely to remain in the driving seat until monthly support at 99.67.
For those who have not read the previous research, I will attempt to explain my rationale behind the current bearish vibe.
Note that although the monthly chart displays an uptrend, there is scope to extend the 7-month correction from 114.78, targeting monthly support from 99.67, hence the medium-term bearish setting for the buck. As a result, although the overall longer-term trend faces north, I feel USD bears still have some gas in the tank. However, it is worth noting that the Relative Strength Index (RSI) on the monthly timeframe shows that the indicator remains on the doorstep of its 50.00 centreline, which happens to be shadowed by a trendline resistance-turned-support from the high 82.87. While this echoes a bullish view, the RSI on the daily chart remains nestled comfortably beneath its 50.00 centreline (telling market participants that average losses exceed average gains: negative momentum).
Consequently, as I communicated in the previous research, while USD bulls may attempt to climb this week, I find it difficult to imagine the unit travelling beyond the 50-day simple moving average at 103.30. Thus, this remains a sell-on-rally market for me, targeting an eventual breach of daily demand at 100.27-100.77 to monthly support from 99.67.
 EURUSD Push North?
With Europe’s single currency commanding nearly 60.0% of the weight in the US Dollar Index, there is a natural inverse correlation, and any downside pressure in the buck will likely reinforce the euro.
Here is where I stand with the most widely traded currency pair, which finished last week unmoved.
The weekly timeframe has buyers and sellers battling for position above resistance-turned-support at $1.0888. I noted the following in a EUR/USD report last week (italics):
Technically speaking, the currency pair is in the early phase of an uptrend on the weekly after pencilling in a higher high at $1.1076, opening the gate for a run to resistance visible at $1.1174. A similar view is evident on the daily timeframe; the pair has gradually risen since retesting the breached 50-day simple moving average at $1.0765. Resistance warrants attention at $1.1138, and support is thin until back around the SMA, as recent upside movement appears to have consumed any local support.
Price action has been choppy out of the H1 timeframe since early last week. Still, I continue to monitor the $1.10 handle, given the gathering of Fibonacci ratios just above the psychological boundary: three 1.272% Fibonacci projection ratios between $1.1013 and $1.1010 (many Harmonic players may recognise these ratios as ‘alternate’ AB=CD patterns) and a 61.8% Fibonacci retracement at $1.1013. As a result, any whipsaw above the psychological level this week could see active short-term sellers emerge from $1.1013ish as sellers attempt to take advantage of any buy-stops filled above $1.10 (commonly referred to as a ‘stop run’). Should sellers push, the $1.09 handle is a notable downside objective on the H1.
In conclusion, with the bigger picture indicating higher prices to at least daily resistance from $1.1138, a bull trap forming above $1.10 on the H1 timeframe may be short-lived. Overall, therefore, despite the likelihood of a short-term bearish scenario forming above $1.10, a continuation move higher to H1 resistance at $1.1068 is also on the table.
 Commodities:
Spot Gold (XAU/USD) Threatening Weekly Support
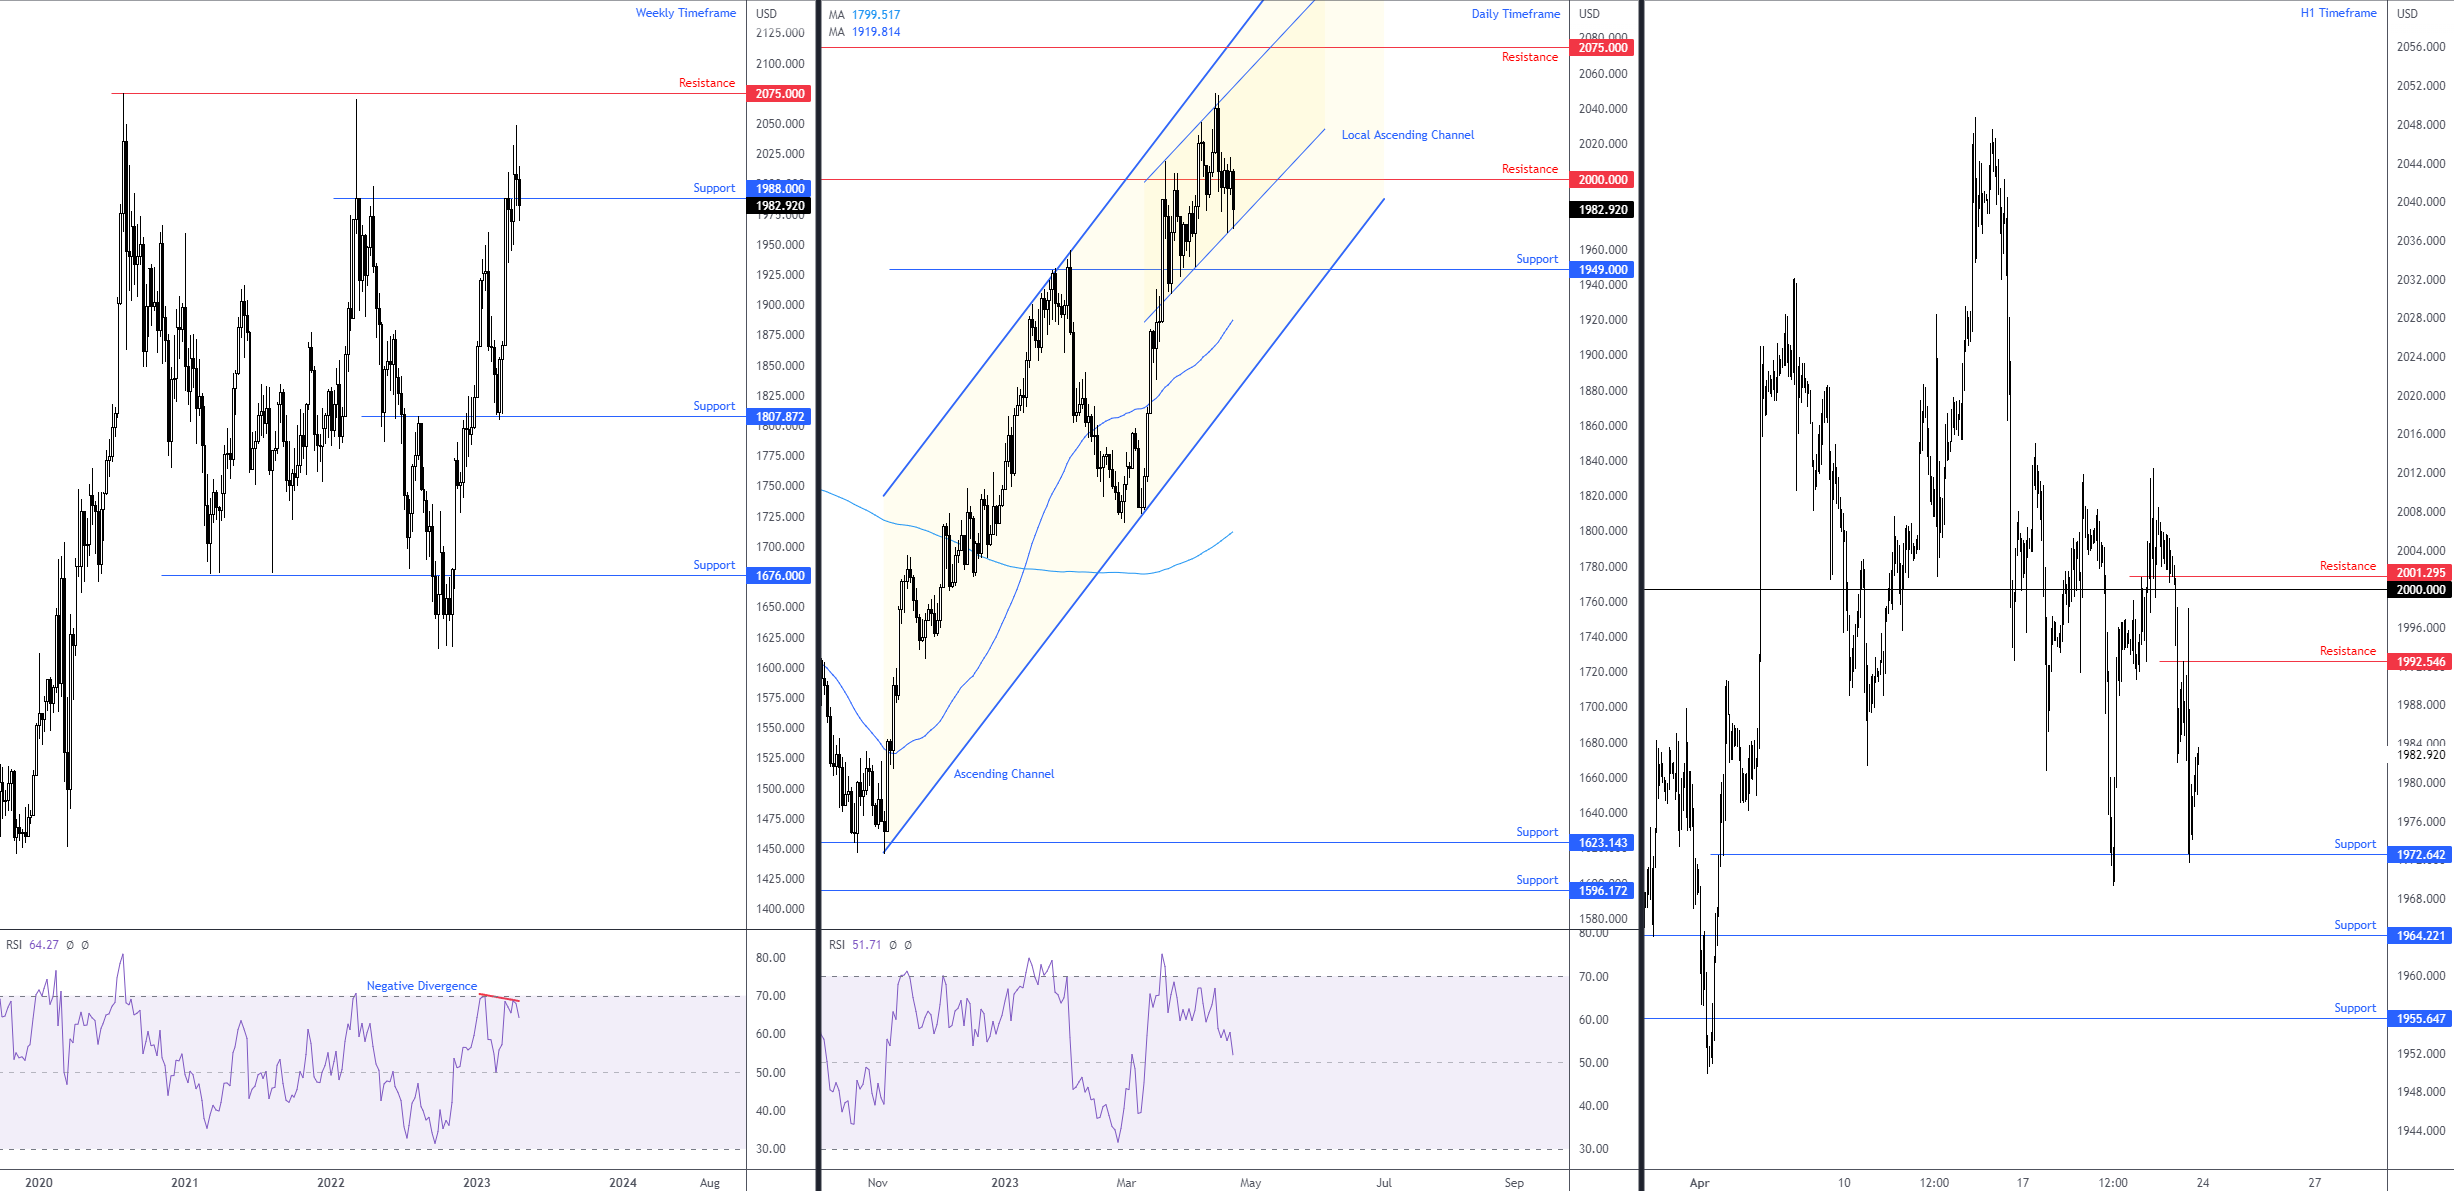
Clocking a $2,048 peak mid-month has the yellow metal on track to chalk up a dominant upper candle shadow on the monthly timeframe. Further losses this week would end the month in the shape of a bearish Shooting Star candlestick pattern.
The weekly timeframe shows that last week ended just shy of session lows, down 1.1%. This places a bold question mark on support at $1,988, which, for me, is the last line of defence until as far south as support coming in from $1,807. Therefore, this will be an interesting watch over the next few weeks. I also see early signs of negative divergence from the Relative Strength Index (RSI), a whisker south of the overbought space (70.00).
Meanwhile, on the daily timeframe, price action is shaking hands with the lower boundary of a local ascending channel taken from the low $1,934. We can also clearly see the precious metal finding comfort below the widely watched $2,000 level. If we engulf current channel support, support warrants consideration at $1,949, closely shadowed by the 50-day simple moving average at $1,919 and longer-term channel support extended from the low $1,1616.
On more of a shorter-term timeframe, movement on the H1 scale has price rebounding from support at $1,972, which happens to converge with the local channel support on the daily scale. As such, extending the rebound from current H1 support should not surprise this week, taking aim at H1 resistance from $1,992, sheltered just south of $2,000 and H1 resistance at $2,001.
Overall, chart studies show bearish players may have the upper hand going forward in the medium term, particularly if the unit begins exploring beneath the weekly support mentioned above at $1,988. With this in mind, space between $2,000 and $1,992 could be an area sellers make a show from this week on the H1 if additional recovery gains materialise. Though should $2,000/$1,992 fail to welcome price this week, a H1 close beneath the $1,972 support could have breakout sellers aim for H1 support from $1,964 and $1,955.
 Equities:
Tesla Pullback to Fill Downside Gap?
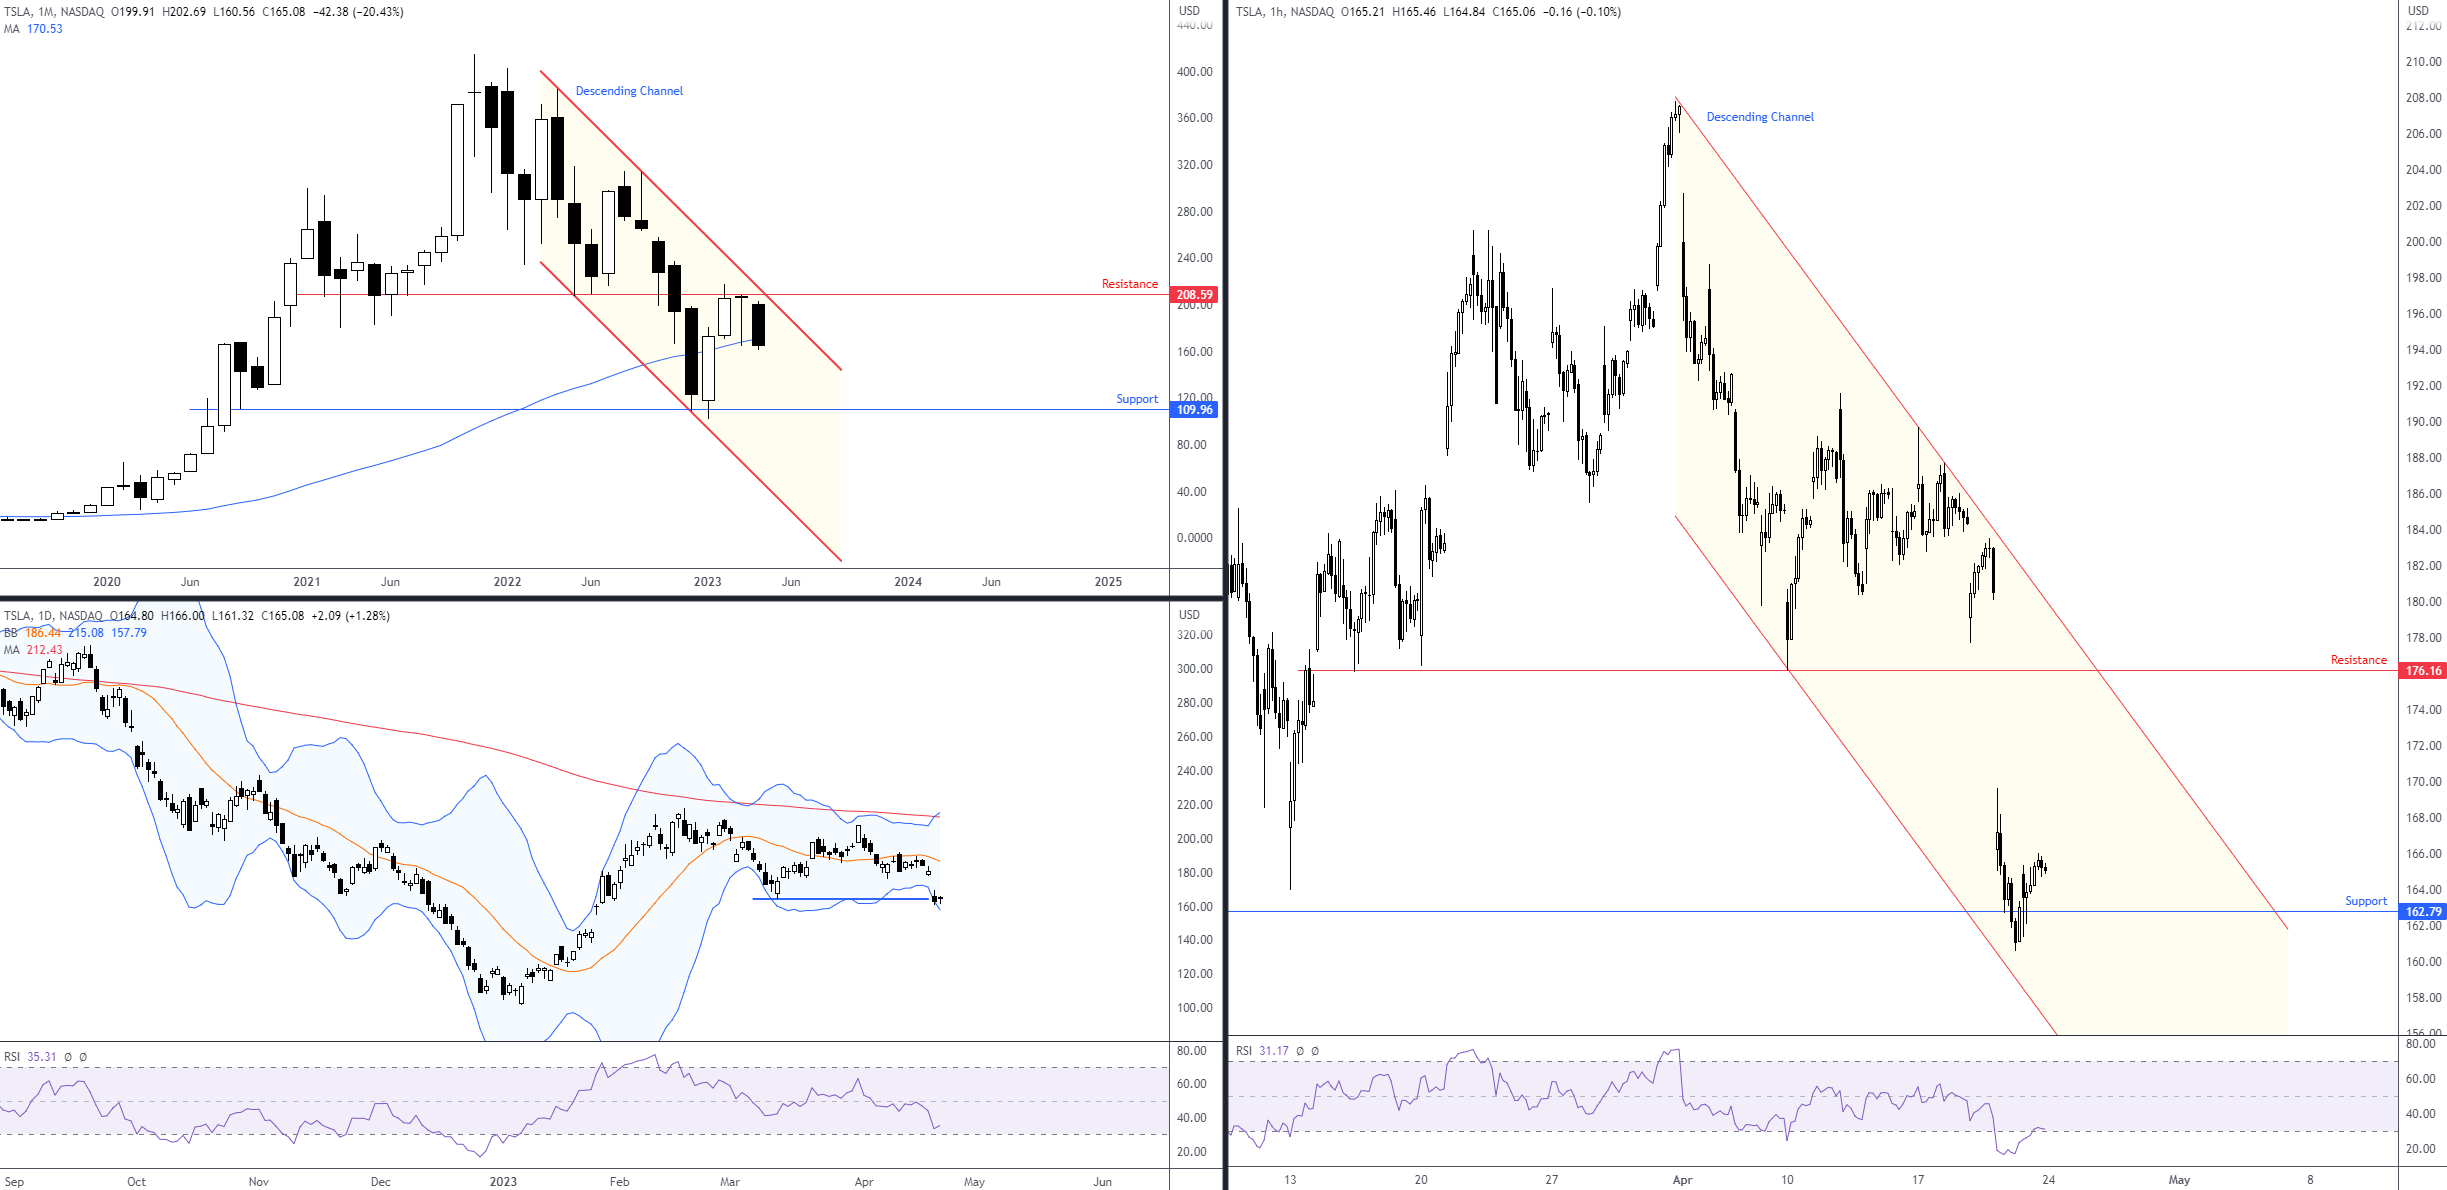
Down nearly 11% on the week, Tesla (TSLA) shares plunged following disappointing Q1 (2023) earnings compared with Q1 a year before. Technically, at least out of the longer-term charts, the recent selloff is unlikely to have raised too many eyebrows.
From the monthly timeframe, I noted price action was testing a particularly notable support-turned-resistance at $208.59 in recent analysis, in a market trending lower since topping at $414.50 in late 2021. I also emphasised the neighbouring channel resistance taken from the high $384.29. MTD, the stock price is down an eye-watering 20.4% and on the verge of closing south of its 50-month simple moving average (SMA), fluctuating at $170.53. Needless to say, there’s lots of fresh air below the SMA until reaching support at $109.96.
As evident from the daily timeframe, much of the week’s downside emerged on Thursday. The company’s stock gapped considerably lower at the open following Wednesday’s earnings and ended the day down nearly 10%. As you can see, this reaffirmed the bearish presence I see on the monthly scale: pencilling in a fresh lower low beyond the $163.91 low (13 March) and corroborating the downtrend. However, at the same time, price movement touched the lower Bollinger Band (set to three standard deviations). Consequently, a pullback may be on the cards this week, particularly if the Relative Strength Index (RSI) crosses swords with oversold space.
From the H1 chart, the stock rebounded from support at $162.79 on Friday, aided by an oversold signal from the RSI (technicians will likely acknowledge that we also have channel support nestled beneath current support extended from the low $176.11). Overhead, resistance calls for attention at $176.16.
In light of the above analysis, I feel the stock is oversold and a pullback is perhaps on the table this week, which could see price attempt to fill the recent downside gap and draw in H1 resistance mentioned above at $176.16. Therefore, although the overall trend favours sellers, a short-term bullish scenario appears to be brewing.
 Bonds:
5-year US Treasury Yield Working with Long-Term and Medium-Term AB=CD Structure
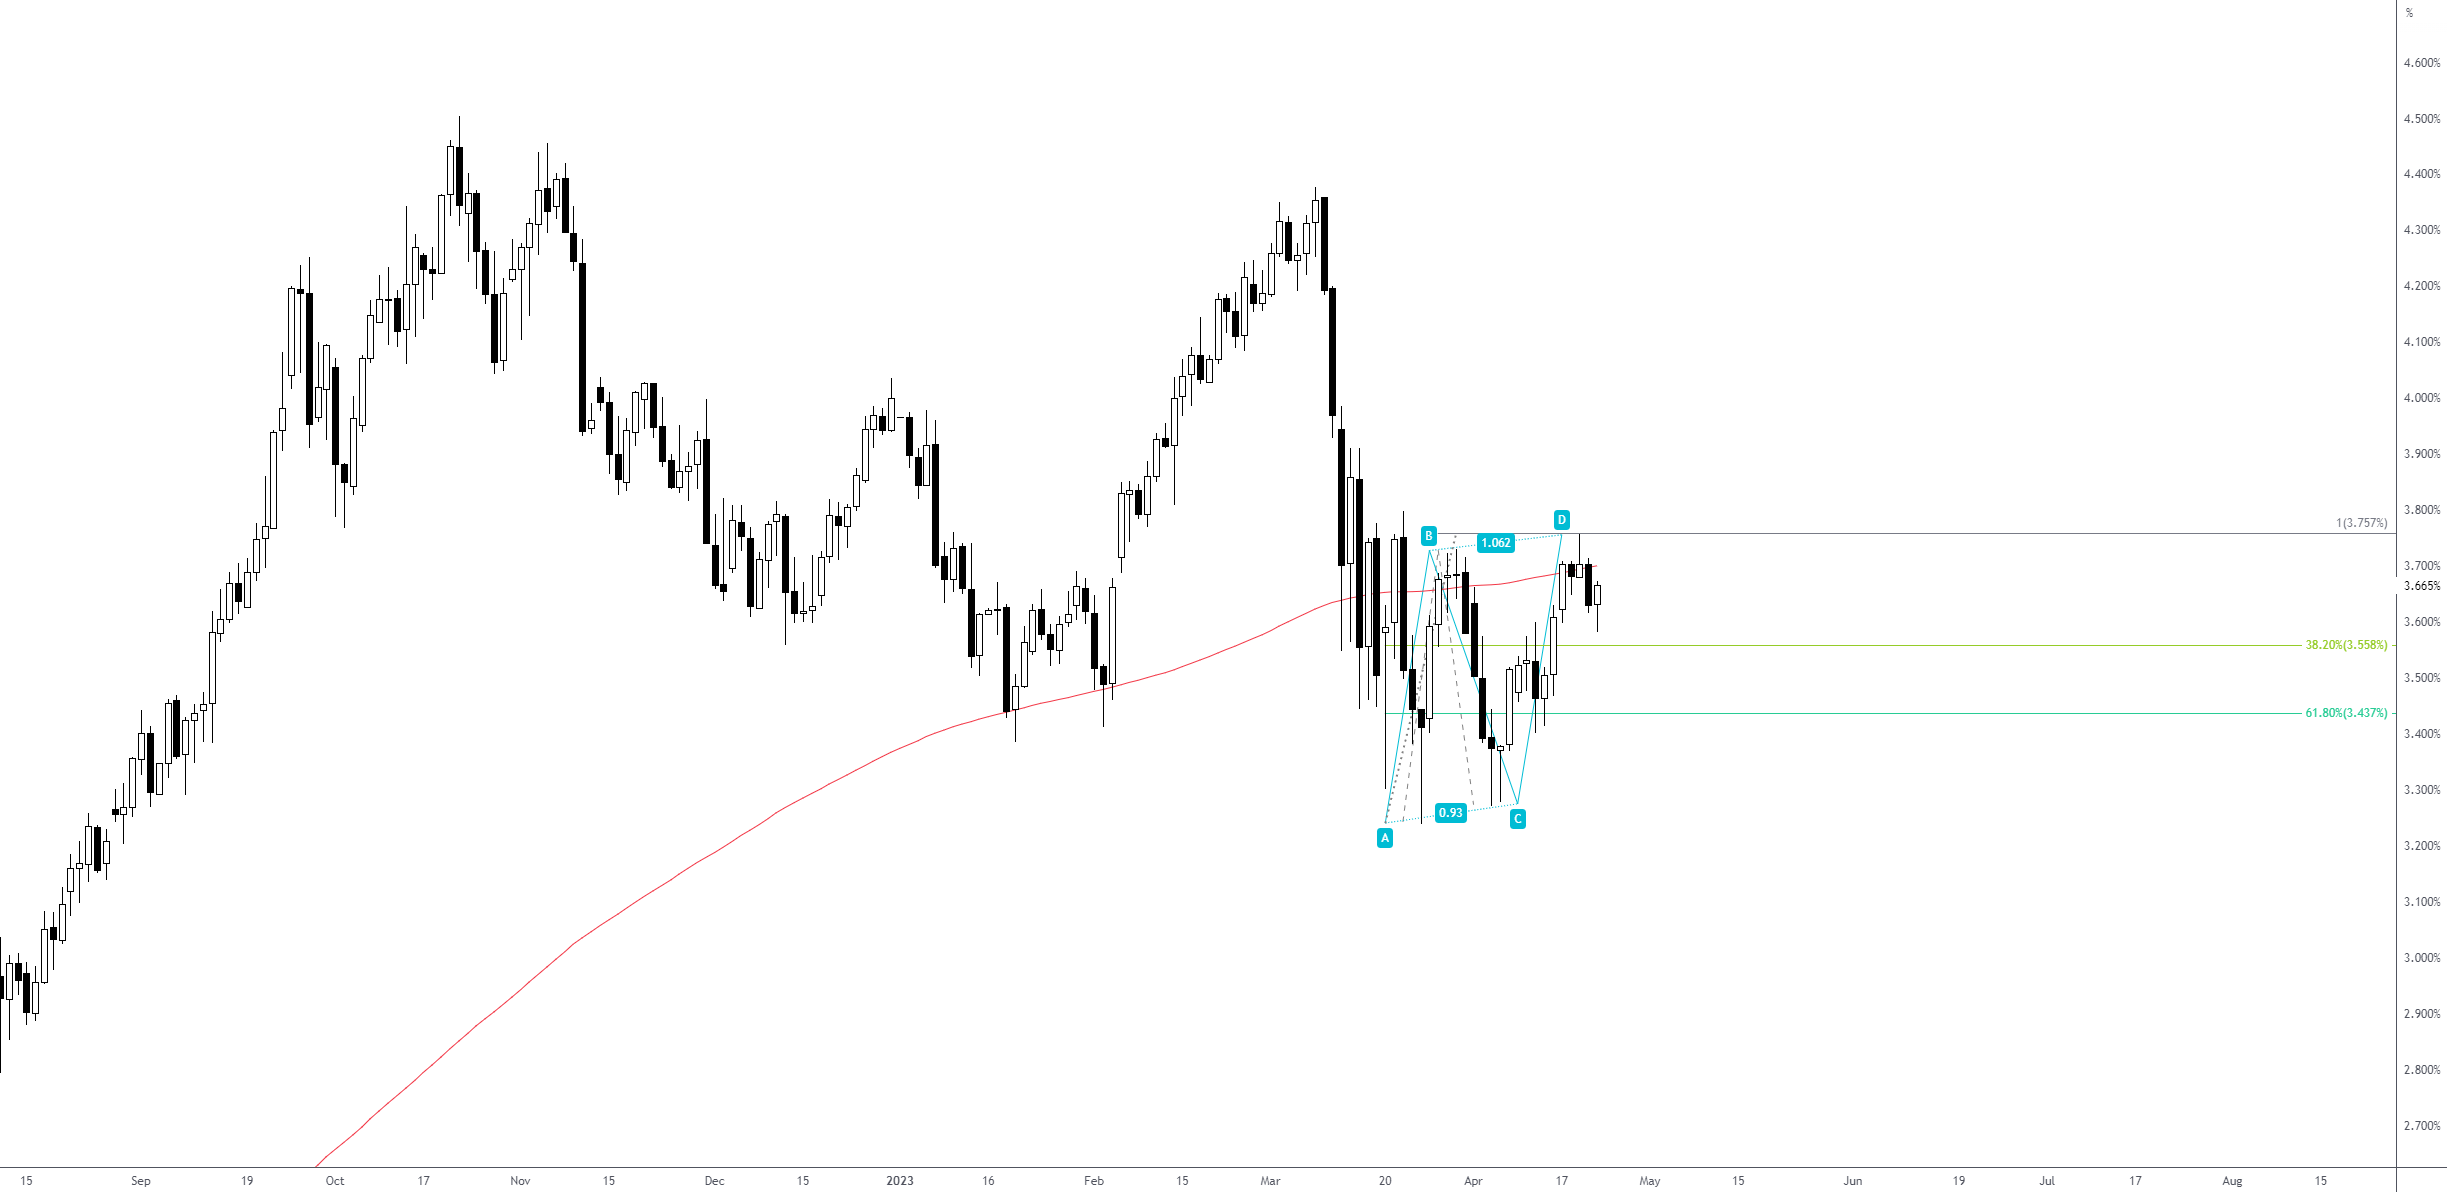
In the previous Weekly Market Insight, I directed the technical spotlight to a long-term harmonic equivalent AB=CD bullish structure on the 5-year US Treasury yield weekly chart in a market trending higher since August 2020. The AB=CD zone, as you can see, has offered this market a technical floor since mid-March, denoted by the 100% projection at 3.243%.
Weekly Chart:
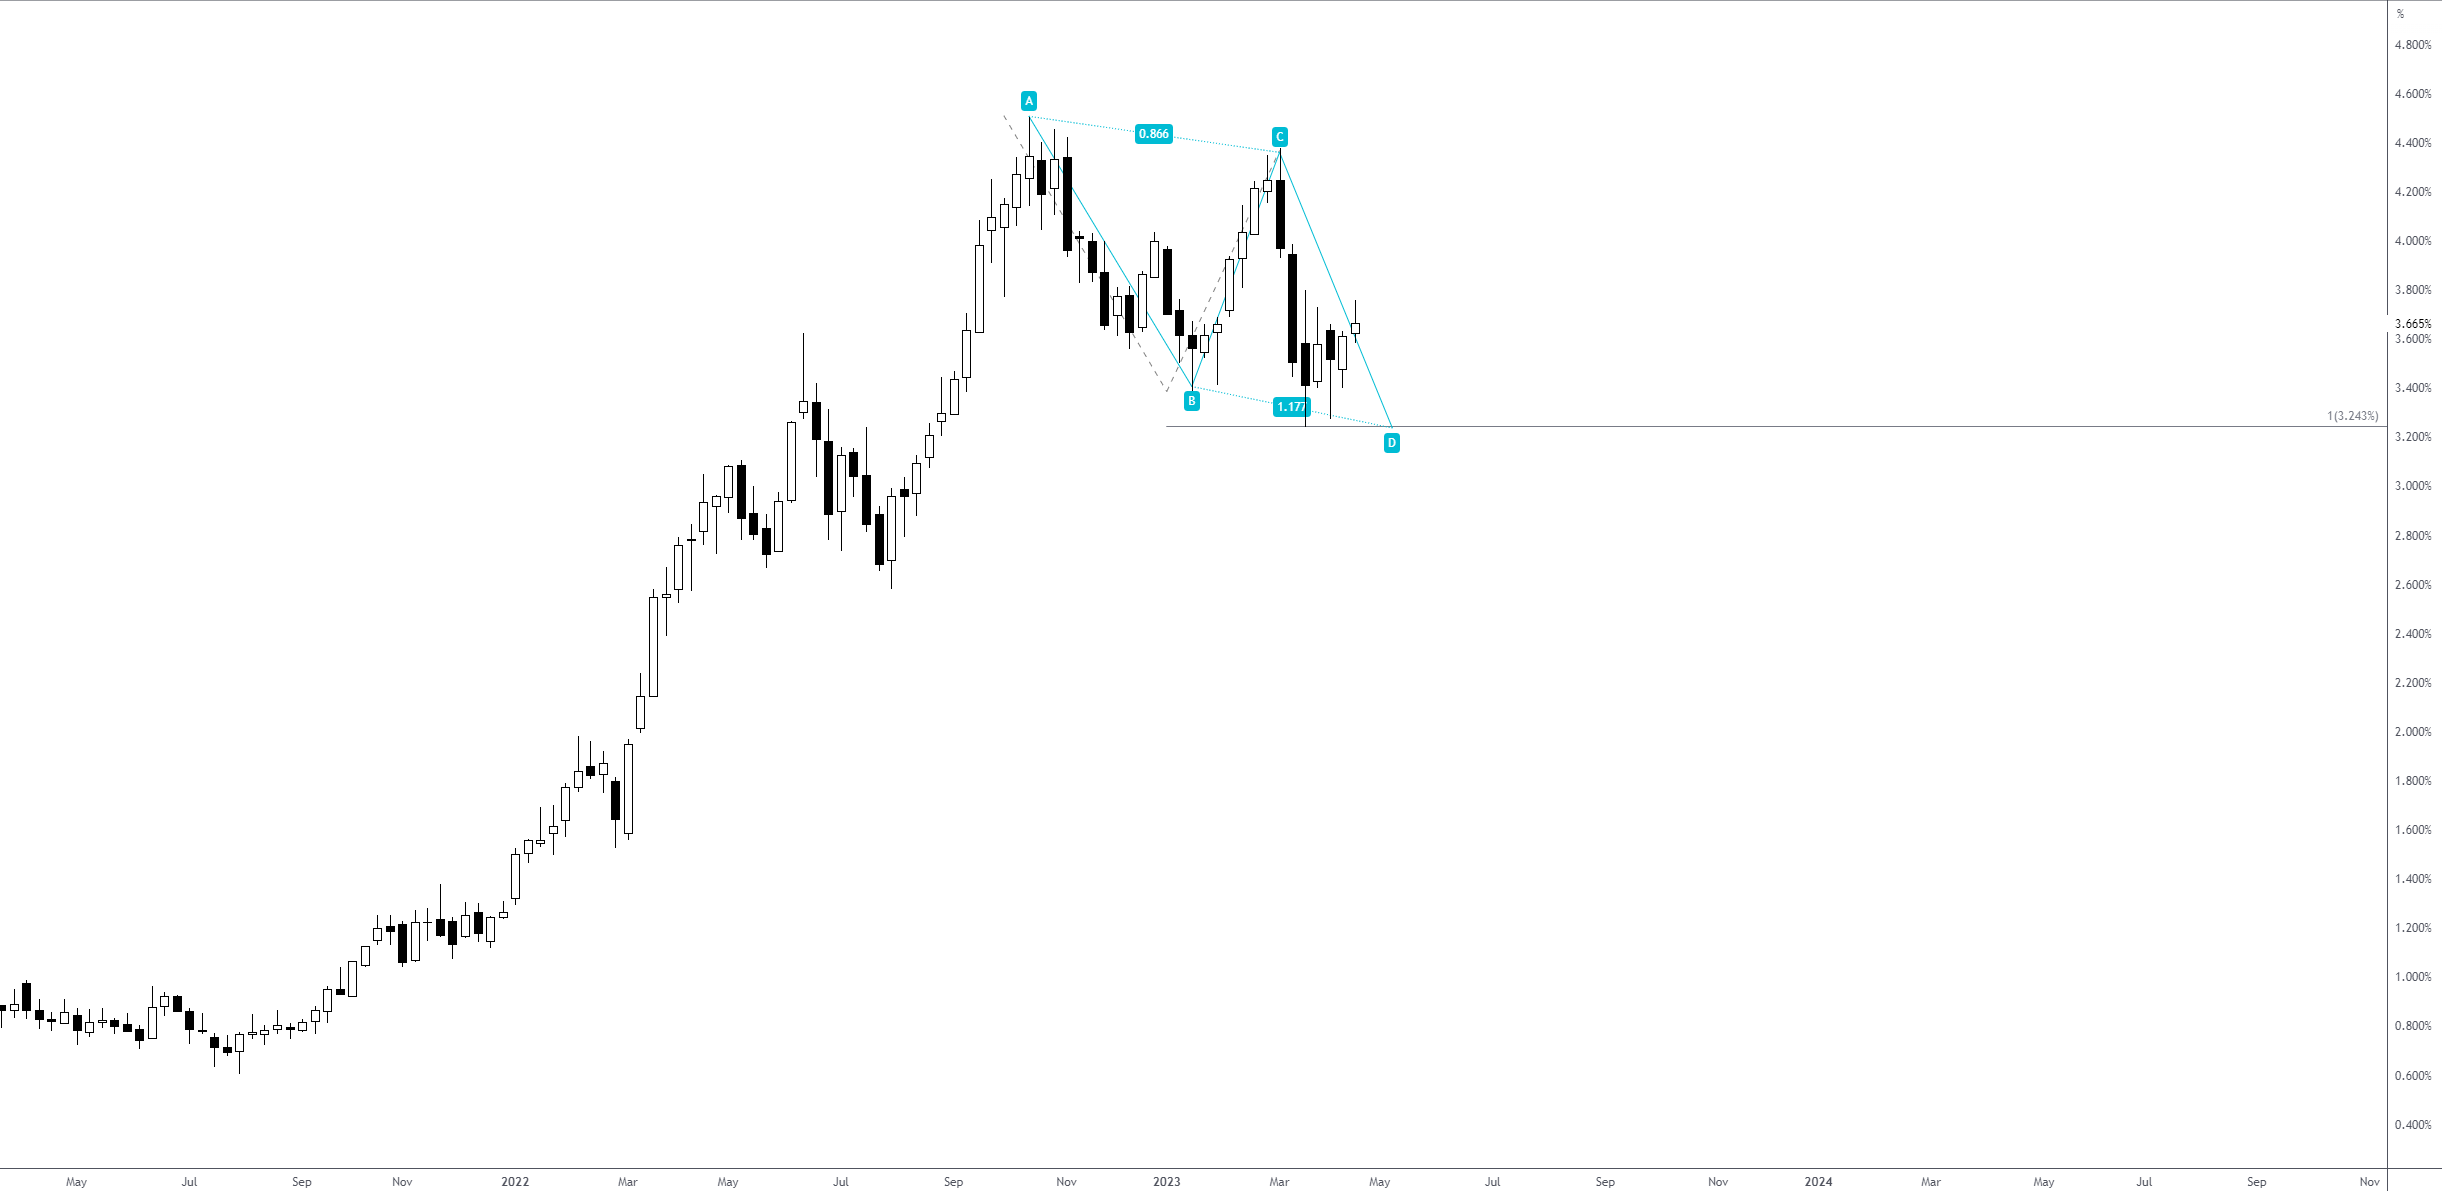 What’s interesting, though, is on the daily timeframe we can see that the reaction from the weekly AB=CD floor has carved out a daily equivalent AB=CD bearish pattern at 3.757%. This, coupled with Wednesday’s bearish Shooting Star candle pattern and nearby dynamic resistance derived from the 200-day simple moving average at 3.700%, could be enough to motivate a downside move this week to test at least the 38.2% and 61.8% Fibonacci retracement ratios (derived from legs A-D) at 3.558% and 3.437%, respectively.
Daily Chart:
 Cryptocurrencies:
BTC/USD Looking to Extend Losses; 50-Day SMA Eyed
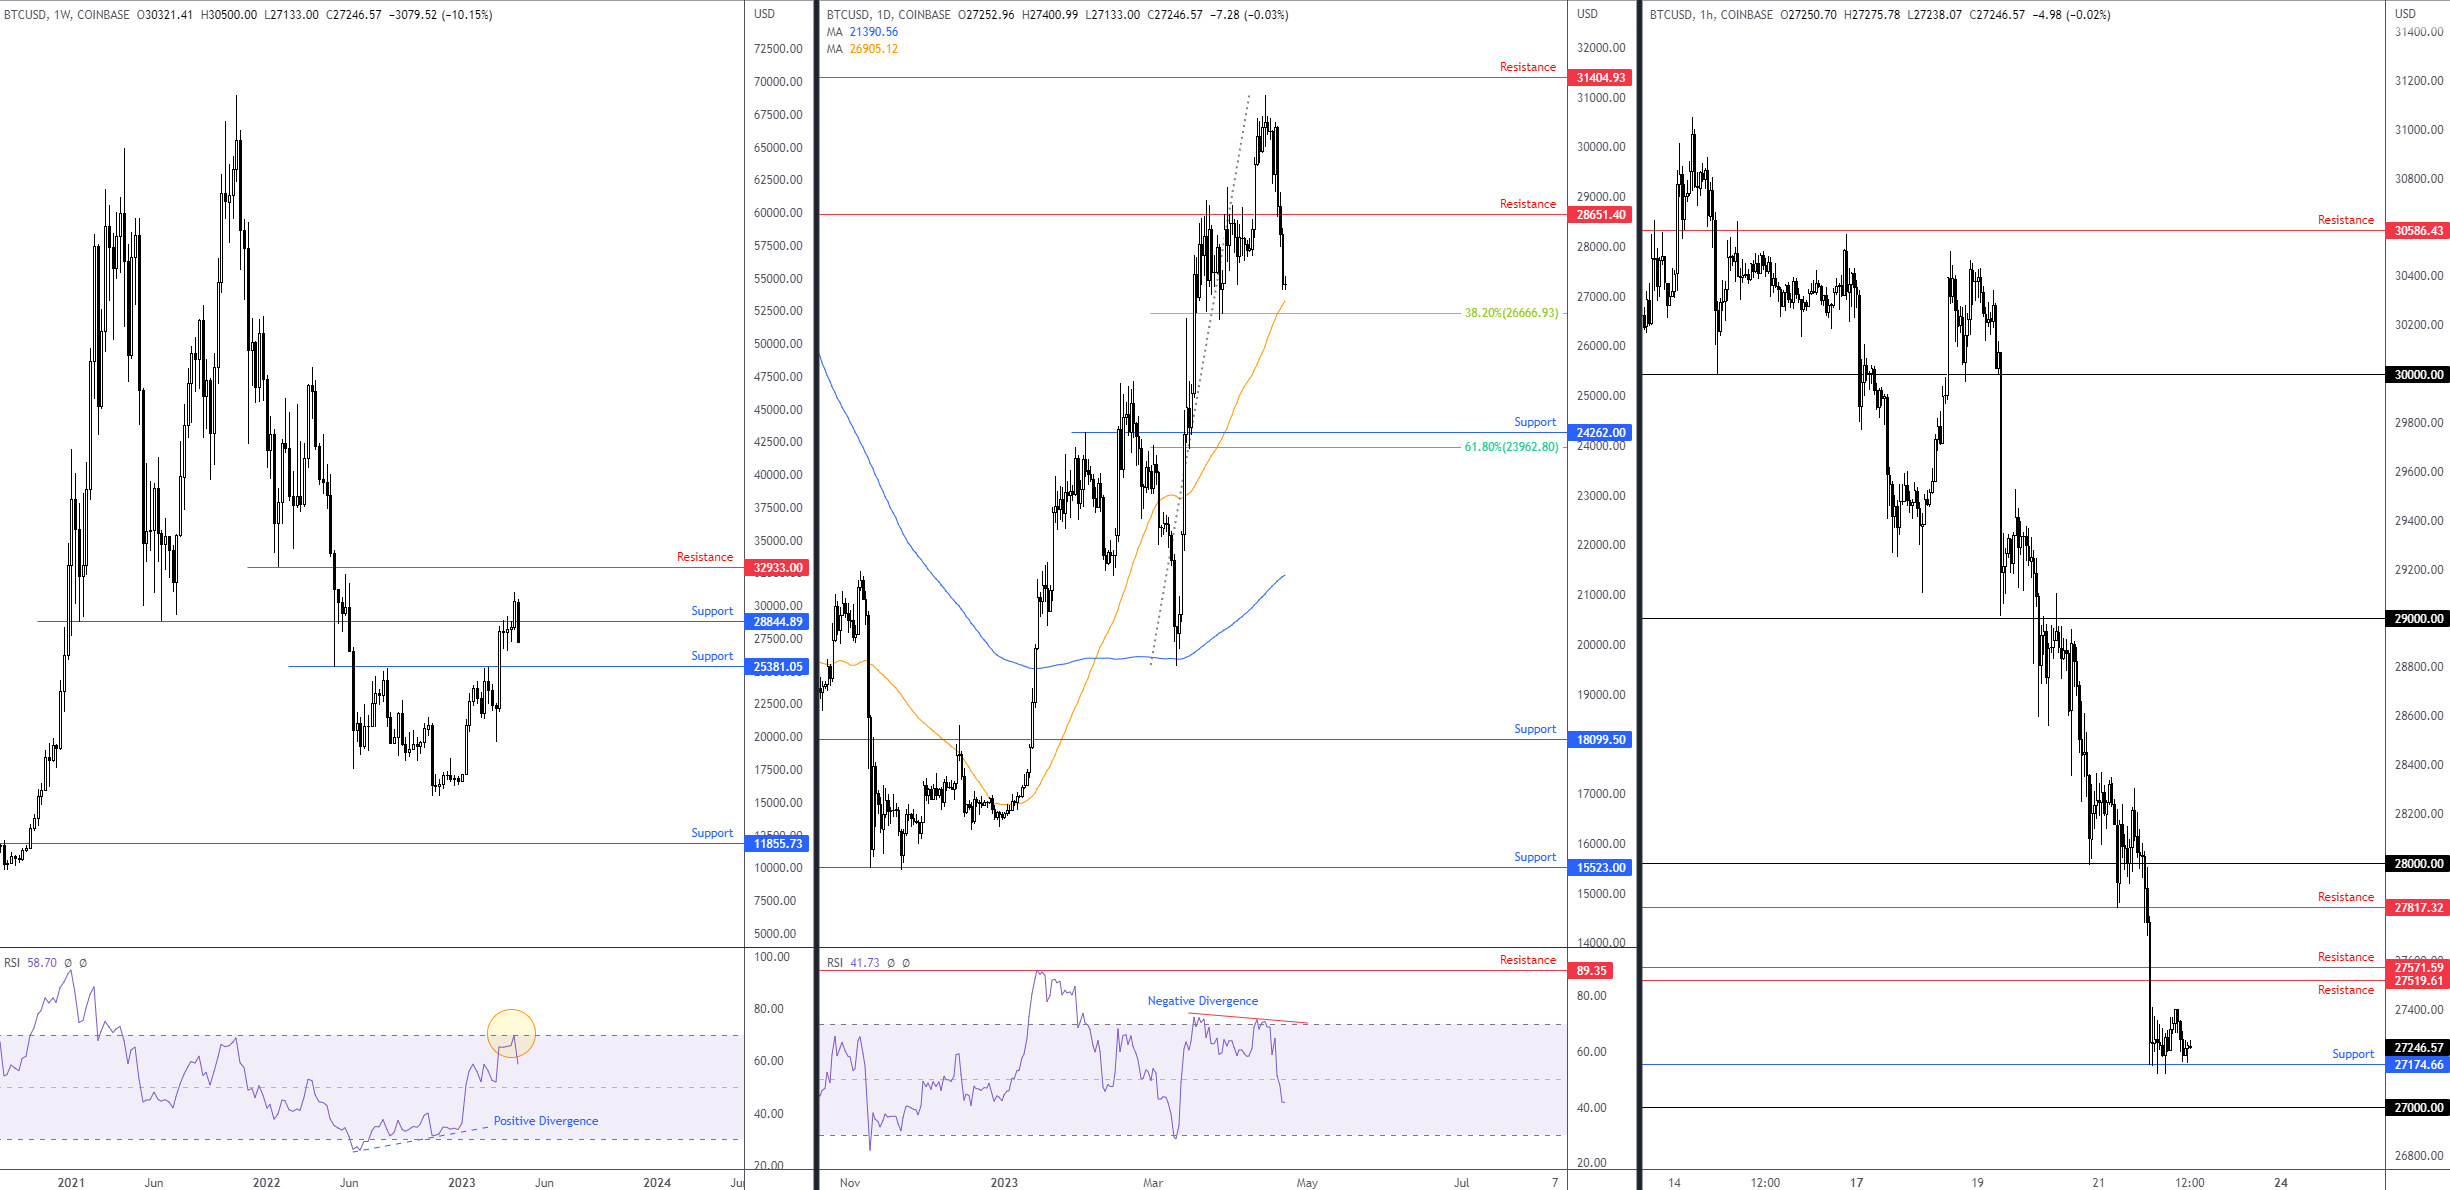
Bitcoin reclaimed all the prior week’s upside move versus the US dollar last week and some. This, aided by an overbought signal from the weekly timeframe’s Relative Strength Index (RSI), has directed the major cryptocurrency back under weekly support ($28,844) and unmasked weekly support drawn at $25,381.
Following clear-cut negative divergence from the RSI (and the indicator crossing under the 50.00 centreline), price action on the daily timeframe nosedived through support at $28,651 and is closing in on the 50-day simple moving average at $26,906 (aligns with the 38.2% Fibonacci retracement at $26,666). Beyond here, aside from weekly support highlighted above at $25,381, daily support is not expected to put in an appearance until $24,262, accompanied by a 61.8% Fibonacci retracement ratio at $23,962.
In the short term, I see the crypto recently bumped heads with H1 support at $27,174, a move throwing light on two nearby H1 resistances at $27,571 and $27,519. Outside of these noted levels, resistance is seen at $27,817 and $28,000, while to the downside, additional support falls in at around the $27,000 handle.
Based on the three aforementioned timeframes, sellers appear to be in command. The rebound from H1 support at $27,174 is unlikely to garner much attention, and sellers could, therefore, respond to H1 resistance between $27,571 and $27,519 in early trading, targeting $27,000 on the H1, which happens to coincide closely with the daily timeframe’s 50-day simple moving average at $26,906.
 Charts: TradingView
DISCLAIMER:
The information contained in this material is intended for general advice only. It does not take into account your investment objectives, financial situation or particular needs. FP Markets has made every effort to ensure the accuracy of the information as at the date of publication. FP Markets does not give any warranty or representation as to the material. Examples included in this material are for illustrative purposes only. To the extent permitted by law, FP Markets and its employees shall not be liable for any loss or damage arising in any way (including by way of negligence) from or in connection with any information provided in or omitted from this material. Features of the FP Markets products including applicable fees and charges are outlined in the Product Disclosure Statements available from FP Markets website, www.fpmarkets.com and should be considered before deciding to deal in those products. Derivatives can be risky; losses can exceed your initial payment. FP Markets recommends that you seek independent advice. First Prudential Markets Pty Ltd trading as FP Markets ABN 16 112 600 281, Australian Financial Services License Number 286354.


 Access +10,000 financial
instruments
Access +10,000 financial
instruments