
The final full week of May is upon us and delivers a range of heavyweight data to be conscious of this week.
Monday will be relatively quiet; the calendar lacks tier-1 economic data, and Canadian banks will be closed in observance of Victoria Day. Tuesday will see a slew of manufacturing and services PMIs released across Europe, the UK and the US, thus delivering a snapshot of their respective economy’s health.
In the US this week, aside from the manufacturing and services PMIs on Tuesday, Wednesday welcomes the minutes from the latest FOMC meeting, new home sales data, and the Richmond manufacturing index print. However, how much weight the FOMC meeting minutes will have and what impact will be seen in the currency markets is questionable. Last week witnessed a number of Fed speakers comment on next month’s rate decision amidst high inflation in the US. Fed member Logan commented that she does not believe current data justifies a pause in policy firming. Fed member Bullard—a prominent hawk—also communicated that he will likely back another rate hike in June. Fed Chair Jerome Powell was also in the spotlight on Friday, reiterating that the Fed will make decisions on a meeting-by-meeting approach. Nevertheless, Powell emphasised a somewhat dovish stance, stating that rates may not have to be raised as high as expected. This, along with a pause in negotiations on Friday to raise the federal government’s debt ceiling, weighed on the dollar, pulling the US Dollar Index 0.3% lower and trimming a three-day winning streak that led to a two-month peak unfolding at 103.62. Market pricing for the next FOMC rate decision shows an 82% probability that the Fed will pause on 14 June over an 18% chance of another 25 basis-point hike, which would pull the Fed Funds target range to 5.25%-5.50% and mark an 11th consecutive hike since March 2022. This is despite the possibility of a rate hike being completely dismissed at the beginning of May and is likely one of the drivers behind the recent dollar strength.
Thursday will also see quarterly US GDP (second reading) and weekly unemployment claims. Wrapping up the week, the core Personal Consumption Expenditures (PCE) index is released on Friday. This is a key release and one that investors will watch closely. YoY, economists expect the core PCE index to drop to 4.6% in April, in line with the previous month’s value. MoM, market consensus calls for a 0.3% print, also in line with the previous month’s value.
In the UK, Inflation data will be widely watched ahead of the European cash open at 7:00 am GMT+1, a release poised to heavily influence the Bank of England’s (BoE) next rate decision and will likely be a key driver of GBP pairs. Annual inflation has been around the 10% mark since the summer of last year, and many desks are projecting a sizeable slowdown in consumer prices this week. Economists polled by Reuters call for consumer prices to slow to 8.3% in the twelve months to April (median projection), though some desks call for a sub 8.0% print. If we get below 8.0% (or near this rate), market pricing will likely change for the BoE rate decision. As of writing, markets are pricing around another 38 basis points of tightening for the next two central bank meetings. Yet, a drastic move lower in consumer prices this week may then see just one more rate hike before a pause, a move which would pull the Official Bank Rate to 4.75% and represent the 13th consecutive time the central bank has increased rates. A sizeable slowing in consumer prices could weigh on the GBP/USD this week; as noted, this could see market pricing change considerably and observe the BoE pause sooner than projected. The GBP/USD recently refreshed YTD peaks of $1.2680, followed by a moderate pullback seen earlier in May, with movement snapping an eight-week winning streak. Wednesday will also see two speeches from the BoE Governor Bailey, one at 10:30 am and the other at 2:00 pm GMT+1.
Additional data to be mindful of is the Reserve Bank of New Zealand (RBNZ), expected to announce its twelfth rate hike in the early hours of trading on Tuesday, bringing the Official Cash Rate to 5.5%.
Technical Markets to Watch for the Week Ahead
Currencies:
103.98-103.67 Eyed for the Dollar?
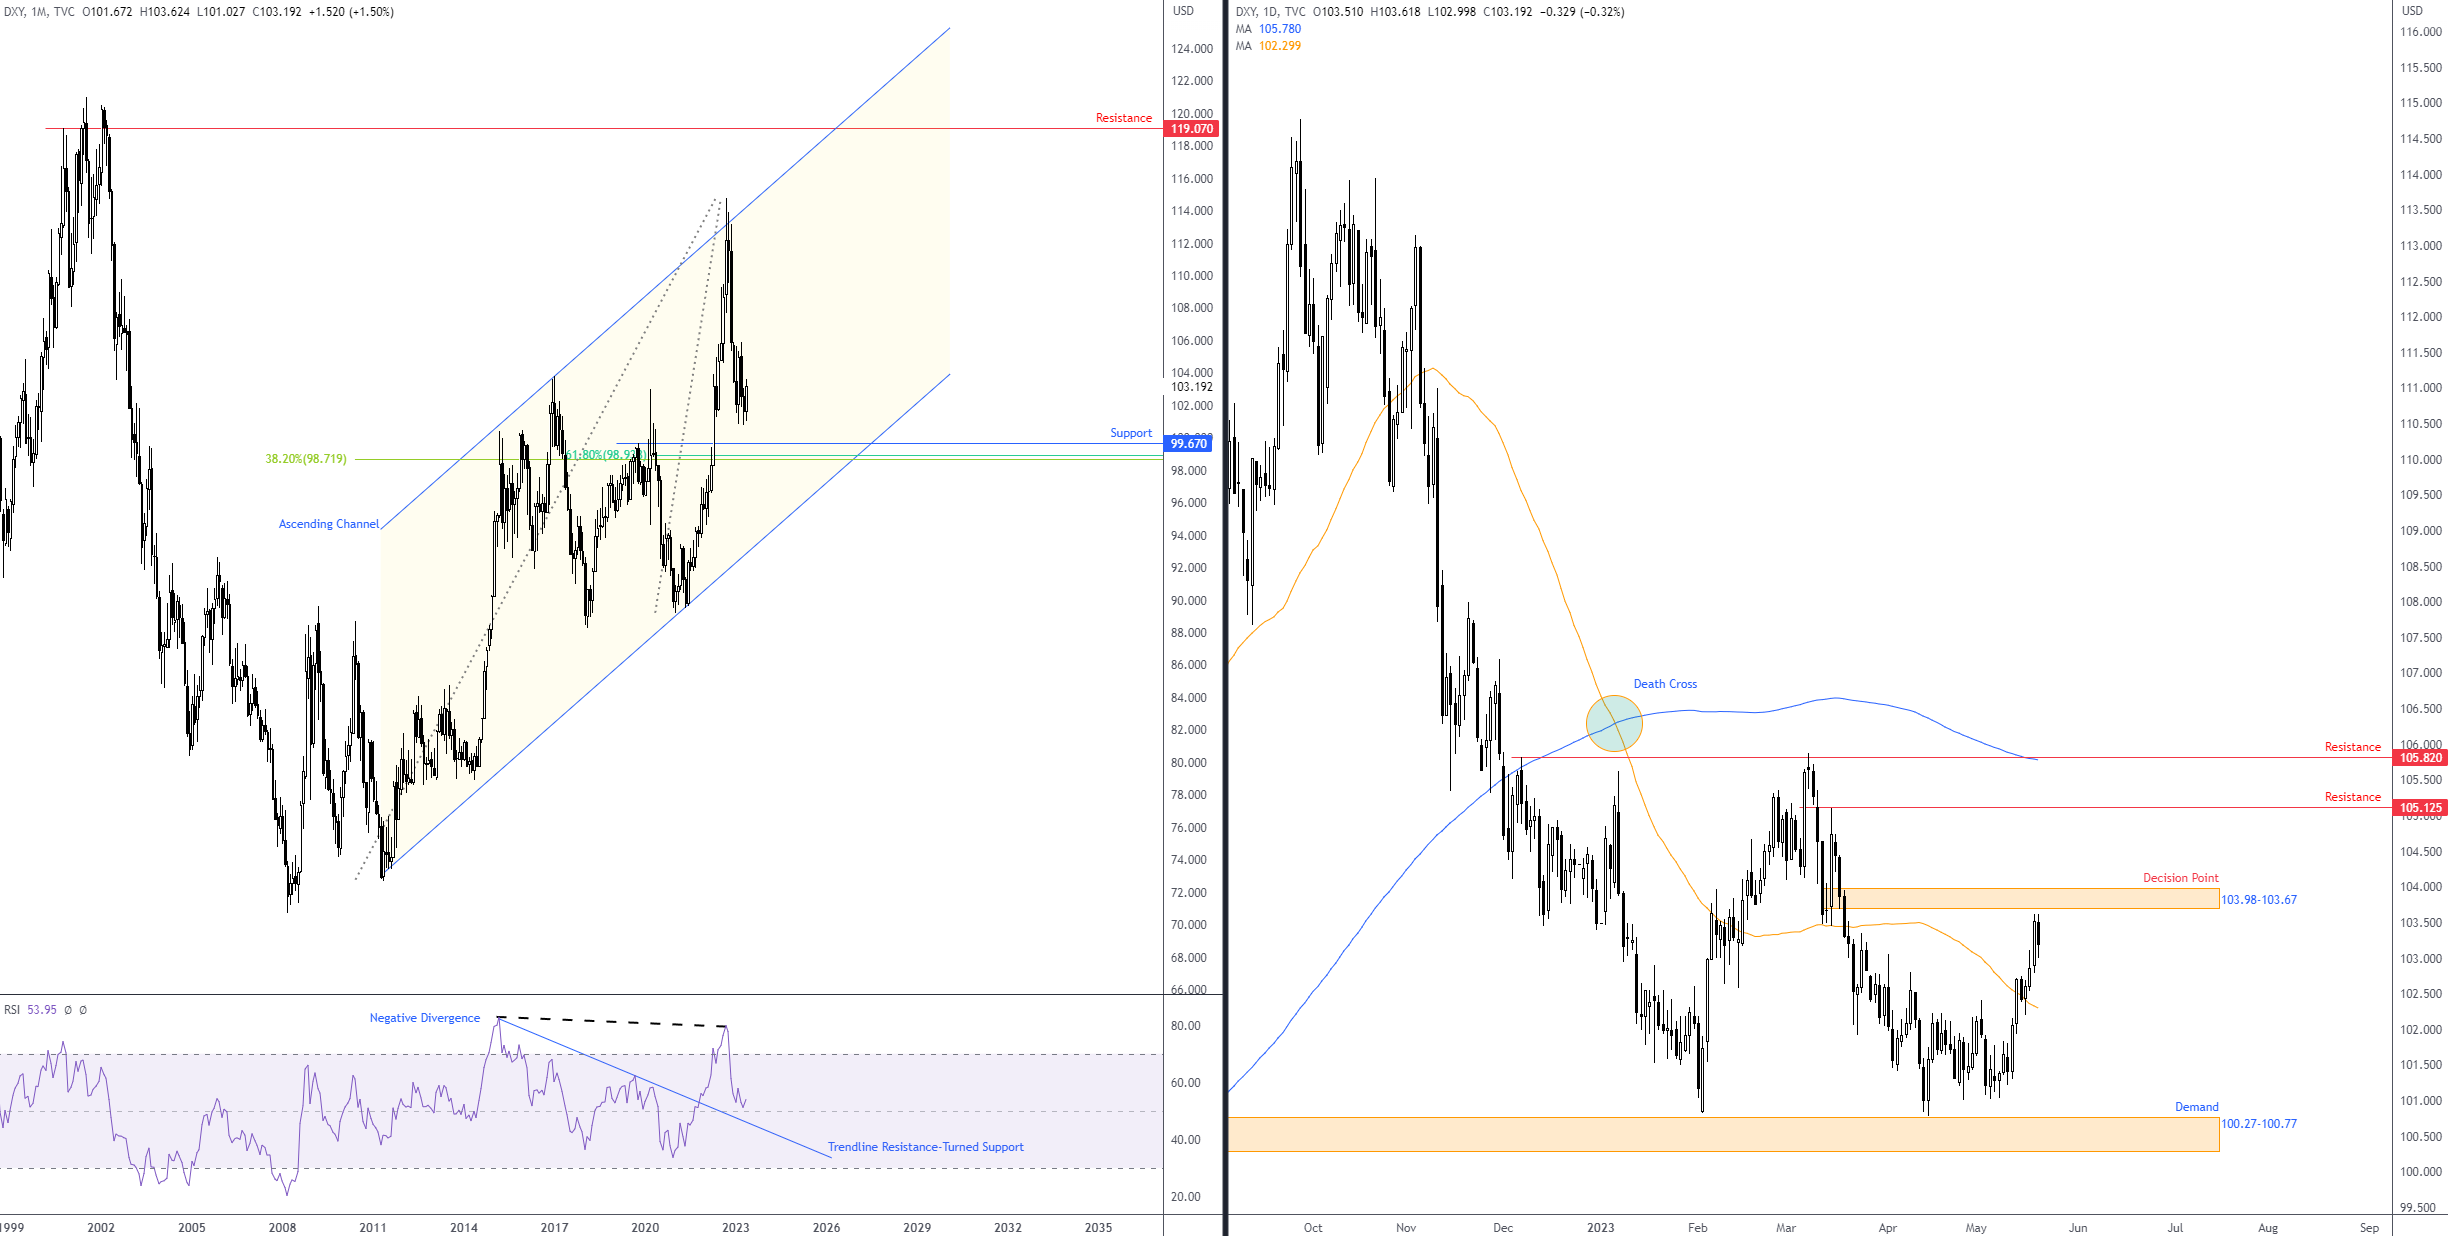
It was another positive week for the greenback. As per the US Dollar Index, the US dollar extended the prior week’s +1.4% surge, adding +0.5%.
As evident from the daily chart, price movement retested and held the upper side of the 50-day simple moving average at 102.30. Subsequent action saw last week climb to two-month highs a whisker south of a decision point at 103.98-103.67 before sellers put in an appearance on Friday (snapping a three-day bullish phase).
Is this the beginning of a trend reversal to the upside for the dollar?
The monthly timeframe, albeit displaying a long-term uptrend since early 2008, displays scope to navigate south until reaching support at 99.67. Note that beneath the support, we have two nearby Fibonacci retracement ratios around the 98.70ish neighbourhood. I also see room to bump lower on the Relative Strength Index (RSI) towards the 50.00 centreline, sharing space with a trendline resistance-turned-support taken from the high of 79.96.
On the other hand, the daily timeframe has established early signs of an uptrend: a higher low formed on 26 April and a subsequent higher high on 2 May. Not to mention, the price break north of the 50-day simple moving average mentioned above at 102.30. However, until a decisive move is seen above 103.98-103.67 and the two layers of additional resistance at 105.13 and 105.82 (as well as the 200-day simple moving average at 105.78), sellers may attempt to short rallies for the time being. As such, 103.98-103.67 will likely be monitored closely this week.
 USD/JPY: Reclaiming ¥138+ Status for Higher Levels?
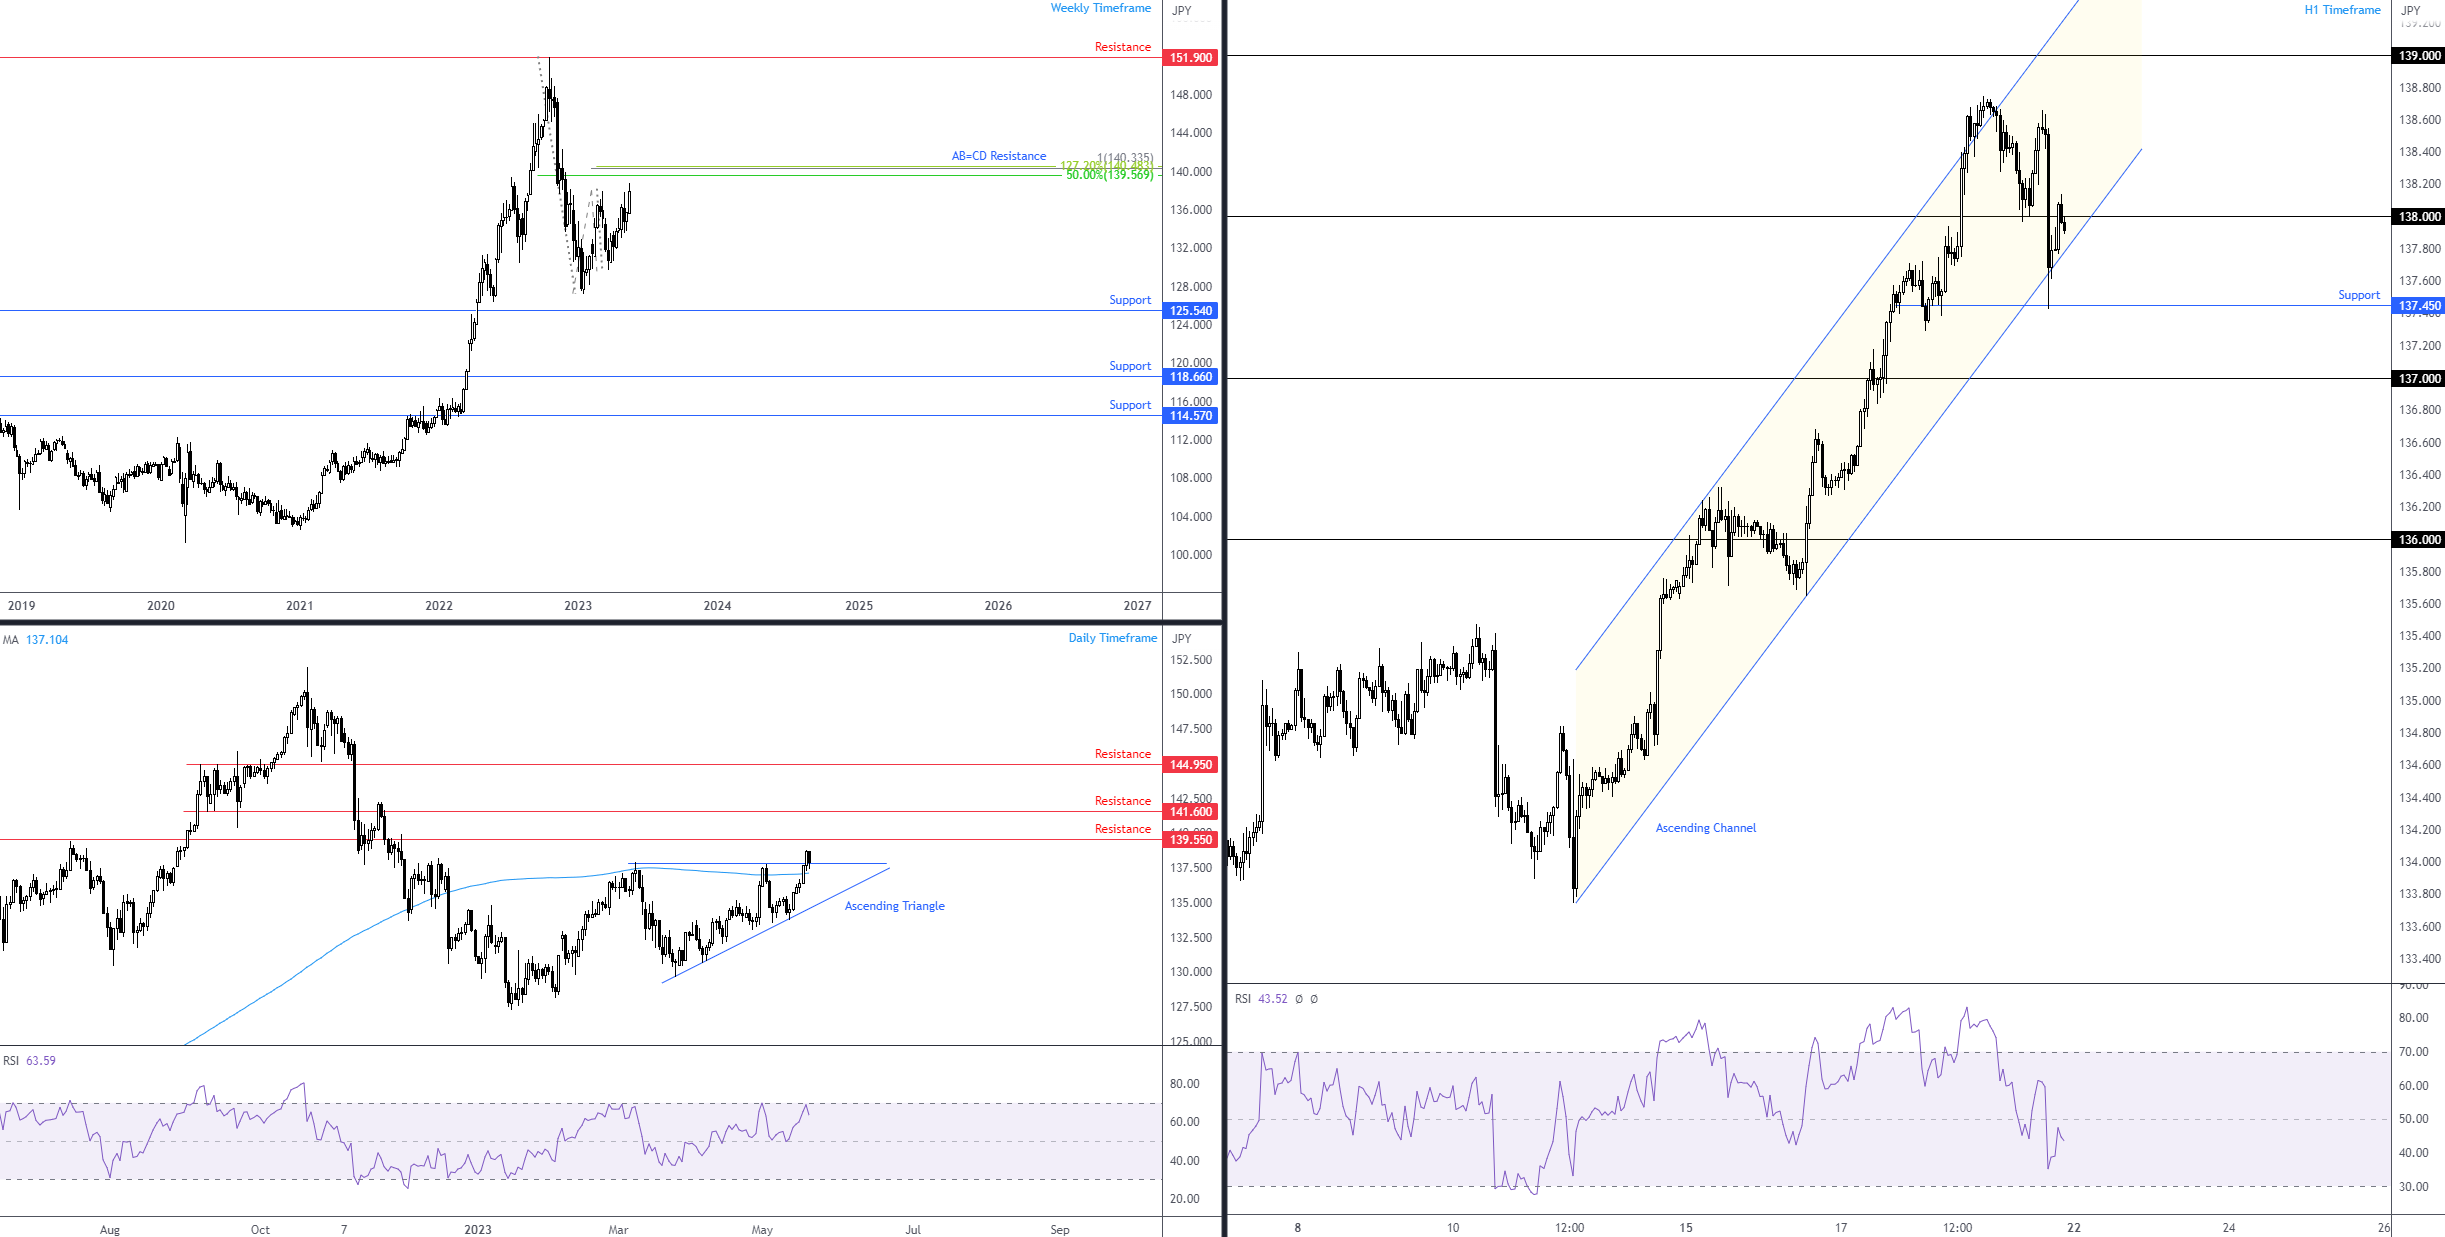
Last week witnessed a rise in the USD/JPY currency pair, adding +1.6% and extending the previous week’s +0.7% rally. This led to fresh YTD highs on Thursday, reaching ¥138.75, levels not seen since November 2022.
The recent bid also threw light on the weekly timeframe’s AB=CD bearish configuration at ¥140.34, denoted by way of a 100% projection, as well as a 1.272% Fibonacci extension at ¥140.48 and a 50.0% retracement ratio at ¥139.57. Given that the unit effectively probed beneath the ¥130.39 low (2 August), the AB=CD termination point could be somewhere longer-term sellers make a show from this week.
Against the backdrop of the weekly timeframe, the second half of the week observed the pair venture above its 200-day simple moving average at ¥137.10 and whipsaw above the upper boundary of an ascending triangle (drawn from ¥137.91 and ¥129.64). Assuming buyers remain in the driving seat, as suggested by the weekly timeframe (until around ¥140.30ish), daily resistance warrants attention at ¥139.55 this week, closely shadowed by resistance at ¥141.60.
Meanwhile, on the H1 timeframe, since 11 May, the unit has been working between the limits of an ascending channel drawn from ¥133.74 and ¥136.24. Despite the retest of ¥138 in early London Friday, which managed to eke out a respectable 60 or so pips to a high of ¥138.65, sellers took the wheel during US hours and plunged through ¥138 to greet channel support. Aided by support at ¥137.45, buyers discovered a floor at the channel support base and ended Friday nearby the underside of ¥138.
In light of the weekly timeframe likely to seek higher prices until ¥140.30, together with the daily timeframe breaking above its 200-day simple moving average and above an ascending triangle, reclaiming ¥138+ status this week and refreshing YTD highs (as well as targeting ¥139) could be on the menu this week.
 Commodities:
Gold (XAU/USD): Support at $1,949 on the Radar
The price of spot gold in $ terms concluded last week down -1.7%, following the precious metal topping a whisker south of the all-time high of $2,075 in early May (a move aided by negative divergence out of the Relative Strength Index [RSI]). Based on the weekly timeframe, I see limited support (the $1,949 region [circled] appears soft on this chart), meaning the yellow metal could experience further losses over the coming weeks, targeting support from $1,807. However, this does not mean the $1,949 area should be disregarded as potential support.
Across the page on the daily timeframe, recent weakness propelled price action through the lower boundary of a local channel support taken from the low $1,934, and the 50-day simple moving average, currently fluctuating around $1,987. Underpinned by dollar weakness on Friday, XAU/USD did manage to eke out a gain ahead of $1,949 and landed the unit at the underside of the 50-day simple moving average to end the week. You can see on the daily chart that $1,949 support, marked on both the weekly and daily timeframes, is bolstered by a longer-term ascending channel support drawn from the low $1,616. Therefore, there may still be weight behind $1,949.
Shorter term, following the rebound from support at $1,955, the precious metal ended Friday completing an ‘alternate’ AB=CD bearish configuration, denoted by the 1.618% Fibonacci projection at $1,984, which shares chart space with a nearby resistance level. The completion of this pattern is likely to see AB=CD shorts target the 38.2% and 61.8% Fibonacci retracement ratios at $1,971 and $1,964, respectively (derived from legs A-D). Further selling from here would then chalk up the possibility of targeting the higher timeframe support at $1,949.
Venturing higher this week, however, could have H1 resistance at $1,991 welcome price action, with subsequent buying shifting attention back to the widely watched $2,000 level.
 Equities:
Germany’s DAX Refreshes All-Time Highs
Daily Timeframe.
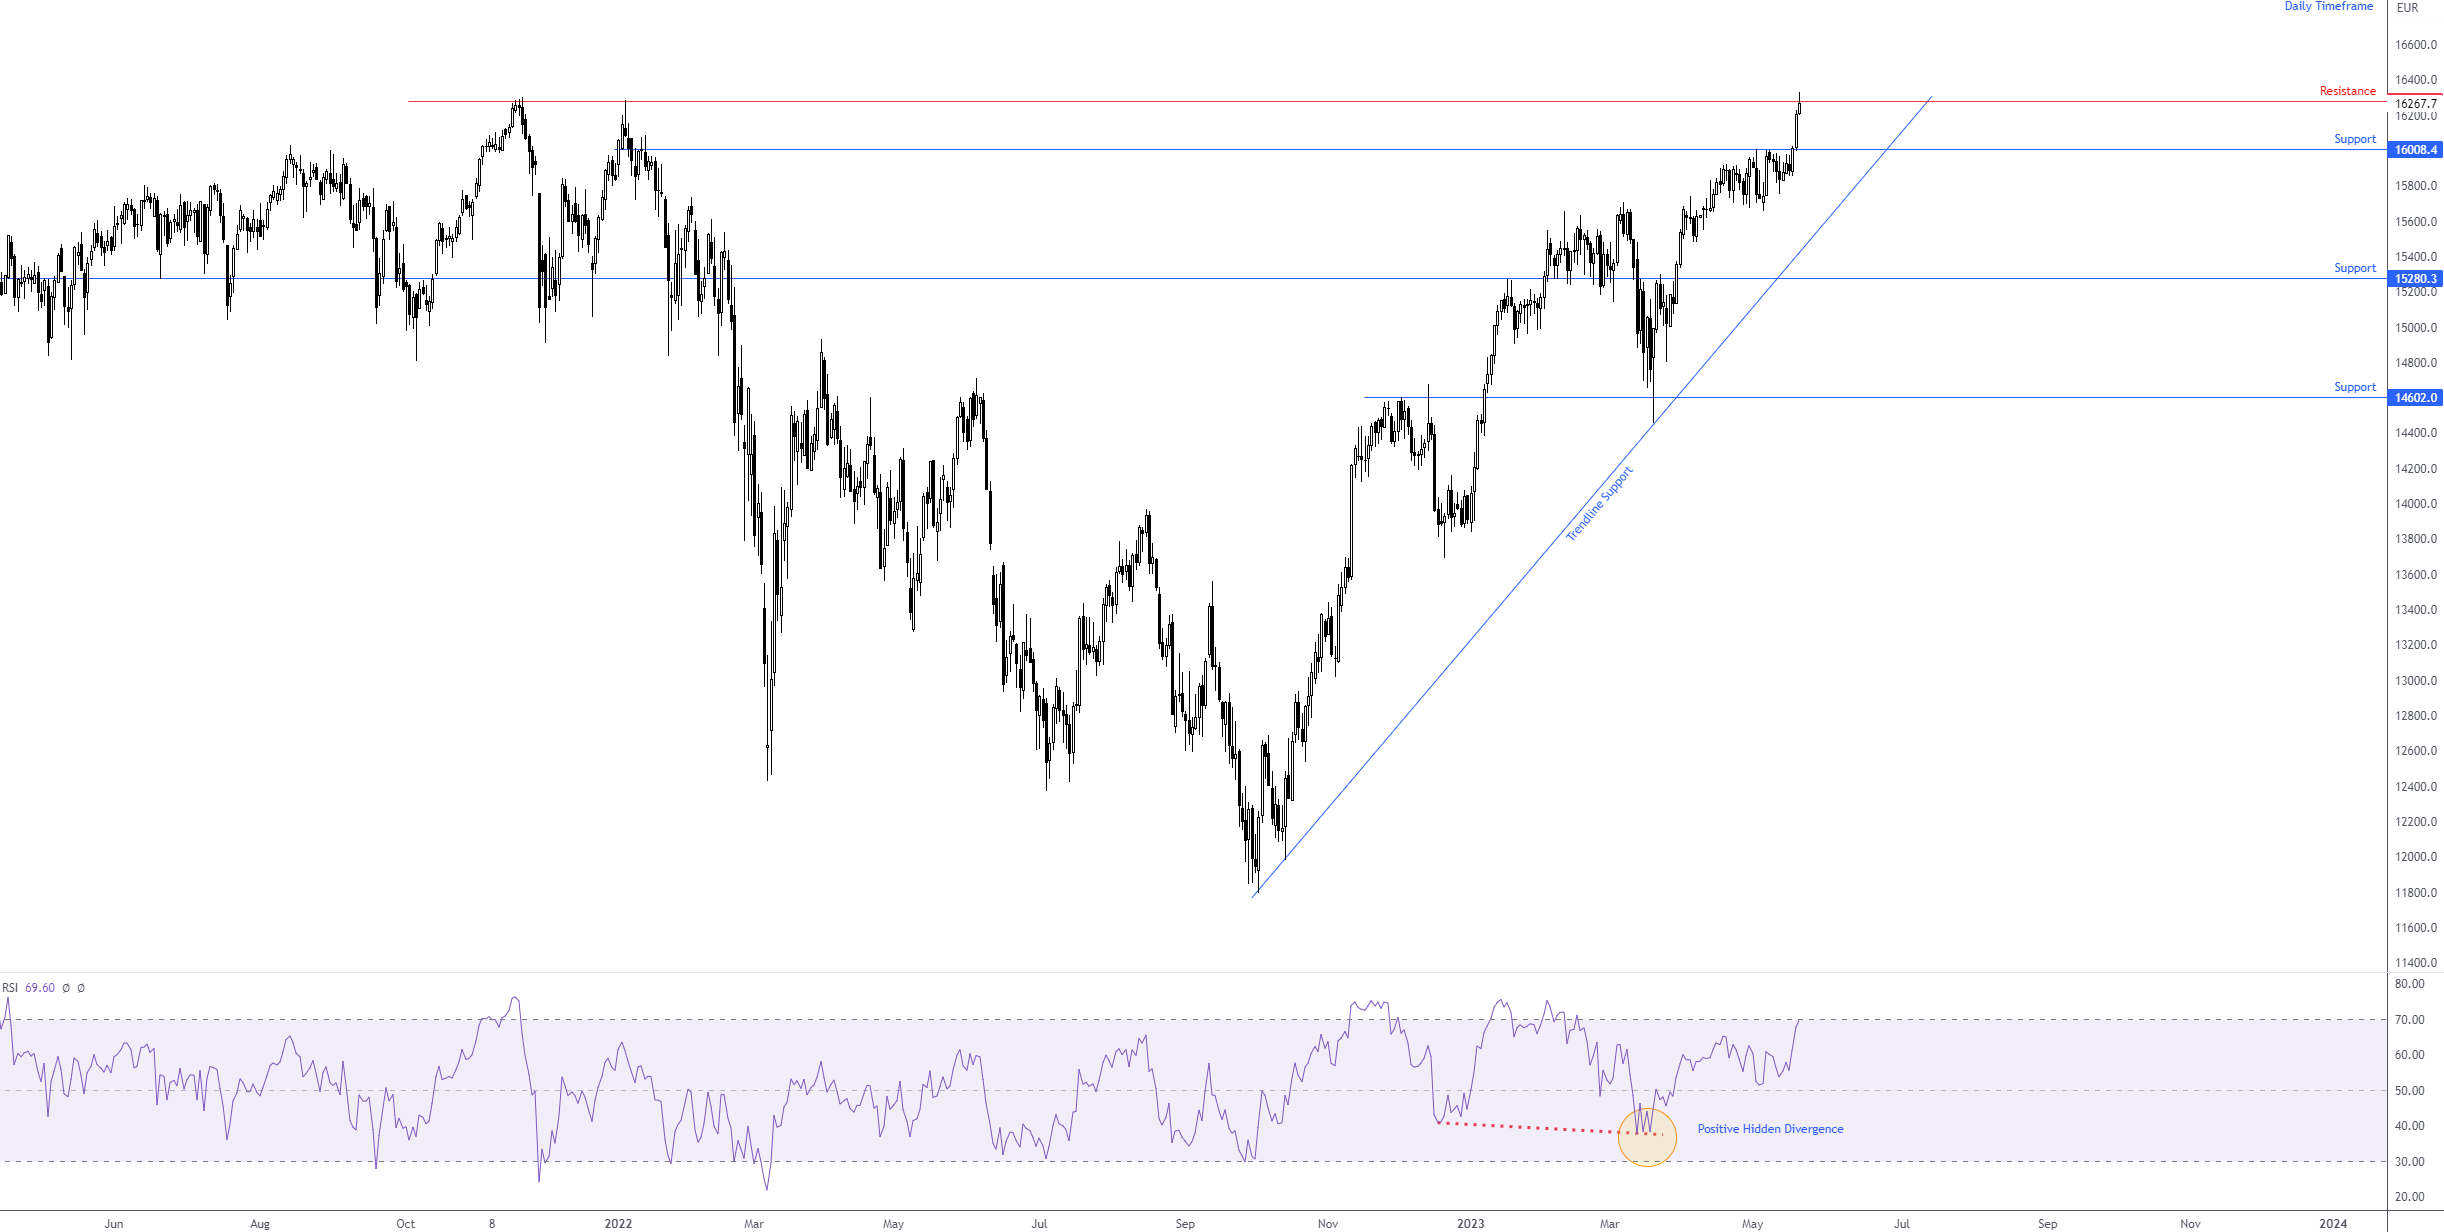
Since October 2022, Germany’s DAX40 has exhibited a clear uptrend, with Friday puncturing all-time highs of 16,300 to reach 16,332. As illustrated on the chart, resistance also made a show at 16,282—a former double-top pattern that took shape in late 2021—and despite the fresh ATH, a mild end-of-week correction unfolded from the level. This opens the door to a possible bearish scenario this week, pulling back to at least support from 16,008 and possibly to as far south as trendline support from the low of 11,796.
Alternatively, a daily close north of 16,282 will likely entice buyers, particularly if a retest of 16,282 materialises and support forms.
 EURO STOXX 50 on the Verge of Refreshing All-Time Highs
Daily Timeframe.
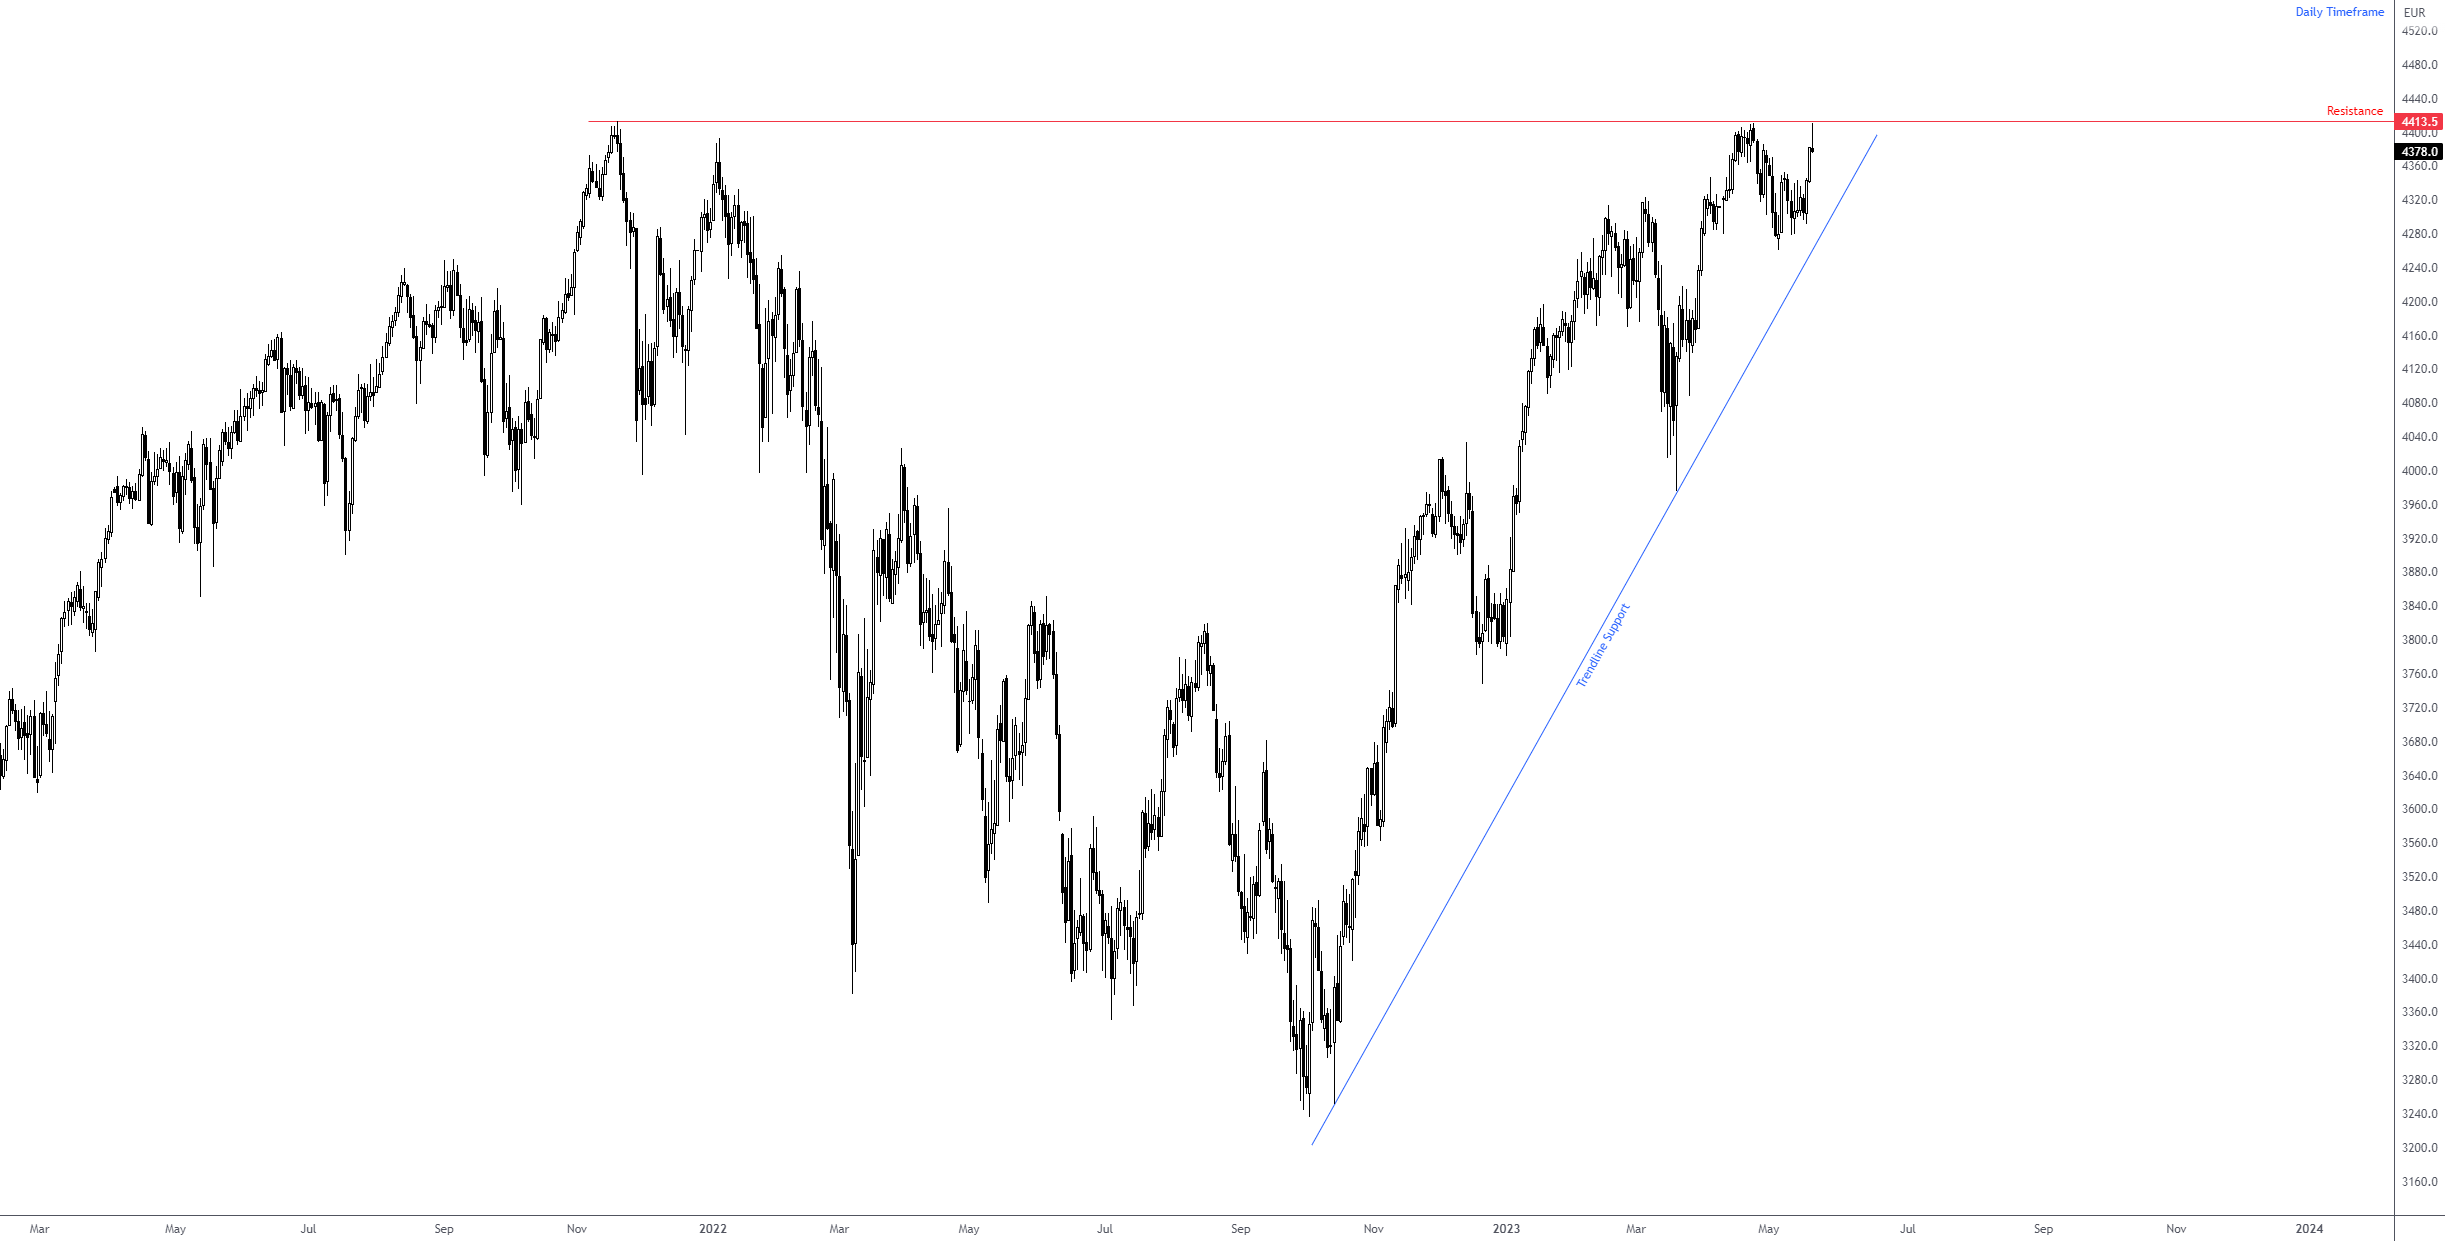
The EURO STOXX 50—tracks the performance of the 50 largest companies in Europe based on market capitalisation—came within striking distance of the all-time high of 4,413 and pulled lower on Friday. Like the DAX40, the EU50 has been trending higher since October 2022. Therefore, breaking all-time highs is likely on the table in the next week.
Should the index continue to pull back and target lower levels, trendline support taken from the low of 3,251 could enter the frame and see investors looking to buy into the dip.
 Cryptocurrencies:
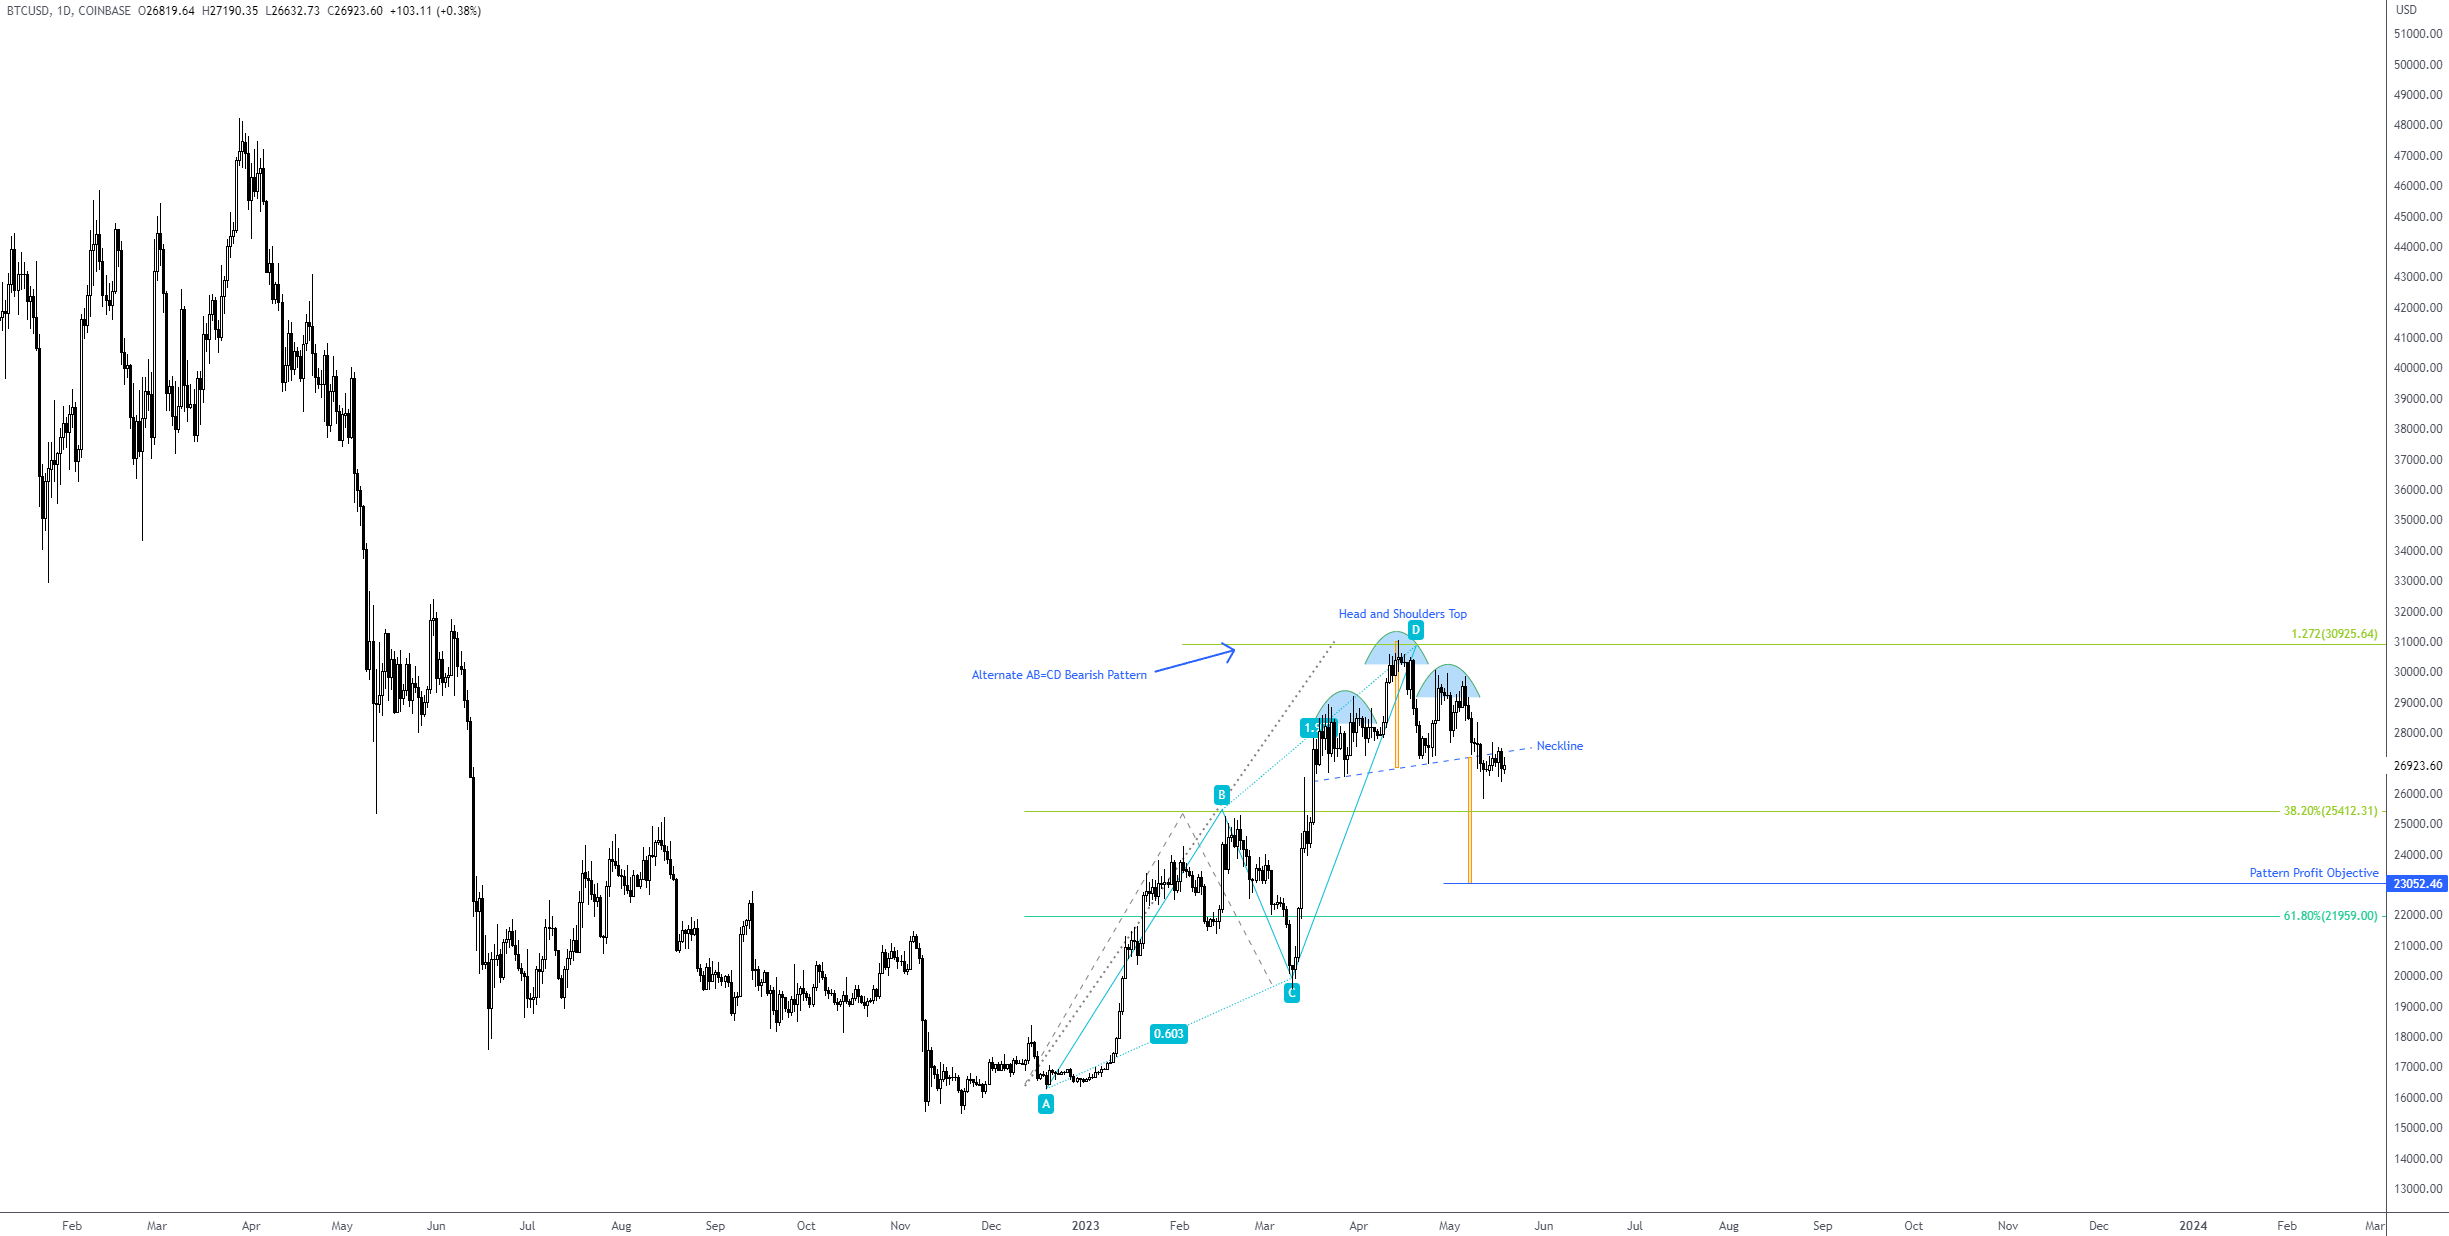
BTC/USD: Technical Confluence Suggests Further Downside for the Major Crypto
Daily Timeframe.
Price action on the daily timeframe of BTC/USD has, since 19 March, been busy carving out a head and shoulder top pattern, formed at $29,190 (left shoulder), $31,050 (head) and $30,050 (right shoulder). The major crypto recently closed beneath the pattern’s neckline, extended from the low of $26,525, and price is now retesting the lower side of the neckline.
We have since seen some moderate resistance emerge from the underside of the aforementioned neckline, meaning follow-through downside could be something we see unfold this week in the direction of the pattern’s profit objective as far south as $23,052. However, you will also acknowledge that the head of the pattern formed at a 1.272% Fibonacci projection at $30,925 (which for many harmonic traders will represent an ‘alternate’ AB=CD bearish pattern), and thus may see harmonic traders target the 38.2% and 61.8% Fibonacci retracement ratios at $25,412 and $21,959, respectively (formed from legs A-D of the AB=CD formation).
 XRP/USD: Channel Resistance Breakout Could Trigger Follow-Through Buying
Daily Timeframe.
Following a rebound from support at $0.42283, a level accompanied by a 1.272% Fibonacci projection at $0.41596 (‘alternate’ AB=CD bullish formation), the price of XRP/USD tested the lower boundary of channel resistance extended from the high $0.58479. A breakout north of here could see follow-through buying occur, in line with the current uptrend (active since bottoming at the beginning of this year at $0.30098) and the Relative Strength Index (RSI) reclaiming territory north of the 50.00 centreline (positive momentum).
Conservative traders will also likely want to see nearby resistance at $0.48589 engulfed before committing to the upside, targeting resistance at $0.53561 and potentially exceeding 29 March high at $0.58479.
 Charts: TradingView
DISCLAIMER:
The information contained in this material is intended for general advice only. It does not take into account your investment objectives, financial situation or particular needs. FP Markets has made every effort to ensure the accuracy of the information as at the date of publication. FP Markets does not give any warranty or representation as to the material. Examples included in this material are for illustrative purposes only. To the extent permitted by law, FP Markets and its employees shall not be liable for any loss or damage arising in any way (including by way of negligence) from or in connection with any information provided in or omitted from this material. Features of the FP Markets products including applicable fees and charges are outlined in the Product Disclosure Statements available from FP Markets website, www.fpmarkets.com and should be considered before deciding to deal in those products. Derivatives can be risky; losses can exceed your initial payment. FP Markets recommends that you seek independent advice. First Prudential Markets Pty Ltd trading as FP Markets ABN 16 112 600 281, Australian Financial Services License Number 286354.


 Access +10,000 financial
instruments
Access +10,000 financial
instruments