
Charts: Trading View
(Italics: Previous Analysis)
EUR/USD:
Traders were greeted with further euro softness on Monday against a broadly stronger US dollar. EUR/USD touched levels not seen since May 2020—note EUR/CHF also dipped under parity (1.0000) for the first time since 2015.
Technically speaking, underperformance in EUR/USD is not a surprise. Recent research acknowledged the following about the weekly timeframe’s technical position:
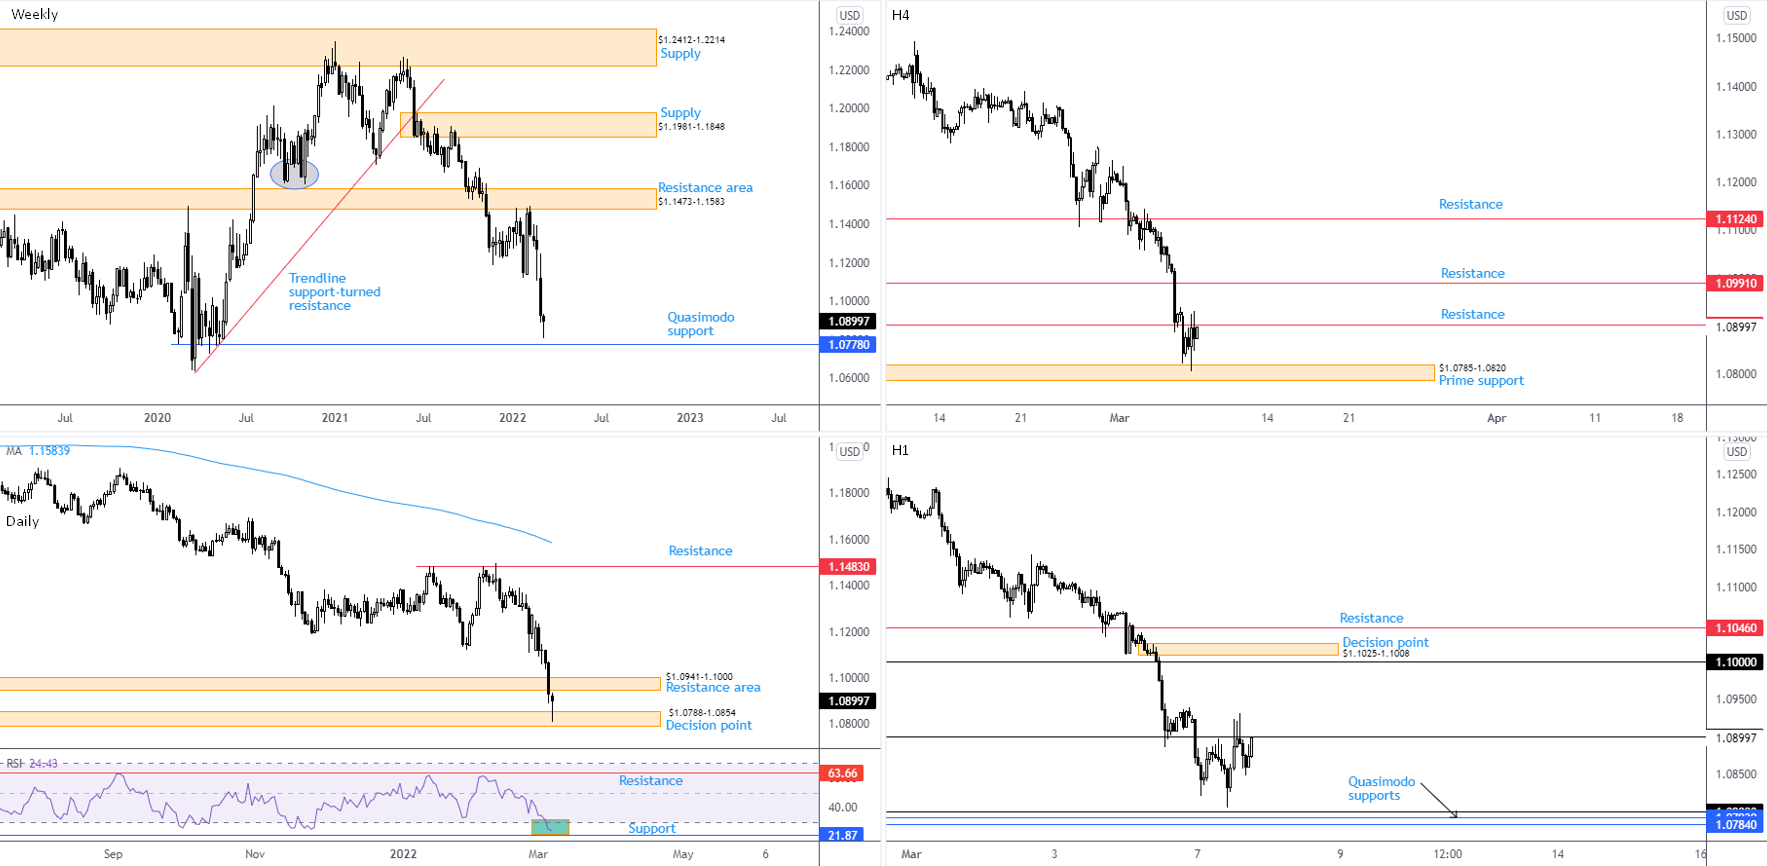
According to trend, a downside bias has been in play since topping at $1.2350 at the beginning of January (2021) on the weekly timeframe. This is reinforced by a weekly trendline support breach, drawn from the low $1.0636, together with the break of the $1.1602 November 2020 low (circled) and the retest of weekly resistance at $1.1473-1.1583. Continued interest to the downside brings attention to as far south as Quasimodo support at $1.0778—area not seen since pandemic lows of March 2020.
In terms of the daily timeframe’s landscape, Monday shook hands with a decision point at $1.0788-1.0854 (extended from May 2020). This followed Friday overthrowing support at $1.0941-1.1000, an area now stationed as possible resistance. Momentum studies, according to the relative strength index (RSI), reveals oversold conditions ahead of indicator support at 21.87. However, it should be pointed out that the RSI can remain within oversold for prolonged periods amid a downtrend.
Interestingly, weekly Quasimodo support at $1.0778 is located directly south of the daily decision point at $1.0788-1.0854.
Across the page, buyers and sellers are squaring off between H4 resistance at $1.0903 and H4 prime support at $1.0785-1.0820 (glued to the lower side of the daily decision point at $1.0788-1.0854). Upstream, resistance is not expected until $1.0991. Attention on the H1 timeframe is centred on $1.09 and $1.08. Of particular note are two Quasimodo support levels at $1.0784 and $1.0793, sited a handful of pips beneath $1.08. Above $1.09, technicians will note $1.10 merges closely with H4 resistance highlighted above at $1.0991.
Technical Outlook:
Weekly Quasimodo support at $1.0778, together with H1 Quasimodo supports between $1.0784 and $1.0793 as well as H4 prime support from $1.0785-1.0820, delivers an area of support deserving of the watchlist. Furthermore, noted supports are positioned under $1.08 on the H1. It’s common to witness price whipsaw psychological levels and rebound from support showing healthy confluence.
With the above in mind, this may also fuel further resistance from $1.09.
AUD/USD:
Monday observed the Australian dollar reverse earlier upside against the US dollar, in conjunction with a pullback witnessed in the commodity space. Unsurprisingly, geopolitics remain the main driver of market movement.
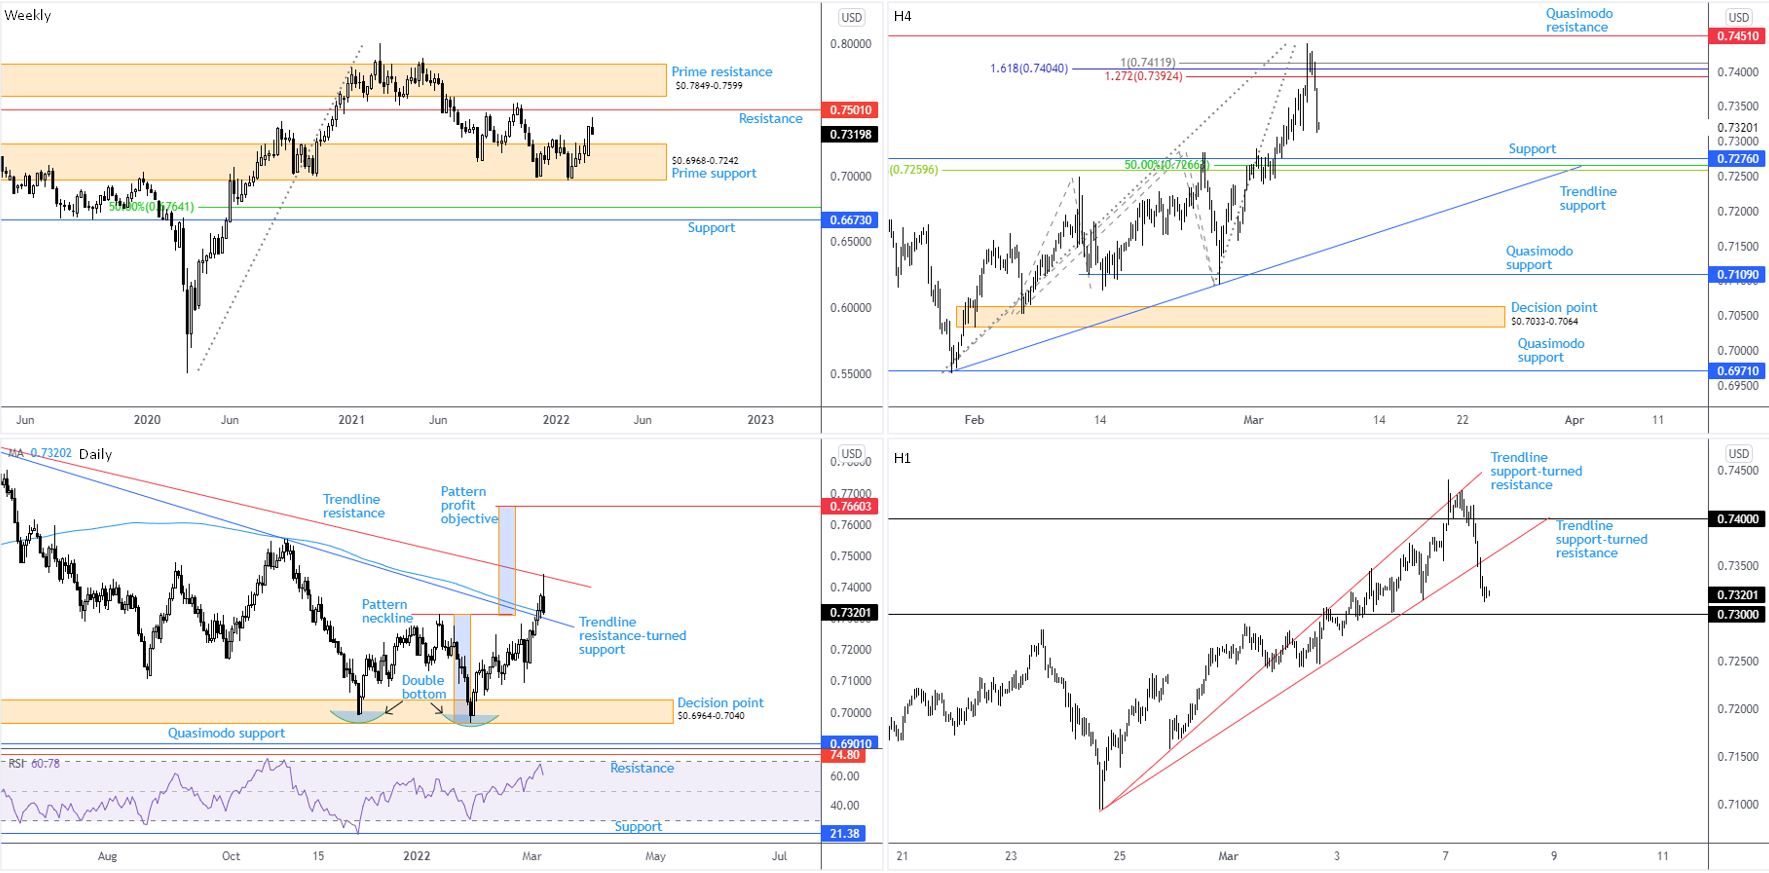
The weekly timeframe’s prime support area at $0.6968-0.7242 recently watched buyers gain power, though despite recording a fifth consecutive week in the green, bulls have yet to crosswords with weekly resistance at $0.7501.
With respect to trend, the outlook remains largely unchanged:
Longer term—the monthly timeframe—has portrayed a downtrend since August 2011, suggesting the 12.6 percent correction from mid-Feb tops at $0.8007 (2021) on the weekly timeframe might be the start of a bearish phase and not a dip-buying correction from the 2021 advance from pandemic lows of $0.5506. This (despite recent upside) places a question mark on weekly prime support. If a break lower should come to pass, weekly support at $0.6673 and a 50% retracement at $0.6764 are observable.
Meanwhile out of the daily timeframe, movement faded trendline resistance on Monday, drawn from the high $0.8007. Snapping a three-day bullish phase, the currency pair reconnected with the 200-day simple moving average at $0.7320 (positioned just above trendline resistance-turned support, drawn from the high $0.7891). An additional technical observation is the double-bottom pattern ($0.6991). You will note price has dethroned the pattern’s neckline ($0.7314), with the pattern shining light on a profit objective coming in at $0.7660.
Based on the H4 timeframe, we saw price respond to a Fibonacci cluster between $0.7412 and $0.7392 on Monday, an area sheltered under Quasimodo resistance at $0.7451. H4 support calls for attention at $0.7276, joined closely by a 50% retracement at $0.7266 and a 38.2% Fibonacci retracement at $0.7260.
Alongside H4 Fibonacci resistance, the H1 timeframe’s trendline support-turned resistance (etched from the low $0.7095) entered the fight on Monday. As you can see, a clear ‘bull trap’ formed above neighbouring $0.74 psychological resistance. Moving forward, another trendline support (also taken from the $0.7095 low) was engulfed and has perhaps set the stage to drop in on $0.73.
Technical Outlook:
The combination of daily trendline support-turned resistance (around $0.7310) and the 200-day simple moving average at $0.7320, along with $0.73 on the H1 and H4 support between $0.7260 and $0.7276, traders will likely be watching $0.7260-0.7320 as a support base.
USD/JPY:
USD/JPY bulls took the wheel on Monday, underpinned amid higher US Treasury yields and robust demand for commodities.
Chart studies concerning higher timeframes remain unchanged from last week’s analysis. Nevertheless, the following text from weekly and daily timeframes may help serve as a reminder of where we currently stand:
The trend in this market favours buyers at the moment. The currency pair has been stepping higher since early 2021, clearly visible on the weekly timeframe. In line with this, the overall longer-term trend has been climbing since 2012 (check monthly timeframe). The 21.5 percent correction from June 2015 to June 2016 provided a dip-buying opportunity, as did a subsequent 14.8 percent correction from December 2016 to pandemic lows formed early March 2020. The weekly timeframe’s 1.272% Fibonacci projection, as you can see, has remained a headwind since the beginning of this year. Should sellers strengthen their grip, weekly channel support, extended from the low ¥102.59, could be an area we see enter the frame.
The daily chart has been in the process of chalking up an ascending triangle pattern (typically considered a continuation arrangement) since December 2021 between Quasimodo resistance at ¥116.33 and an ascending line drawn from the low ¥112.53. Toppling ¥116.33 would allow analysts to chart a pattern profit objective by extending the ‘base’ distance (blue vertical box) from the breakout point. Withdrawing under the ascending line would seat supply-turned demand from ¥112.66-112.07 in the picture. Not only is the area in the company of a 78.6% Fibonacci retracement at ¥112.00 and a 50% retracement from ¥112.55, technicians will acknowledge the widely watched 200-day simple moving average housed within the zone at ¥112.42. Note that the relative strength index (RSI) is also rebounding from support between 40.00 and 50.00 (a ‘temporary’ oversold range since 10th May—common view in trending markets).
From the H4 timeframe, the unit is entrenched within a range between ¥114.72 and ¥115.78. Points of interest outside of this consolidation are the 61.8% Fibonacci retracement at ¥114.57 (green horizontal line) and the daily timeframe’s Quasimodo resistance at ¥116.33. An additional note, of course, is the decision point from ¥113.54-113.78, joined closely with a possible AB=CD bullish pattern at ¥113.84.
Technical movement according to the H1 timeframe shows the rebound from the decision point at ¥114.57-114.74 on Friday propelled short-term action north of ¥115 on Monday to clock a high of ¥115.47. This casts light on two Quasimodo resistances at ¥115.75 and ¥115.69.
Technical Outlook:
H4 range resistance at ¥115.78 will likely be on the watchlists of many traders this week, a barrier benefitting from two neighbouring Quasimodo resistances on the H1 at ¥115.75 and ¥115.69.
¥115 is also likely to be watched support, though unfortunately accommodates limited technical confluence on the H1 chart.

GBP/USD:
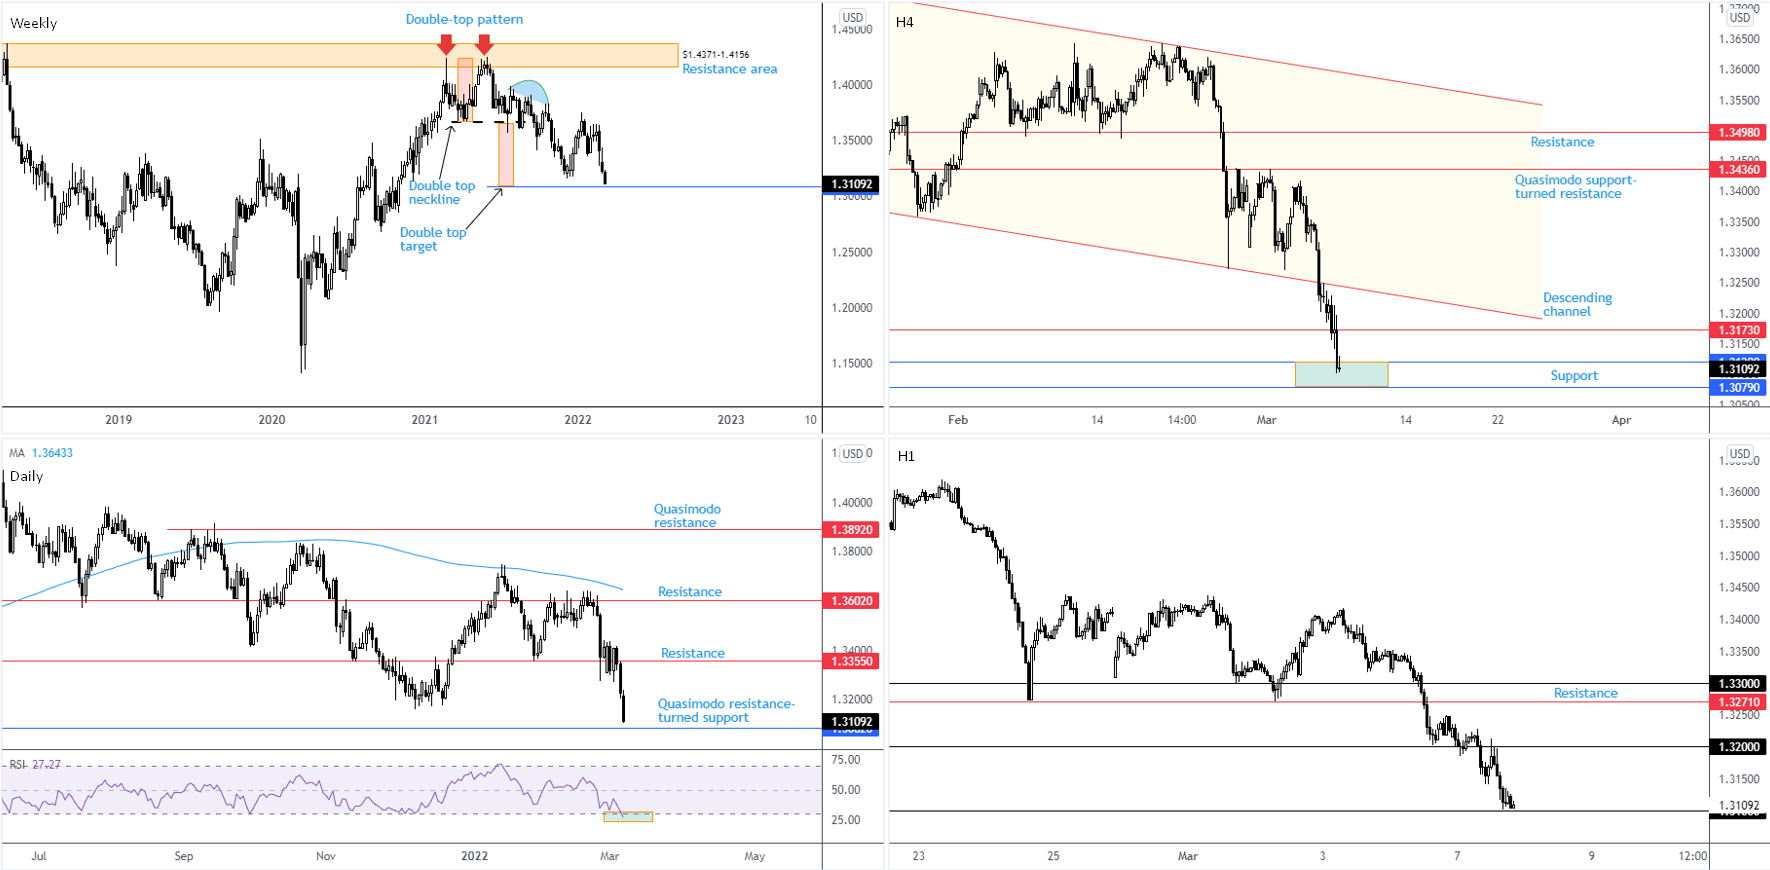
Demand for the safe-haven dollar on Monday led GBP/USD to levels not seen since November 2020. Sellers remaining on the ropes has price action on the doorstep of the weekly timeframe’s double-top [$1.4241] profit objective at $1.3090. The daily timeframe, shaped by way of three back-to-back near-full-bodied bearish candles, is also within reach of a Quasimodo resistance-turned support at $1.3082.
The daily timeframe’s relative strength index (RSI) has also entered oversold conditions. In terms of trend, recent research noted the following:
Longer-term trend direction has been southbound since late 2007 tops at $2.1161. As a result, the move from pandemic lows in March 2020 could be viewed as a pullback within the larger downtrend. This, of course, places a question mark on the 8 percent ‘correction’ from February 2021 to December 2021; it may in fact be the beginning of a longer-term push to the downside and not a dip-buying scenario.
Following Friday’s retest of channel support-turned resistance, drawn from the low $1.3358, Monday subsequently dropped through $1.3173 (now resistance) to test support between $1.3079 and $1.3120. As for the H1 timeframe, the unit trades within touching distance of $1.31 after an earlier rejection from the underside of $1.32.
Technical Outlook:
The weekly timeframe’s double-top profit objective at $1.3090 sharing space with daily Quasimodo resistance-turned support at $1.3082, in addition to H4 support at $1.3079-1.3120 and $1.31 on the H1, is considered a (technically) strong support.
Consequently, from a technical perspective, sellers have their work cut out for them if they intend on absorbing the aforementioned support levels.
DISCLAIMER:
The information contained in this material is intended for general advice only. It does not take into account your investment objectives, financial situation or particular needs. FP Markets has made every effort to ensure the accuracy of the information as at the date of publication. FP Markets does not give any warranty or representation as to the material. Examples included in this material are for illustrative purposes only. To the extent permitted by law, FP Markets and its employees shall not be liable for any loss or damage arising in any way (including by way of negligence) from or in connection with any information provided in or omitted from this material. Features of the FP Markets products including applicable fees and charges are outlined in the Product Disclosure Statements available from FP Markets website, www.fpmarkets.com and should be considered before deciding to deal in those products. Derivatives can be risky; losses can exceed your initial payment. FP Markets recommends that you seek independent advice. First Prudential Markets Pty Ltd trading as FP Markets ABN 16 112 600 281, Australian Financial Services License Number 286354.


 Access +10,000 financial
instruments
Access +10,000 financial
instruments