
Charts: Trading View
(Italics: Previous Analysis)
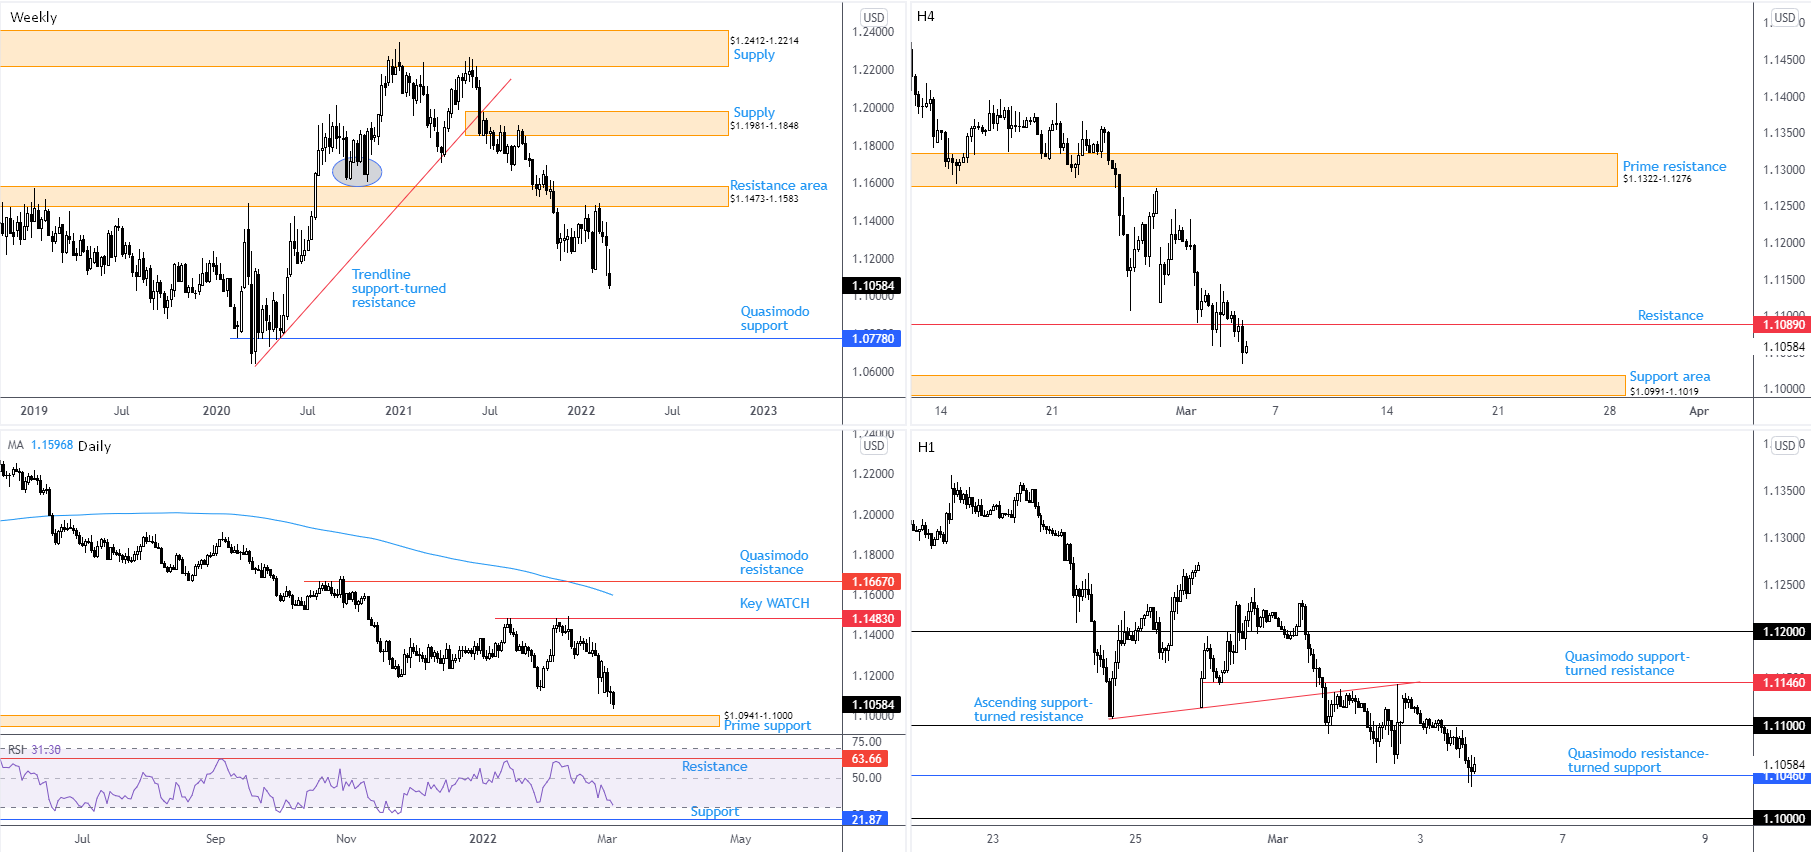
EUR/USD:
The US Dollar Index (USDX) continued to flex its financial muscle on Thursday, refreshing YTD pinnacles at 97.95 and pressuring EUR/USD to its lowest space since the end of May 2020. Recognising the USDX is fast approaching weekly trendline resistance and the daily timeframe’s relative strength index (RSI) is on the doorstep of oversold territory, the nearby daily timeframe’s prime support at $1.0941-1.1000 may welcome a ‘relief rally’.
However, while technical evidence places daily prime support in a reasonably positive light, we must remain aware of what the weekly timeframe is telling us:
According to trend, a downside bias has been in play since topping at $1.2350 at the beginning of January (2021) on the weekly timeframe. This is reinforced by a weekly trendline support breach, drawn from the low $1.0636, together with the break of the $1.1602 November 2020 low (circled) and the retest of weekly resistance at $1.1473-1.1583. Continued interest to the downside brings attention to as far south as Quasimodo support at $1.0778—area not seen since pandemic lows of March 2020.
Therefore, although a $1.0941-1.1000 recovery could form, it might be short-lived.
In terms of where we stand on the H4 timeframe, the currency pair tunnelled through $1.1089 support on Thursday which sponsors a potential move to support from $1.0991-1.1019. Latest developments out of the H1 timeframe has price crossing swords with Quasimodo resistance-turned support at $1.1046, drawn from 30th March 2020. Technically, $1.1046 appears to be the last line of defence. Absorbing the latter directs headlights towards the widely watched $1.10 psychological figure, a base residing within H4 support at $1.0991-1.1019 and also serving as the upper boundary of daily prime support from $1.0941-1.1000.
Technical Outlook:
The combination of daily prime support at $1.0941-1.1000, H4 support at $1.0991-1.1019 and $1.10 on the H1 timeframe delivers a possible ‘floor’ to be aware of. Nevertheless, while buyers could welcome the said supports, traders are urged to remain cognisant of the weekly timeframe’s position: scope to press lower until $1.0778.
AUD/USD:
AUD/USD bulls remained on the offensive for a second consecutive session on Thursday, a welcomed sight out of the weekly timeframe’s prime support area at $0.6968-0.7242 which has failed to ignite much bullish interest since late 2021. On track to record a fifth successive week in the green, a continuation higher shines light on weekly resistance priced at $0.7501.
With respect to trend, the outlook remains largely unchanged:
Longer term—the monthly timeframe—has portrayed a downtrend since August 2011, suggesting the 12.6 percent correction from mid-Feb tops at $0.8007 (2021) on the weekly timeframe might be the start of a bearish phase and not a dip-buying correction from the 2021 advance from pandemic lows of $0.5506. This (despite recent upside) places a question mark on weekly prime support. If a break lower should come to pass, weekly support at $0.6673 and a 50% retracement at $0.6764 are visible.
Based on the daily timeframe’s technical picture, price engulfed trendline resistance on Thursday, drawn from the high $0.7891. Yet, before breakout buyers commit, they’re likely to seek a daily close above the neighbouring 200-day simple moving average, circling $0.7324. Trendline resistance, drawn from the high $0.8007, therefore, would call for attention.
A decision point drawn from November 2021 at $0.7368-0.7343 entered the fight in recent hours, following an earlier retest of support at $0.7276. This is an area located just above the 200-day simple moving average. Upstream, resistance is seen at $0.7383.
Lower on the charts, we have the H1 timeframe establishing resistance around the $0.7345 region, made up of 1.272% Fibonacci projection levels between $0.7346 and $0.7338. You will note trendline support-turned resistance also joins the said resistance zone, taken from the low $0.7095. Additionally, a possible wedge formation is seen between $0.7095 and $0.7237.
Technical Outlook:
Although H1 resistance at $0.7346-$0.7338 is holding back buyers for now, which happens to be working with a H4 decision point at $0.7368-0.7343, short-term sellers are unlikely to participate unless H1 closes under $0.73. This is largely due to the weekly timeframe making headway from prime support at $0.6968-0.7242, and the daily timeframe poised to close above trendline resistance, etched from the high $0.7891.

USD/JPY:
European and US equities dropped on Thursday, consequently inspiring a safe-haven USD bid. Despite this, USD/JPY ended the session marginally lower, unable to muster sufficient strength to dethrone H1 Quasimodo resistance at ¥115.75. The break of the ¥115.44 session lower could exacerbate short-term downside as we head into Friday’s session, targeting the ¥115 neighbourhood.
From the H4 timeframe, trendline support-turned resistance, drawn from the low ¥113.47, and daily Quasimodo resistance at ¥116.33, remains a key area. To the downside, the 61.8% Fibonacci retracement at ¥114.57 echoes notable support.
In terms of higher timeframes, the technical position is unchanged:
The trend in this market favours buyers at the moment. The currency pair has been stepping higher since early 2021, clearly visible on the weekly timeframe. In line with this, the overall longer-term trend has been climbing since 2012 (check monthly timeframe). The 21.5 percent correction from June 2015 to June 2016 provided a dip-buying opportunity, as did a subsequent 14.8 percent correction from December 2016 to pandemic lows formed early March 2020. The weekly timeframe’s 1.272% Fibonacci projection, as you can see, has remained a headwind since the beginning of this year. Should sellers strengthen their grip, weekly channel support, extended from the low ¥102.59, could be an area we see enter the frame.
The daily chart has been in the process of chalking up an ascending triangle pattern (typically considered a continuation arrangement) since December 2021 between Quasimodo resistance at ¥116.33 and an ascending line drawn from the low ¥112.53. Toppling ¥116.33 would allow analysts to chart a pattern profit objective by extending the ‘base’ distance (blue vertical box) from the breakout point. Withdrawing under the ascending line would seat supply-turned demand from ¥112.66-112.07 in the picture. Not only is the area in the company of a 78.6% Fibonacci retracement at ¥112.00 and a 50% retracement from ¥112.55, technicians will acknowledge the widely watched 200-day simple moving average housed within the lower limit of the zone at ¥112.36. Note that the relative strength index (RSI) is also rebounding from support between 40.00 and 50.00 (a ‘temporary’ oversold range since 10th May—common view in trending markets).
Technical Outlook:
Short term chart studies suggest further downside, taking aim at the ¥115 region (H1).
Longer term, however, resistance between ¥116.33 (daily Quasimodo resistance) and ¥116.09 (Weekly Fibonacci resistance) is noteworthy on the higher timeframes, sharing chart space with H4 trendline support-turned resistance, drawn from the low ¥113.47, and the ¥116 figure on the H1.

GBP/USD:
Boosted on the back of safe-haven demand, the US dollar rallied on Thursday and crippled upside efforts in GBP/USD. Overall, though, we have seen limited change in this market since the currency pair made contact with support at $1.3355 on the daily timeframe. Territory beneath current support has daily Quasimodo support at $1.3119 to target (set nearby the weekly timeframe’s double-top [$1.4241] profit objective at $1.3090), yet should buyers regain consciousness we may retest resistance at $1.3602—sited just under the 200-day simple moving average at $1.3654.
Regarding trend, we remain unchanged in our outlook (italics):
Longer-term trend direction has been southbound since late 2007 tops at $2.1161. As a result, the move from pandemic lows in March 2020 could be viewed as a pullback within the larger downtrend. This, of course, places a question mark on the 7.5 percent ‘correction’ from February 2021 to December 2021; it may in fact be the beginning of a longer-term push to the downside and not a dip-buying scenario.
Regarding the H4 timeframe, attention remains fixed on an AB=CD formation at $1.3263 and a Quasimodo support-turned resistance at $1.3436. As for the H1 timeframe, early London witnessed price momentarily explore territory above $1.34 before dropping to within striking distance of $1.33 (just north of H1 Quasimodo resistance-turned support at $1.3271).
Technical Outlook:
Having seen daily support from $1.3355 on ‘shaky’ ground, sellers could remain in the driving seat in early trading today, perhaps attacking $1.35 (H1).

DISCLAIMER:
The information contained in this material is intended for general advice only. It does not take into account your investment objectives, financial situation or particular needs. FP Markets has made every effort to ensure the accuracy of the information as at the date of publication. FP Markets does not give any warranty or representation as to the material. Examples included in this material are for illustrative purposes only. To the extent permitted by law, FP Markets and its employees shall not be liable for any loss or damage arising in any way (including by way of negligence) from or in connection with any information provided in or omitted from this material. Features of the FP Markets products including applicable fees and charges are outlined in the Product Disclosure Statements available from FP Markets website, www.fpmarkets.com and should be considered before deciding to deal in those products. Derivatives can be risky; losses can exceed your initial payment. FP Markets recommends that you seek independent advice. First Prudential Markets Pty Ltd trading as FP Markets ABN 16 112 600 281, Australian Financial Services License Number 286354.


 Access +10,000 financial
instruments
Access +10,000 financial
instruments