Charts: Trading View
(Italics: Previous Analysis)
EUR/USD:
Global equities soared on Wednesday, elevated on the back of sanctions from the West and talks of compromise between Russia and the Ukraine. The clear risk-on setting also observed US Treasury yields extend gains and traditional safe-haven currencies, such as the Japanese yen, Swiss franc and US dollar, navigate lower.
Against six international currencies, including the euro, the Japanese yen and sterling, the US Dollar Index (USDX) snowballed south. This lifted EUR/USD more than 1.5 percent higher on Wednesday and reclaimed a large slice of the prior week’s tumble.
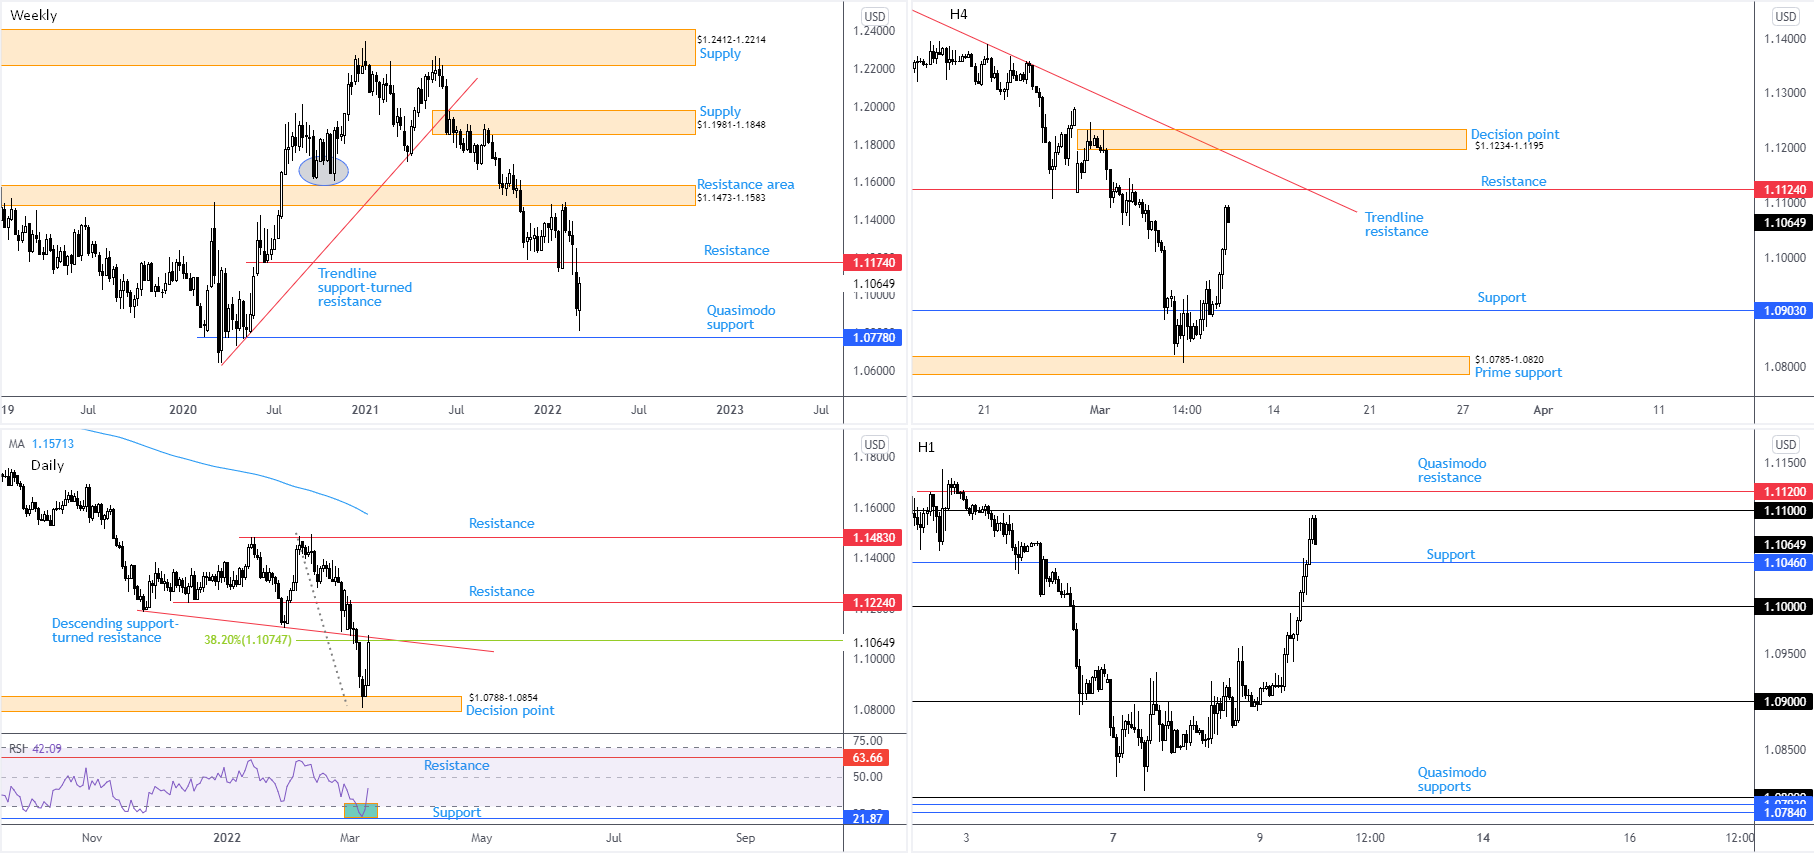
Leaving Quasimodo support at $1.0778 unopposed on the weekly timeframe, price action is closing in on weekly resistance at $1.1174. This level is deserving of the watchlist. Not only did the barrier serve well as support in mid-2020 and in early 2022, the trend remains lower. Earlier research noted the following in terms of trend:
According to trend on the bigger picture, a downside bias has been seen since topping at $1.2350 at the beginning of January (2021) on the weekly timeframe. This is reinforced by a weekly trendline support breach, drawn from the low $1.0636, together with the break of the $1.1602 November 2020 low (circled) and the retest of weekly resistance at $1.1473-1.1583.
Out of the daily timeframe, Wednesday’s spirited advance north of a decision point at $1.0788-1.0854 led the currency pair to a descending support-turned resistance, taken from the low $1.1186, and a 38.2% Fibonacci retracement at $1.1075. Additional structure resides at $1.1224 resistance, which shares chart space with the weekly timeframe’s resistance from $1.1174.
Following a retest of $1.0903 that established support on the H4, EUR/USD had a reasonably clear run to climb yesterday. Overhead, H4 resistance calls for attention at $1.1124, followed closely by trendline resistance, drawn from the high $1.1495, and a decision point at $1.1234-1.1195. From the H1 timeframe, the $1.11 figure is within touching distance, a psychological level sheltered under Quasimodo resistance at $1.1120 (arranged 4 pips below H4 resistance at $1.1124). Support is visible nearby at $1.1046, with a break perhaps unlocking the door back to $1.10.
Technical Outlook:
Although further buying is possible on the weekly timeframe until resistance at $1.1174, daily resistance around $1.1075 is worth noting. This—coupled with H1 Quasimodo resistance at $1.1120 and H4 resistance at $1.1124—could witness H1 whipsaw above $1.11 and unearth a bearish scenario (traders shorting the $1.1120 confluence, fuelled on the back of buy-stops above $1.11).
AUD/USD:
Boosted by upbeat risk sentiment, the Australian dollar finished higher against its US counterpart on Wednesday and snapped a two-day bearish phase.
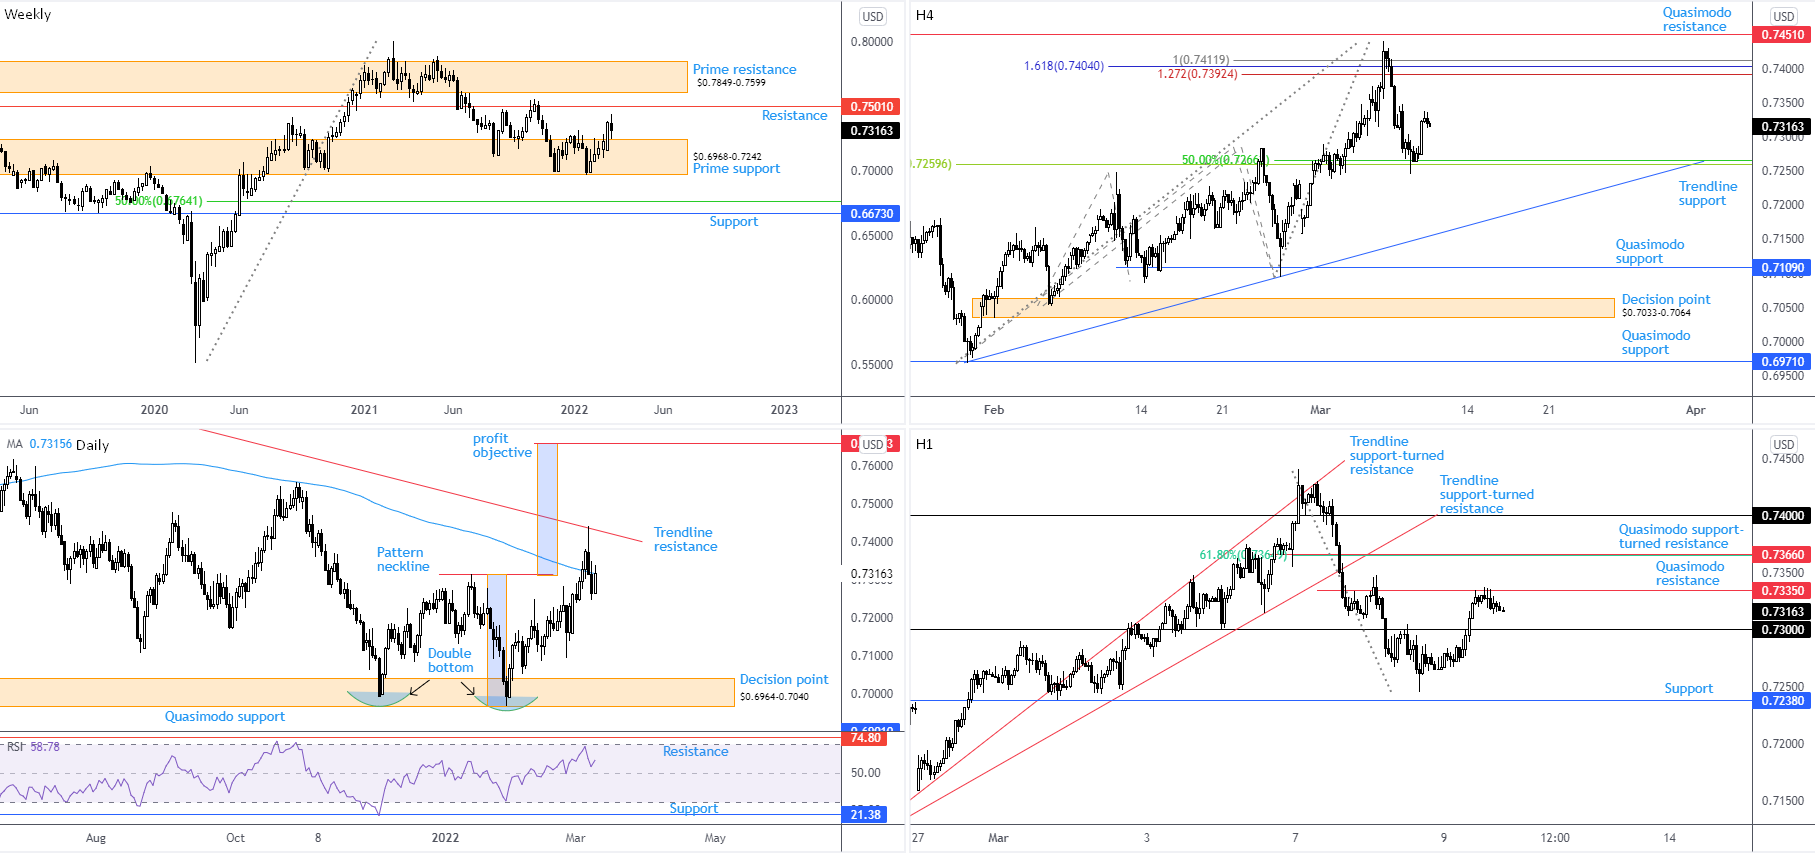
The weekly timeframe’s prime support area at $0.6968-0.7242 recently watched buyers gain power. Though despite recording a fifth consecutive session in the green last week, bulls are struggling to reach resistance at $0.7501. The higher timeframe trend might help answer for the lacklustre bid:
Longer term—the monthly timeframe—has portrayed a downtrend since August 2011, suggesting the 12.6 percent correction from mid-Feb tops at $0.8007 (2021) on the weekly timeframe might be the start of a bearish phase and not a dip-buying correction from the 2021 advance from pandemic lows of $0.5506. This (despite the recent upside) places a question mark on weekly prime support. If a break lower should come to pass, weekly support at $0.6673 and a 50% retracement at $0.6764 are observable.
Wednesday concluded at the lower side of the 200-day simple moving average at $0.7316, following Tuesday tunnelling through the value. Should the SMA deliver resistance, this shines the technical spotlight back on a decision point from $0.6964-0.7040. Alternatively, reclaiming position above the SMA signals strength out of weekly prime support and suggests daily trendline resistance, drawn from the high $0.8007, is vulnerable. An additional technical observation is the double-bottom pattern ($0.6991). You will note price has dethroned the pattern’s neckline ($0.7314), with the pattern shining light on a profit objective coming in at $0.7660. The relative strength index (RSI) on the daily timeframe also reveals the value modestly turning ahead of the 50.00 centreline: positive momentum.
Shaped by way of a 50% retracement at $0.7266 and a 38.2% Fibonacci retracement at $0.7260, this H4 base chalked up support in recent trading. To the upside, a H4 Fibonacci cluster is seen between $0.7412 and $0.7392, an area sheltered under H4 Quasimodo resistance at $0.7451. A closer reading of price action on the H1 timeframe has buyers and sellers squaring off from Quasimodo resistance at $0.7335, a level aided by the 200-day simple moving average on the daily timeframe. $0.73 may offer support if retested, yet rupturing $0.7335 reveals H1 Quasimodo support-turned resistance at $0.7366 and a 61.8% Fibonacci retracement.
Technical Outlook:
H1 Quasimodo resistance at $0.7335 and the daily timeframe’s 200-day simple moving average at $0.7316 potentially delivering resistance may pull H1 under $0.73.
On the other hand, weekly price making its way out of prime support at $0.6968-0.7242 and H4 rebounding from support around $0.7260 could underpin movement above H1 Quasimodo resistance at $0.7335 to target H1 resistance at $0.7366 and perhaps $0.74.
USD/JPY:
Hopes of talks between Russia and the Ukraine prompted risk-on movement Wednesday. Demand for the safe-haven Japanese yen diminished and reinforced a USD/JPY bid.
Recent outperformance in USD/JPY should not surprise in regards to our recent trend studies:
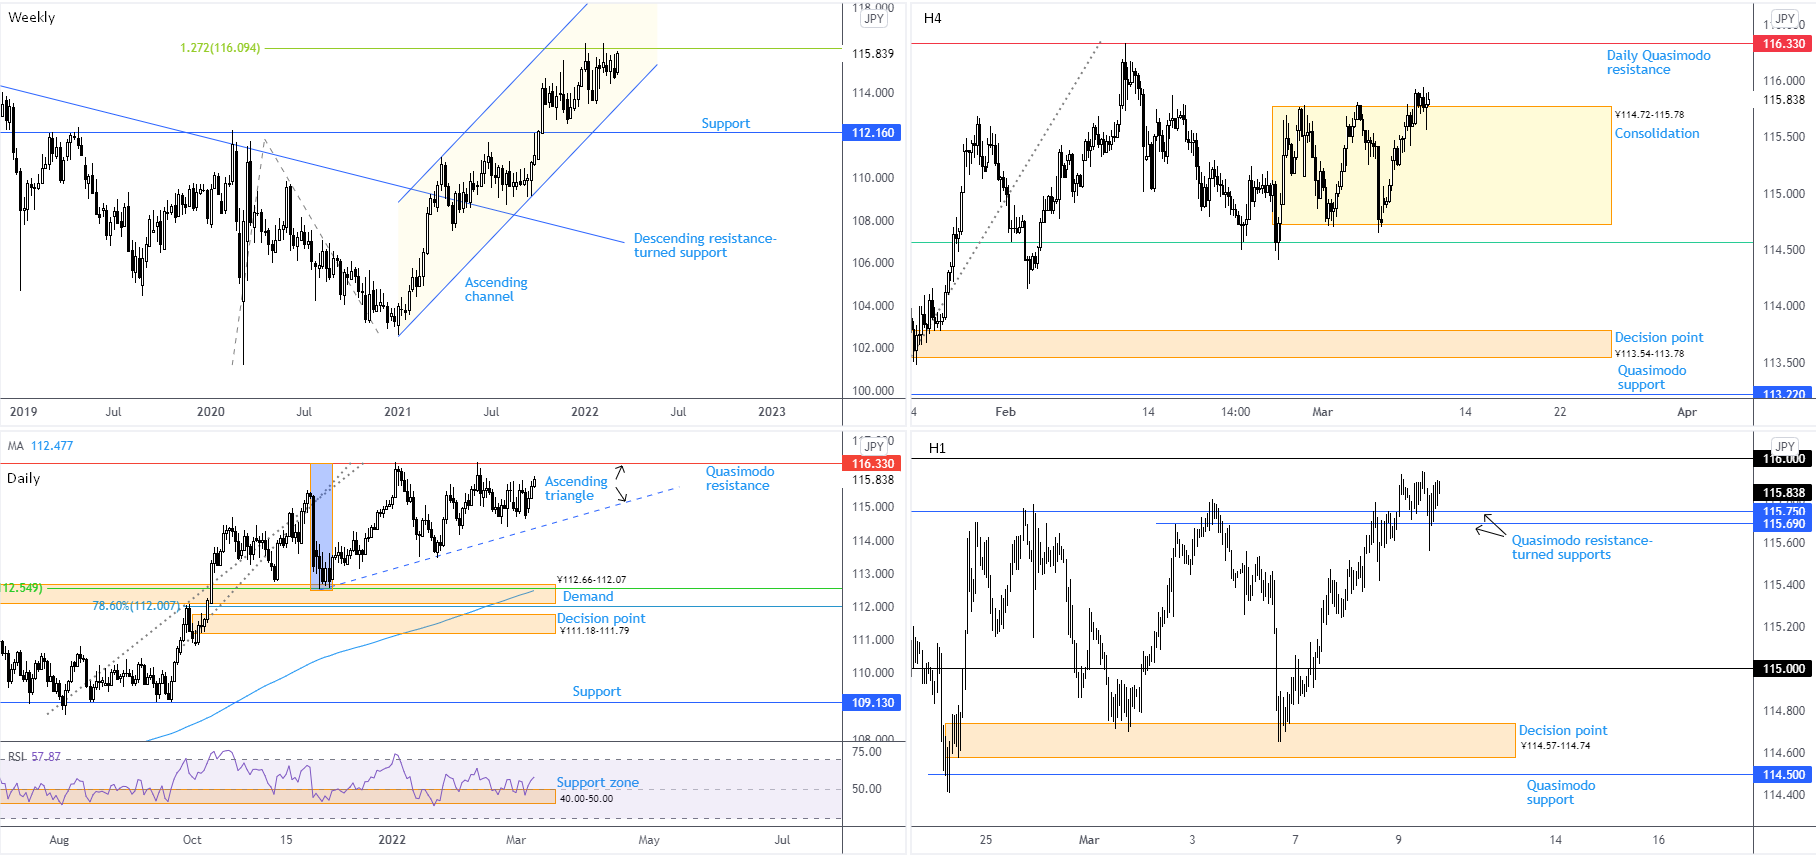
The trend in this market favours buyers at the moment. The currency pair has been stepping higher since early 2021, clearly visible on the weekly timeframe. In line with this, the overall longer-term trend has been climbing since 2012 (check monthly timeframe). The 21.5 percent correction from June 2015 to June 2016 provided a dip-buying opportunity, as did a subsequent 14.8 percent correction from December 2016 to pandemic lows formed early March 2020. The weekly timeframe’s 1.272% Fibonacci projection at ¥116.09, as you can see, has remained a headwind since the beginning of this year. Should sellers strengthen their grip, weekly channel support, extended from the low ¥102.59, could be an area we see enter the frame.
The daily picture also remains unchanged:
The daily chart has been in the process of chalking up an ascending triangle pattern (typically considered a continuation arrangement) since December 2021 between Quasimodo resistance at ¥116.33 and an ascending line drawn from the low ¥112.53. Toppling ¥116.33 would allow analysts to chart a pattern profit objective by extending the ‘base’ distance (blue vertical box) from the breakout point. Withdrawing under the ascending line would seat supply-turned demand from ¥112.66-112.07 in the picture. Not only is the area in the company of a 78.6% Fibonacci retracement at ¥112.00 and a 50% retracement from ¥112.55, technicians will acknowledge the widely watched 200-day simple moving average housed within the zone at ¥112.48. Note that the relative strength index (RSI) is also rebounding from support between 40.00 and 50.00 (a ‘temporary’ oversold range since 10th May—common view in trending markets).
In terms of where we stand on the H4 timeframe right now, you will see the unit cleared range resistance at ¥115.78 on Wednesday and subsequently held the breached barrier as support. This may be viewed as an early cue we’re headed for the daily timeframe’s Quasimodo resistance at ¥116.33. A similar setup is evident on the H1 timeframe. Two Quasimodo resistances at ¥115.75 and ¥115.69 were engulfed and later retested to form supports, action highlighting a potential approach to ¥116.
Technical Outlook:
Given scope for further upside on the higher timeframes, and the H4/H1 timeframes breaching (and retesting) supports around ¥115.70, an extension higher to ¥116 could be seen. This is positioned closely with the 1.272% Fibonacci projection at ¥116.09 and daily Quasimodo resistance at ¥116.33.
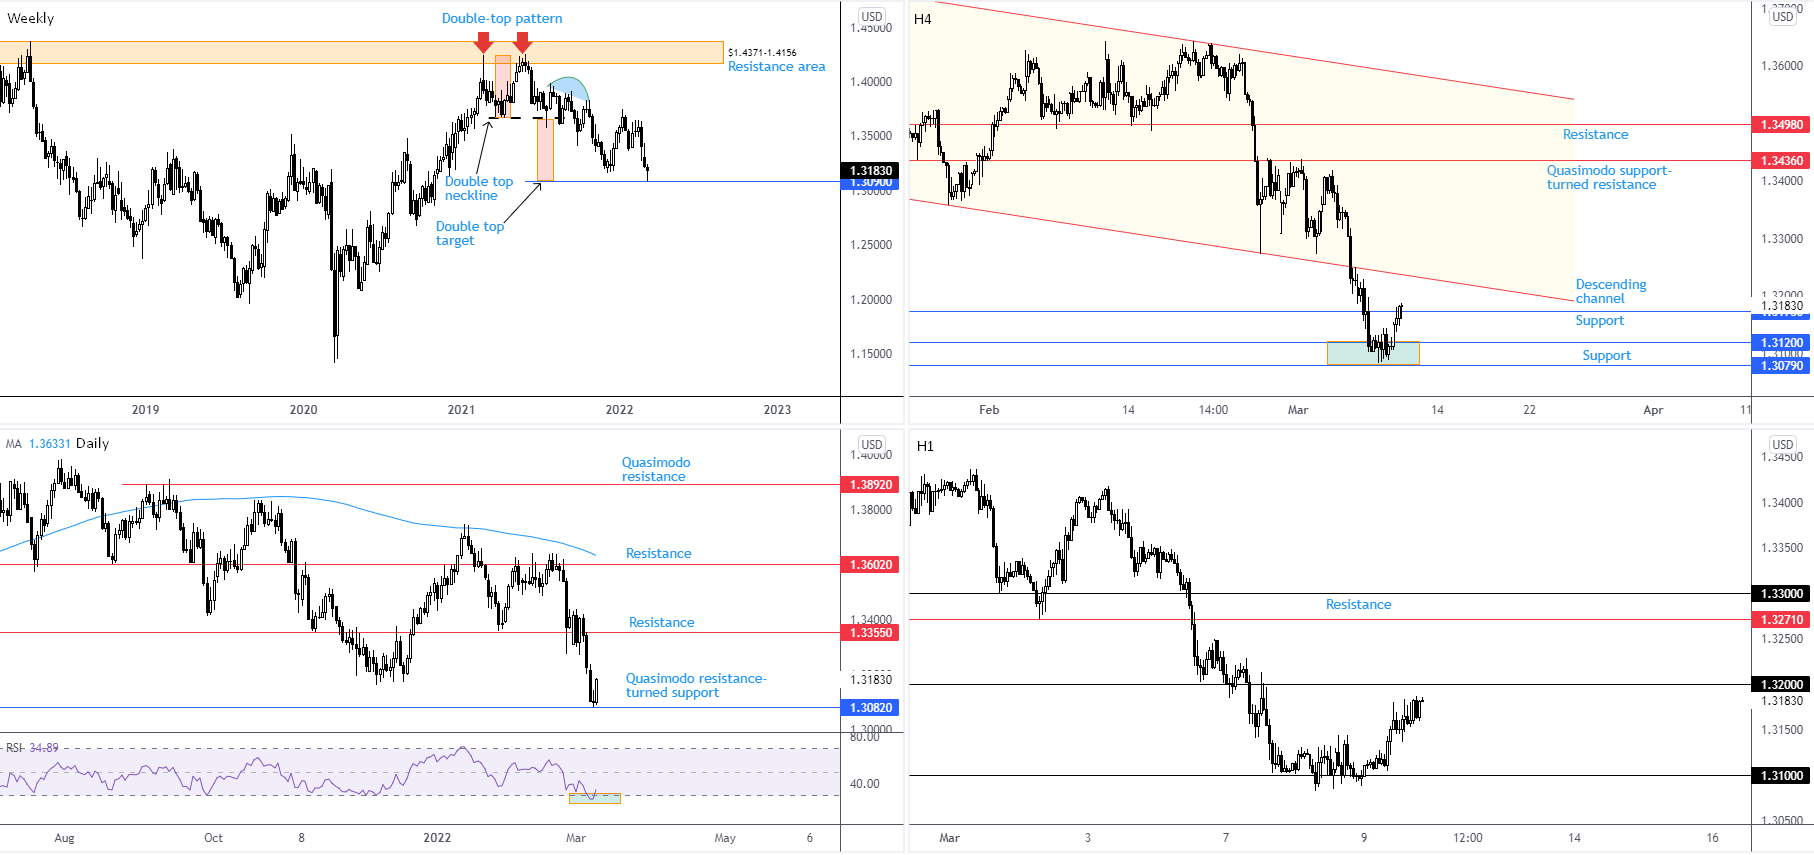
GBP/USD:
Sterling benefitted on Wednesday as the US dollar plummeted more than 1 percent, according to the US Dollar Index (USDX). The risk-on scenario, in addition to clear-cut technical support, watched GBP/USD snap a four-day losing streak.
In terms of trend, recent research noted the following:
Longer-term trend direction has been southbound since late 2007 tops at $2.1161. As a result, the move from pandemic lows in March 2020 could be viewed as a pullback within the larger downtrend. This, of course, places a question mark on the 8 percent ‘correction’ from February 2021 to December 2021; it may in fact be the beginning of a longer-term push to the downside and not a dip-buying scenario.
Noted technical support in this market:
- Weekly price shaking hands with a double-top ($1.4241) profit objective at $1.3090.
- The daily timeframe’s Quasimodo resistance-turned support at $1.3082 and the relative strength index (RSI) exiting oversold conditions (average gains beginning to outweigh average losses). Resistance is seen at $1.3355.
- H4 support between $1.3079 and $1.3120 welcomed buyers in recent trading, with resistance at $1.3173 taken out and, as of writing, holding as support. Channel support-turned resistance, drawn from the low $1.3358, might step in should further buying materialise.
- H1 support fell in at the psychological level $1.31. $1.32 is seen nearby, with a break exposing H1 resistance at $1.3271.
Technical Outlook:
An absence of resistance on the higher timeframes until $1.3355 on the daily chart, together with H4 price overrunning resistance at $1.3173 (and holding as support for now), indicates a break above $1.32 may be in the offing. Upside targets north of $1.32 are H4 channel resistance around $1.3240, followed by H1 resistance at $1.3271 and $1.33.
DISCLAIMER:
The information contained in this material is intended for general advice only. It does not take into account your investment objectives, financial situation or particular needs. FP Markets has made every effort to ensure the accuracy of the information as at the date of publication. FP Markets does not give any warranty or representation as to the material. Examples included in this material are for illustrative purposes only. To the extent permitted by law, FP Markets and its employees shall not be liable for any loss or damage arising in any way (including by way of negligence) from or in connection with any information provided in or omitted from this material. Features of the FP Markets products including applicable fees and charges are outlined in the Product Disclosure Statements available from FP Markets website, www.fpmarkets.com and should be considered before deciding to deal in those products. Derivatives can be risky; losses can exceed your initial payment. FP Markets recommends that you seek independent advice. First Prudential Markets Pty Ltd trading as FP Markets ABN 16 112 600 281, Australian Financial Services License Number 286354.


 Access +10,000 financial
instruments
Access +10,000 financial
instruments