
Charts: TradingView
BTC/USD:
Daily Timeframe
We have an interesting technical landscape to work with on bitcoin versus the US dollar (BTC/USD). Since November 2021, buyers have essentially been on the ropes, plummeting an eye-popping 78%. Also of technical relevance is price cementing itself under the 200-day simple moving average ($21,773) since the beginning of this year: another bearish trend signal. In addition to this, the 50-day simple moving average ($18,525) slipped under the 200-day SMA in mid-January, a signal often referred to as a Death Cross (indicating a longer-term downtrend is possibly in the offing [clearly correct in this case]). Consequently, it is safe to say that this market is trending south, and selling rallies is likely to remain the dominant strategy for many BTC/USD traders and investors at the moment.
Since November 10, buyers and sellers have been squaring off around $15,523. As evident from the chart, this is a pattern profit objective derived from a bearish pennant formed in May, drawn from between $25,338 and $31,418. Overhead, resistance calls for attention at $18,099, followed by $20,000. Should the unit push through $15,523, as suggested by the underlying trend, $12,216 is a visible support, a 100% projection which represents an AB=CD bullish formation. Also of note, between mid-June and mid-August, we welcomed a bearish flag pattern (extended from between $17.567 and $21,711), which recognises a pattern profit objective (green) as far south as $7,674.
Therefore, given the clear-cut downtrend, it should not surprise to see $15,523 cleared and perhaps a test of $12,216.
 LTC/USD:
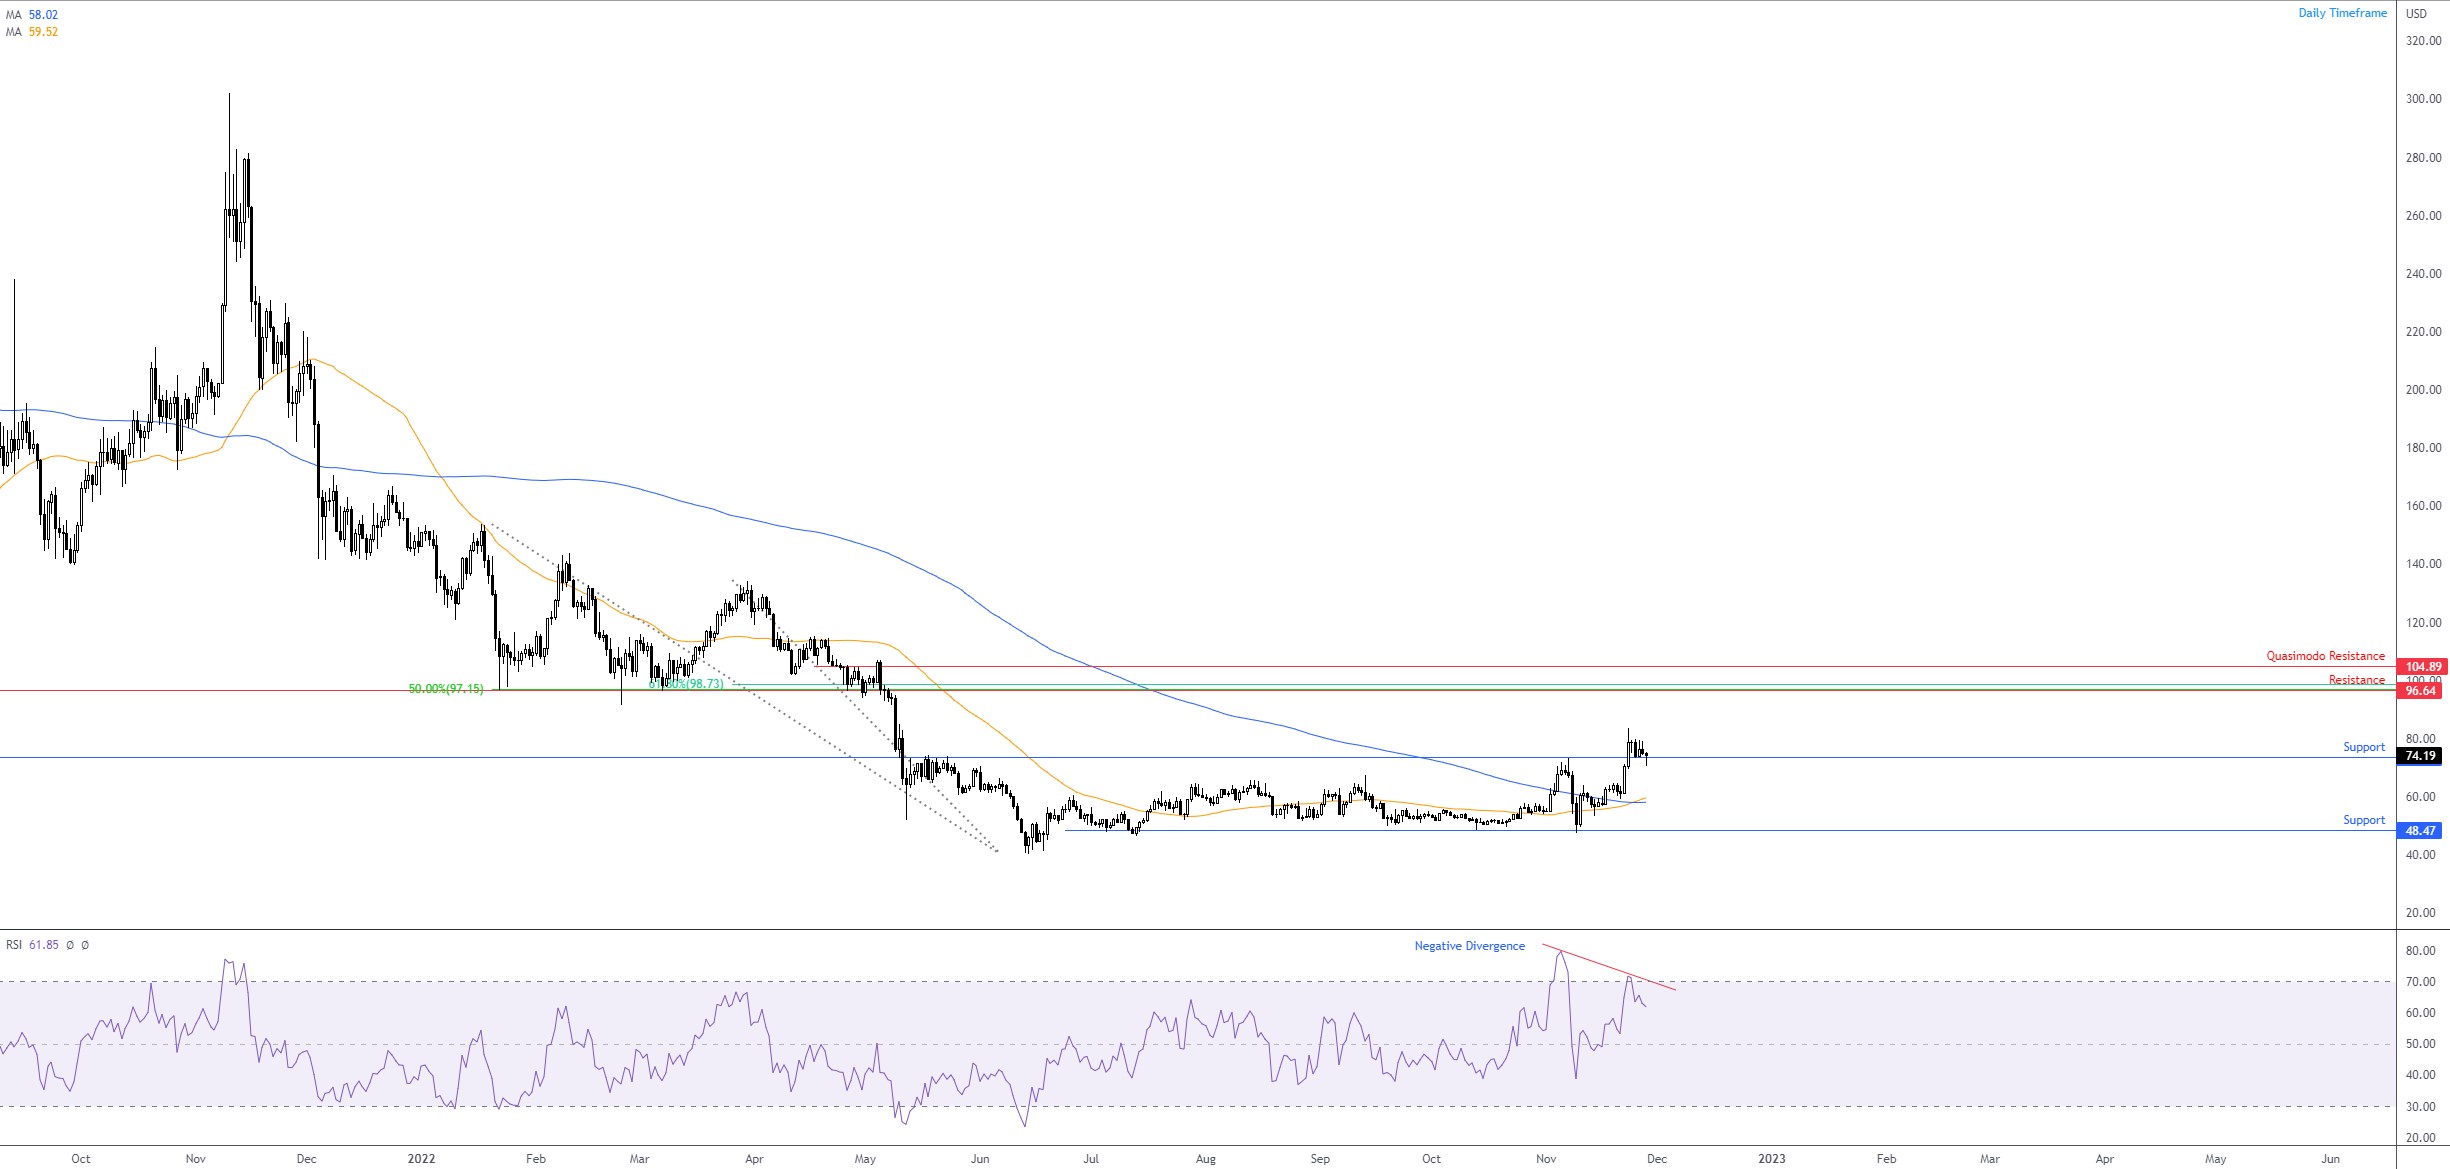
Daily Timeframe
Since LTC/USD pencilled in a bottom at $40.32 in mid-June, price has been slowly grinding higher. Last week, rallying 20.8%, the unit jumped to a high of $83.43, forging a fresh higher high and ultimately informing market participants that this market is in the phase of switching from a downtrend to an uptrend. This saw price puncture resistance at $73.64 which, as you can see, is now being retested as a support (in the shape of a Japanese hammer candlestick pattern at the time of writing). Also in support of a possible trend reversal to the upside, we can see that the 50-day simple moving average ($59.51) has crossed above the 200-day simple moving average ($58.01). This, in the world of technical trading, is known as a Golden Cross: a signal designed to indicate potential for a longer-term uptrend (essentially showing that there is strength to the upside in this market at the moment, though do be aware that false signals are common in crossover scenarios).
Above current price, resistance is seen at $96.64, accompanied by a 61.8% Fibonacci ratio at $98.73 and a 50.00% retracement ratio at $97.15. This is closely followed by a Quasimodo resistance parked at $104.89. Back under current support, aside from the 200 and 50-day SMAs, throws light on support as far south as $48.47.
While we do have the relative strength index (RSI) chalking up negative divergence—telling traders and investors that this market is showing signs of a deceleration in upside momentum—technical evidence still favours buyers at this point. As a result, assuming a positive close off support at $73.64, buyers may step in and pull this market northbound towards resistance between $104.89 and $96.64.
 XRP/USD:
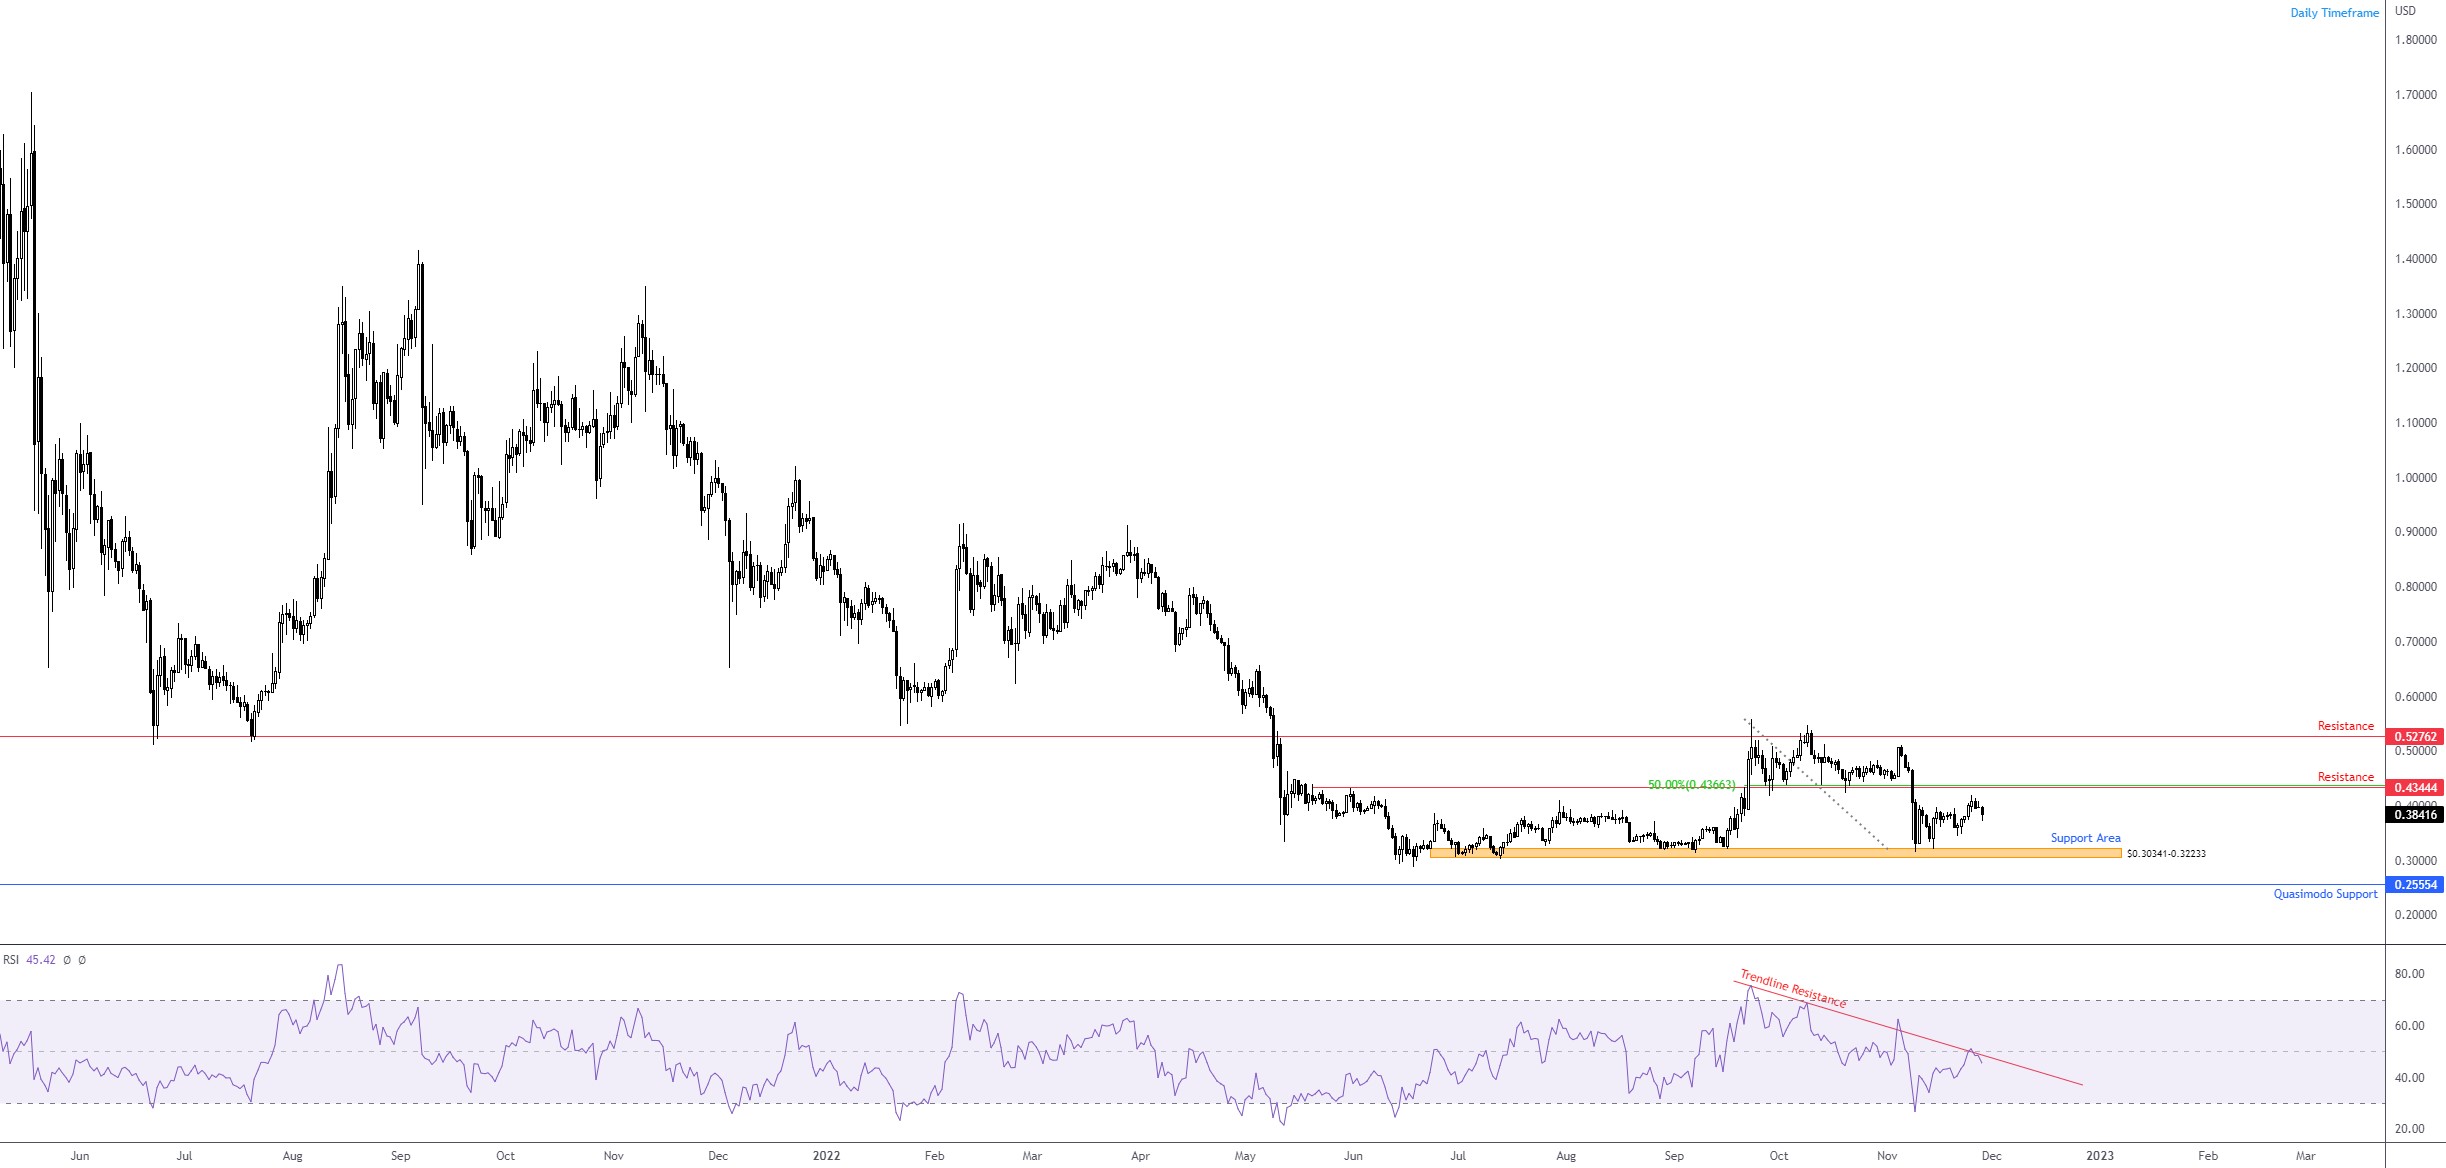
Daily Timeframe.
While the overall direction for XRP/USD has been lower since September 2021, price action largely bottomed in mid-May of this year and has been directionless since. Support, as you can see, stepped in at $0.30341-0.32233, withstanding several downside attempts. Resistance is seen at $0.43444, joined by a 50.0% retracement at $0.43663. Above here, traders will be watching resistance coming in at $0.52762, while slipping below current support highlights Quasimodo support from $0.25554.
In terms of where we stand on the relative strength index (RSI), the indicator’s value is showing signs of levelling off at the underside of the 50.00 centreline and indicator trendline resistance, extended from the high 75.58.
With the above analysis, resistance from $0.43444 will likely be closely watched by sellers as a potential platform to work with if tested, targeting support from $0.30341-0.32233.
 DISCLAIMER:
The information contained in this material is intended for general advice only. It does not take into account your investment objectives, financial situation or particular needs. FP Markets has made every effort to ensure the accuracy of the information as at the date of publication. FP Markets does not give any warranty or representation as to the material. Examples included in this material are for illustrative purposes only. To the extent permitted by law, FP Markets and its employees shall not be liable for any loss or damage arising in any way (including by way of negligence) from or in connection with any information provided in or omitted from this material. Features of the FP Markets products including applicable fees and charges are outlined in the Product Disclosure Statements available from FP Markets website, www.fpmarkets.com and should be considered before deciding to deal in those products. Derivatives can be risky; losses can exceed your initial payment. FP Markets recommends that you seek independent advice. First Prudential Markets Pty Ltd trading as FP Markets ABN 16 112 600 281, Australian Financial Services License Number 286354.


 Access +10,000 financial
instruments
Access +10,000 financial
instruments