
EUR/USD:
Monthly timeframe:
(Technical change on this timeframe is often limited though serves as guidance to potential longer-term moves)
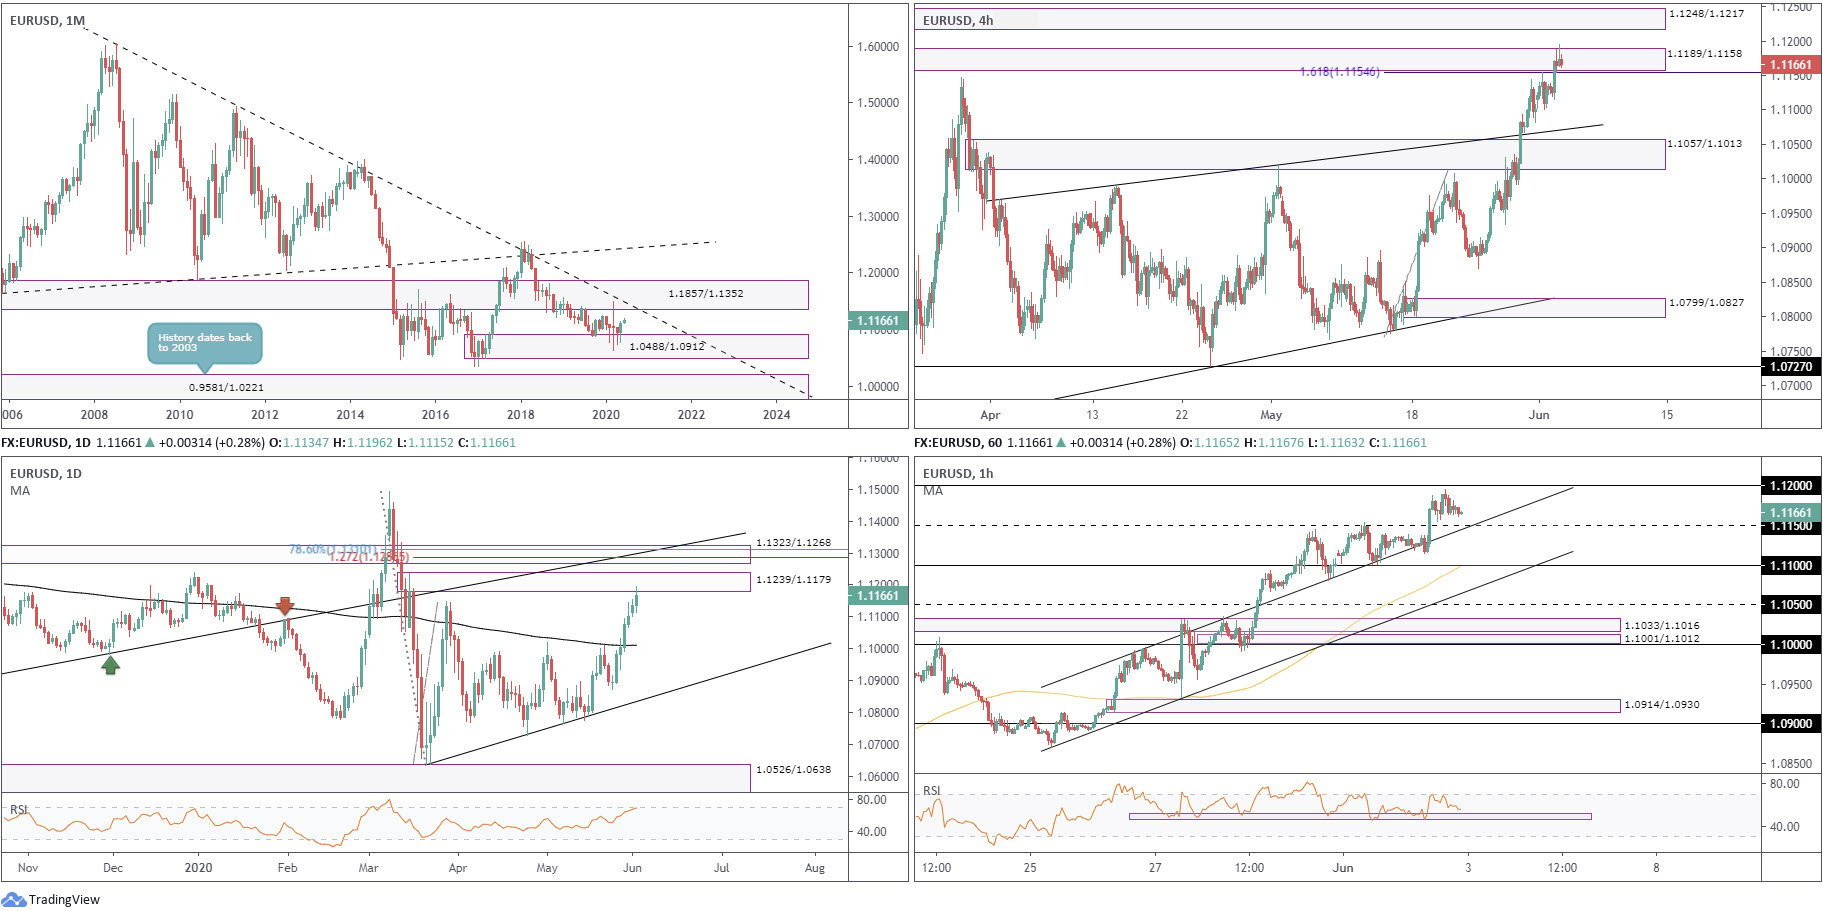
March, evident from the monthly chart, left behind a long-legged doji indecision candle, with its extremes crossing paths with heavyweight supply at 1.1857/1.1352 (intersects with a long-term trendline resistance [1.6038]) and demand at 1.0488/1.0912.
April spent the best part of the month feasting on the top edge of 1.0488/1.0912, squeezing out a Japanese hammer candlestick pattern, typically viewed as a bullish reversal signal. May, as you can see, recovered off worst levels and wrapped up a few pips shy of monthly highs, with June perhaps taking aim at 1.1857/1.1352.
With reference to the primary trend, price has exhibited clear lower peaks and troughs since 2008.
Daily timeframe:
Partially altered from previous analysis –
Recording its sixth successive daily gain Tuesday, largely stirred on the back of consecutive USD declines, price extended space north of the 200-day simple moving average at 1.1010, with supply at 1.1239/1.1179 making its debut yesterday.
Above current supply, another supply area exists at 1.1323/1.1268, joined with trendline resistance (1.0879), a 127.2% Fib ext. level at 1.1286 and 78.6% Fib ret level from 1.1310.
H4 timeframe:
After forming a modest peak at 1.1154 on Monday, drawing in a 161.8% Fib ext. level at 1.1154, Tuesday, sponsored by USD weakness, had price breach the upper limit of 1.1189/1.1158, a rally-base-drop supply zone.
Whipsawing the supply by way of a Japanese shooting star candlestick pattern, generally considered a bearish signal, exploring lower levels could be an option today. Equally likely, however, is a pop to supply at 1.1248/1.1217 (prior demand).
H1 timeframe:
Early London latched onto a strong bid off channel support (prior resistance – 1.0991), subsequently toppling offers around 1.1150. 1.12, as you can see, is tipped as the next resistance point on this timeframe.
Aside from 1.1250, technical studies suggest thin air inhabits space above 1.12 until crossing paths with supply from 1.1322/1.1286.
Structures of Interest:
The whipsaw above H4 supply at 1.1189/1.1158 is a concern should you derive your analysis from a single timeframe. However, knowing daily price recently connected with supply at 1.1239/1.1179, the H4 whipsaw could simply be a play to grab stops to fuel an intraday downside move today. Breaching 1.1150 on the H1 timeframe will help confirm seller intent, leaving the field open to 1.11.
AUD/USD:
Monthly timeframe:
(Technical change on this timeframe is often limited though serves as guidance to potential longer-term moves)
May’s extension and June’s early rally has, as you can see, landed monthly flow within the parapets of supply fixed at 0.7029/0.6664, an area intersecting with a long-term trendline resistance (1.0582).
Regarding the market’s primary trend, a series of lower lows and lower highs have been present since mid-2011.
Daily timeframe:
Elevated on the back of risk-on movement, supply at 0.6883/0.6824 put up little fight Tuesday. Price is now geared towards resistance at 0.6931.
As a reminder, upside recently crossed above the 200-day simple moving average at 0.6656, generally regarded as a bullish signal, and simultaneously hauled the RSI oscillator into overbought territory.
H4 timeframe:
The absence of offers produced a nice-looking demand area at 0.6773/0.6814 yesterday. This base may be challenged today should we witness supply at 0.6910/0.6884 put a lid on gains.
H1 timeframe:
Following a short-lived retest at 0.6850, buyers regained footing and are seen climbing to 0.69, pulling the RSI momentum indicator into overbought waters and forming bearish divergence.
Breaching 0.69 today unmasks supply positioned nearby at 0.6939/0.6926, extended from early January 2020.
Structures of Interest:
With monthly trendline resistance expected to make a show at approximately 0.6928, and daily resistance haunting the 0.6931 region, a whipsaw through 0.69 to H1 supply at 0.6939/0.6926 could be on the menu for possible bearish scenarios. A H1 close back beneath 0.69 will likely add conviction, with an intraday target resting at 0.6850.

USD/JPY:
Monthly timeframe:
(Technical change on this timeframe is often limited though serves as guidance to potential longer-term moves)
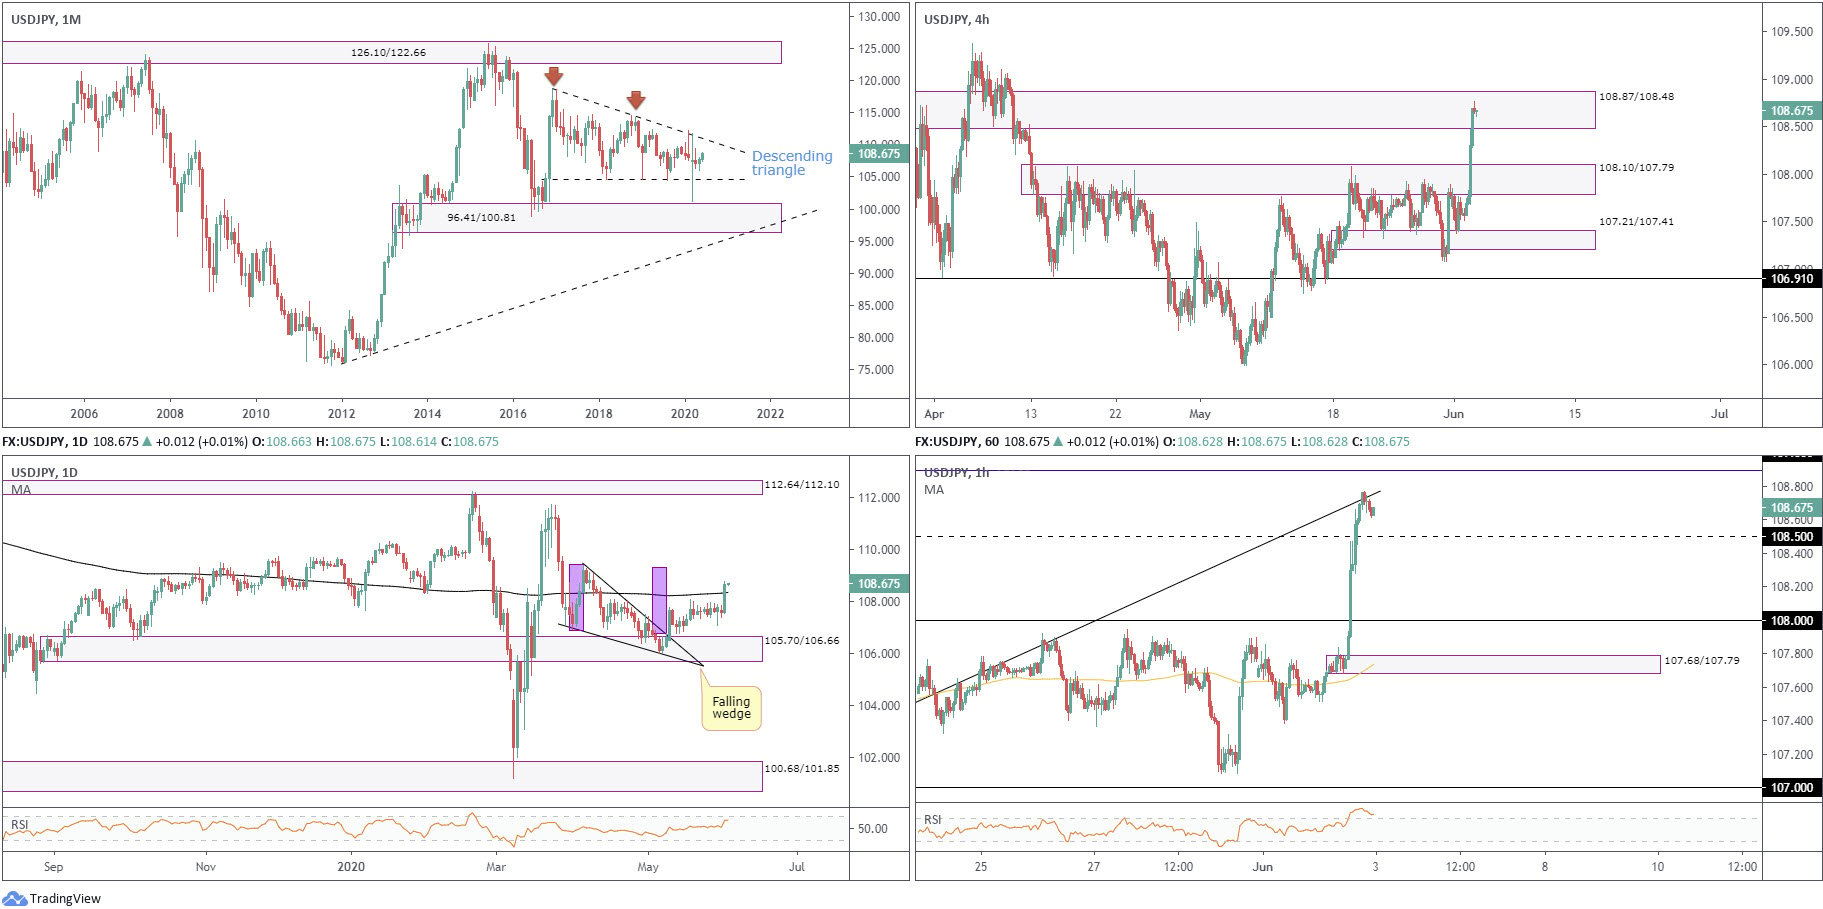
Since kicking off 2017, USD/JPY has been busy carving out a descending triangle pattern between 118.66/104.62. The month of March concluded by way of a long-legged doji candlestick pattern, ranging between 111.71/101.18, with extremes piercing the outer limits of the aforementioned descending triangle formation. April was pretty uneventful, ranging between 109.38/106.35. May also remained subdued, ranging between 108.08/105.98.
Areas outside of the noted pattern can be seen at supply from 126.10/122.66 and demand coming in at 96.41/100.81.
Daily timeframe:
Partially altered from previous analysis –
Since registering a top from 109.38 at the beginning of April, USD/JPY moulded a falling wedge pattern, which had its upper limit breached on May 11 in strong fashion, boosted by demand at 105.70/106.66. The take-profit target out of the pattern, traditionally measured by taking the value of the base and adding this to the breakout point (purple), sets an upside objective of around 109.30.
As you can see, after dethroning the 200-day simple moving average at 108.34, we are within touching distance of completing the falling wedge pattern.
H4 timeframe:
By way of a half-hearted Japanese shooting star candlestick pattern, considered a bearish cue, price tested supply coming in from 108.87/108.48 following Tuesday’s spirited recovery that overcome reasonably long-standing supply at 108.10/107.79.
H1 timeframe:
Tuesday’s healthy bid powered through a number of key technical resistances and ended the day marginally fading a trendline resistance (prior support – 106.85). Directly above, we have a 161.8% Fib ext. point at 108.89 (blue) and the 109 round number.
Dips from the current trendline resistance will find initial support at 108.50.
Structures of Interest:
H4 supply at 108.87/108.48 may appeal to sellers today, knowing H1 trendline resistance also recently entered the picture. Intraday targets from these angles sit at 108.50, followed by the 200-day simple moving average at 108.34 and then the upper boundary of H4 supply at 108.10.
GBP/USD:
Monthly timeframe:
(Technical change on this timeframe is often limited though serves as guidance to potential longer-term moves)
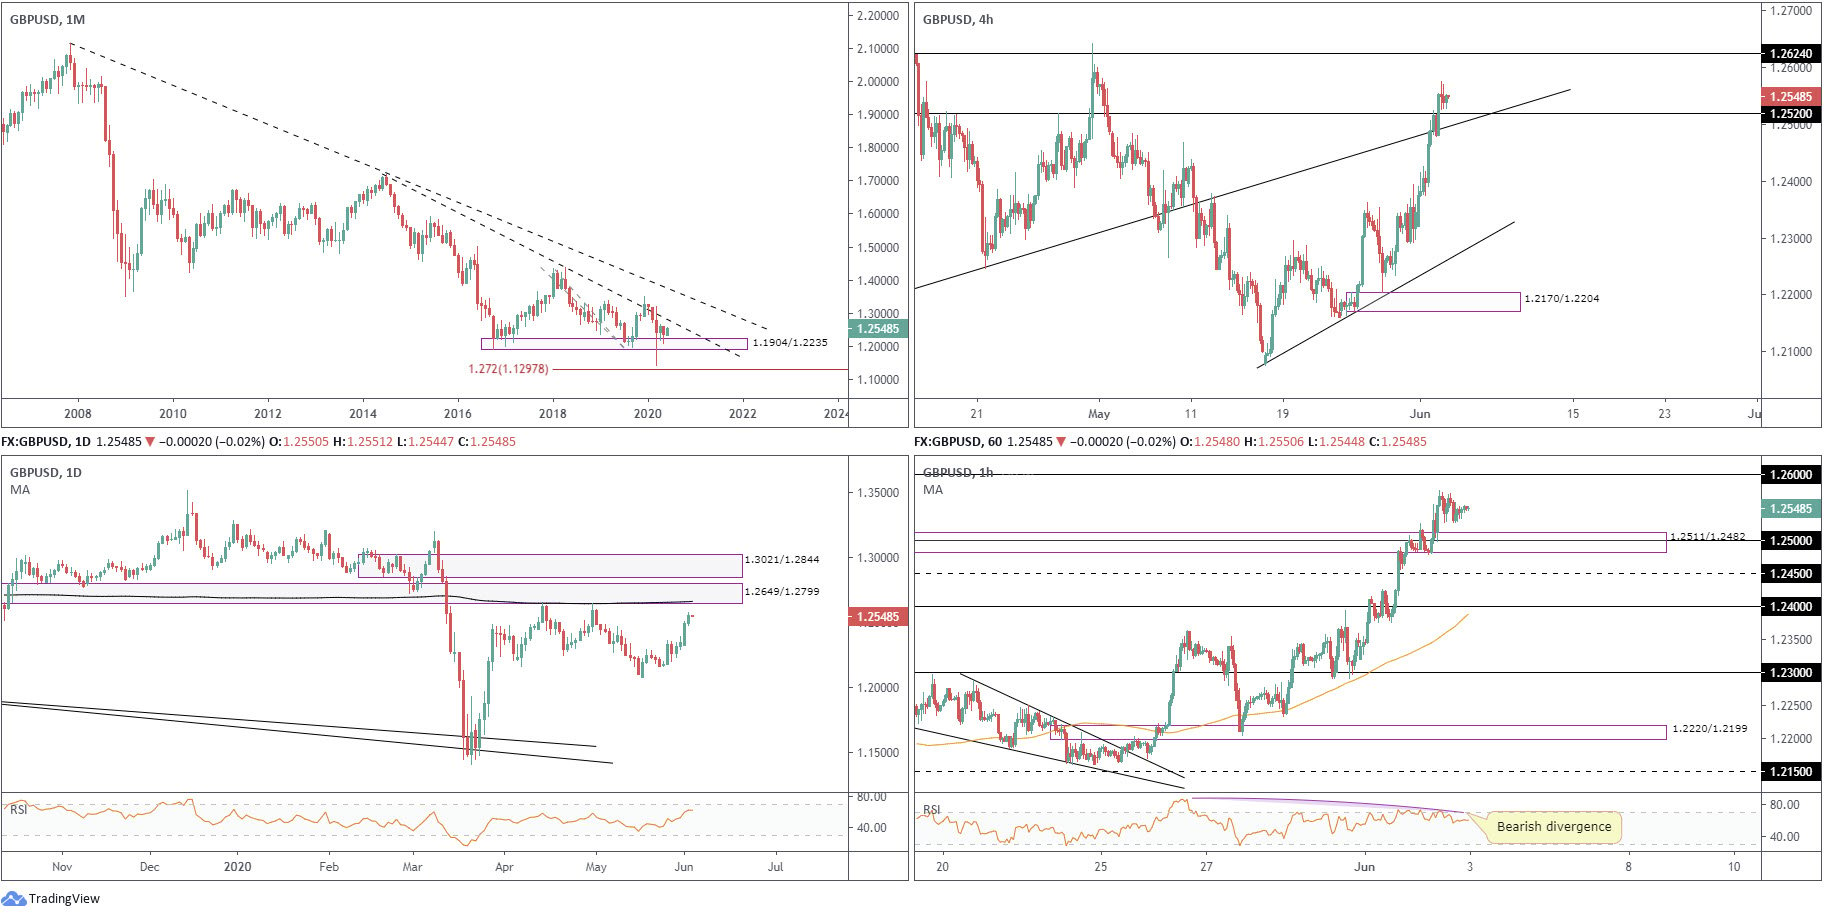
Support at 1.1904/1.2235 remains in motion as we transition into June. Neighbouring resistance, should we see further recovery, can be found in the form of a trendline (1.7191). A violation of support, nevertheless, puts forward a 127.2% Fib ext. level at 1.1297.
Concerning the primary trend, lower peaks and troughs have decorated the monthly chart since early 2008.
Daily timeframe:
GBP/USD retained its underlying bid Tuesday, latching onto its fourth successive gain.
The pound’s days in the sun may be numbered, however, having seen price nearing supply at 1.2649/1.2799 (prior demand), an area aligning with the 200-day simple moving average at 1.2661.
H4 timeframe:
H4 attempted a pullback from resistance at 1.2520 Tuesday, though enthusiasm was lacking after price established a base off nearby trendline support (1.2163) and eventually overran the aforesaid resistance, uncovering additional resistance at 1.2624.
H1 timeframe:
Supply at 1.2511/1.2482, as you can see, failed to offers sellers much of a home on Tuesday, giving way into European trade.
Retesting 1.25, a level located within the walls of the aforesaid supply, the pair’s intraday bullish tone remained intact into the close, with 1.26 calling for attention today.
Traders will also note the 100-period simple moving average has been drifting higher since May 26. What’s more, we’re also seeing the RSI form bearish divergence.
Structures of Interest:
A retest scenario off H4 support at 1.2520 could be seen today, owing to all analysed timeframes exhibiting scope to navigate higher ground. However, do remain aware that a retest at 1.2520 could also spark interest in 1.2511/1.2482, the H1 demand (prior supply).
Between H4 resistance at 1.2624 and the 1.26 level on the H1 represents a possible hurdle buyers may struggle to breach today. Additional resistance can be found on the daily timeframe at the underside of supply at 1.2649.
DISCLAIMER:
The information contained in this material is intended for general advice only. It does not take into account your investment objectives, financial situation or particular needs. FP Markets has made every effort to ensure the accuracy of the information as at the date of publication. FP Markets does not give any warranty or representation as to the material. Examples included in this material are for illustrative purposes only. To the extent permitted by law, FP Markets and its employees shall not be liable for any loss or damage arising in any way (including by way of negligence) from or in connection with any information provided in or omitted from this material. Features of the FP Markets products including applicable fees and charges are outlined in the Product Disclosure Statements available from FP Markets website, www.fpmarkets.com and should be considered before deciding to deal in those products. Derivatives can be risky; losses can exceed your initial payment. FP Markets recommends that you seek independent advice. First Prudential Markets Pty Ltd trading as FP Markets ABN 16 112 600 281, Australian Financial Services License Number 286354.


 Access +10,000 financial
instruments
Access +10,000 financial
instruments