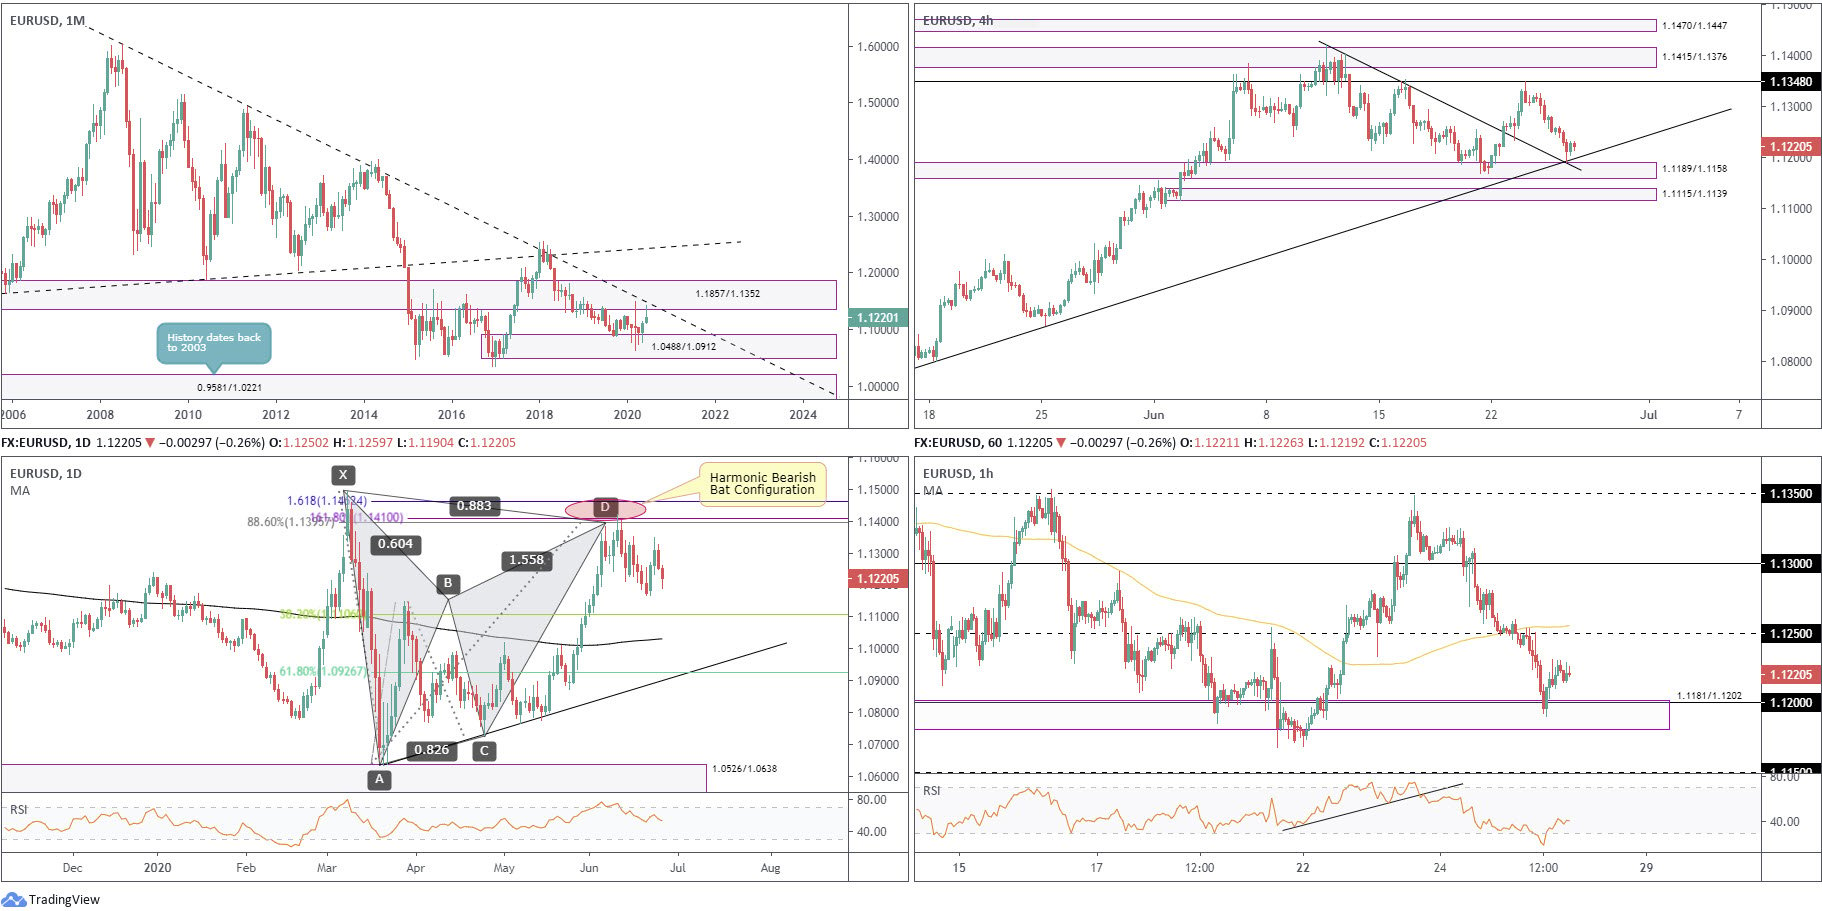
EUR/USD:
Monthly timeframe:
(Technical change on this timeframe is often limited though serves as guidance to potential longer-term moves)
May, as you can see, recovered off worst levels and wrapped up a few pips shy of monthly highs out of demand from 1.0488/1.0912.
June recently extended gains to highs at 1.1422, though ran into opposition at the lower ledge of supply from 1.1857/1.1352 (unites with long-term trendline resistance [1.6038]) – the month currently trades off best levels.
With reference to the primary trend, price has exhibited clear lower peaks and troughs since 2008.
Daily timeframe:
Brought forward from previous analysis –
EUR/USD recently addressed a potential reversal zone (PRZ), derived from a harmonic bearish bat pattern, comprised of an 88.6% Fib level at 1.1395, a 161.8% BC projection at 1.1410 and a 161.8% Fib ext. level at 1.1462 (red oval).
It’s typical to see traders sell PRZs and place protective stop-loss orders above the X point, in this case at 1.1495. Common take-profit targets fall in at the 38.2% and 61.8% Fib levels (legs A/D) at 1.1106 and 1.0926, respectively.
As you can see, the aforesaid Fib targets have yet to be met.
H4 timeframe:
The rejection from resistance at 1.1348 stirred a decisive sell-off Wednesday, snapping a two-day winning streak, With Thursday following through to lows at 1.1190. This directed a move into two trendline supports (1.1422/1.0780) as well as demand fixed from 1.1189/1.1158 (prior supply).
So far buyers have made their presence felt off the aforesaid areas, with limited resistance in sight until 1.1348. Failure to uphold current structure, nonetheless, could result in another layer of demand making a show at 1.1115/1.1139.
H1 timeframe:
Demand at 1.1181/1.1202, a base containing the 1.12 handle within its upper region, ignited a euro bid yesterday, despite the session closing in the red overall. Technicians will also note the current demand area is glued to the top edge of H4 demand at 1.1189/1.1158.
Renewed upside throws light on 1.1250 as feasible resistance, joined closely with the 100-period simple moving average, currently circling 1.1255.
Structures of Interest:
Higher timeframes point to a possible move towards the 1.11 level, the 38.2% Fib level at 1.1106 on the daily chart.
Although higher timeframes could hamper EUR/USD bids out of H1/H4 demands, 1.1250 on the H1 is still likely to put in an appearance. This represents an ideal take-profit base for longs off H1/H4 demands and, at the same time, puts forward a possible reversal zone for selling opportunities in line with higher-timeframe direction.
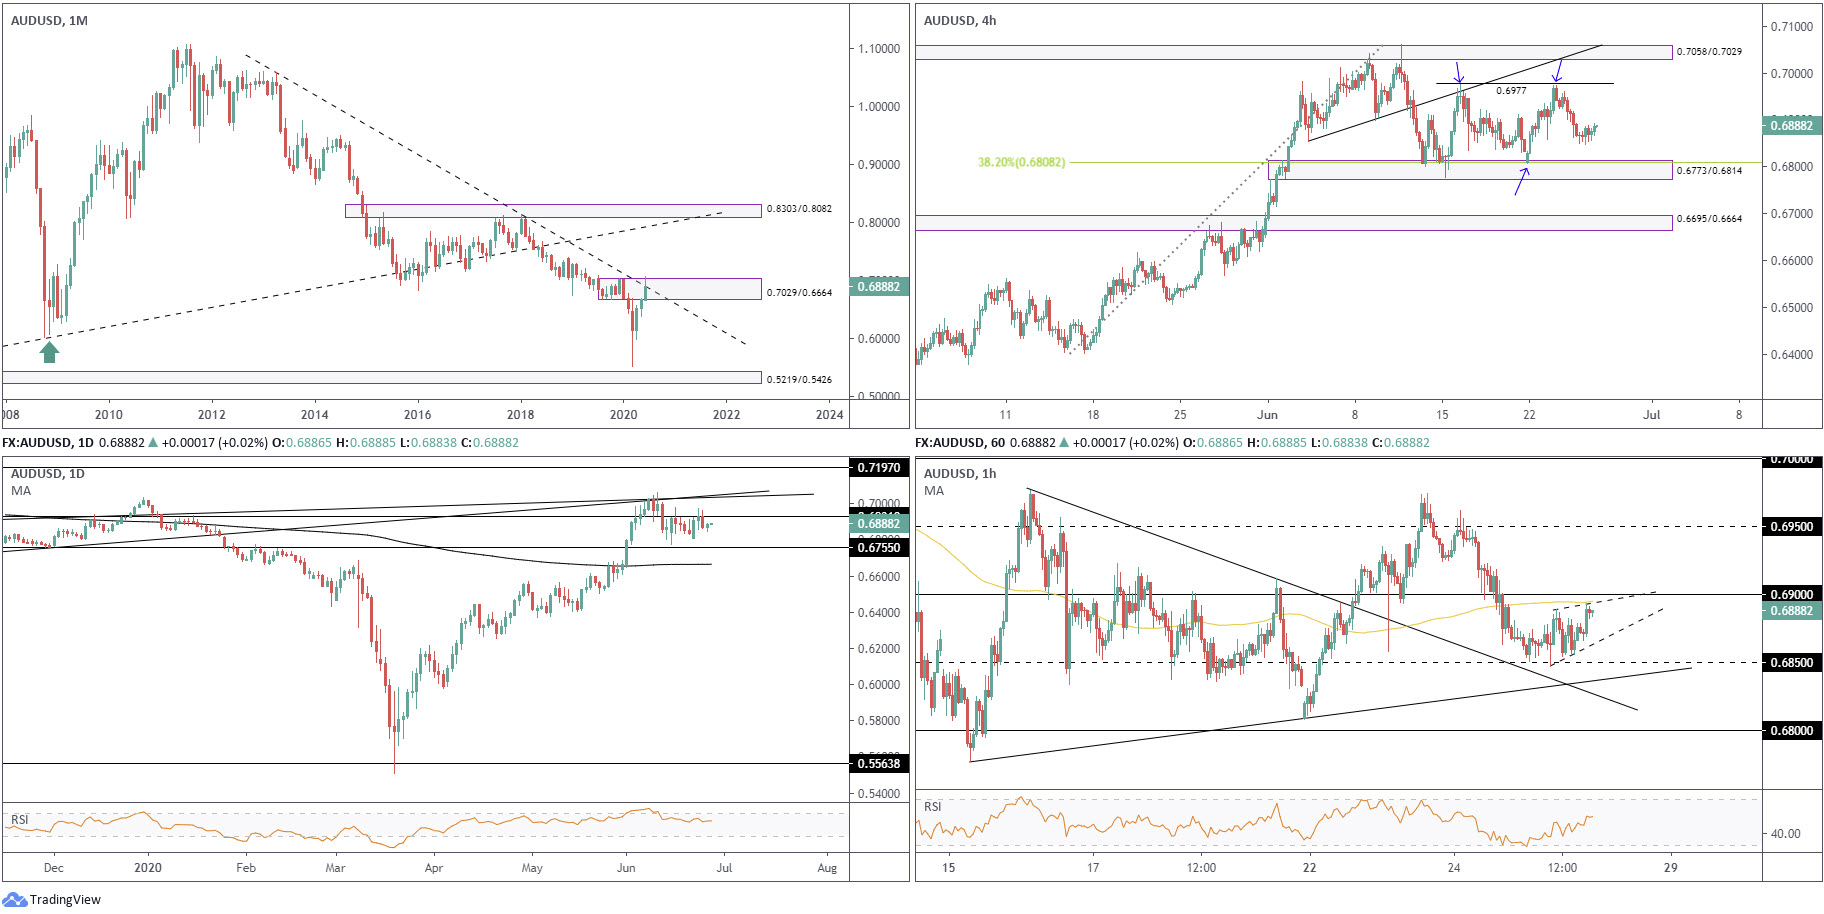
AUD/USD:
Monthly timeframe:
(Technical change on this timeframe is often limited though serves as guidance to potential longer-term moves)
May’s extension, as well as June’s follow-through, has supply at 0.7029/0.6664 echoing a somewhat vulnerable tone at the moment, despite the base benefitting from additional resistance by way of a long-term trendline formation (1.0582).
Regarding the market’s primary trend, a series of lower lows and lower highs have been present since mid-2011.
Daily timeframe:
Partially altered from previous analysis –
Since June 11 smothered support at 0.6931, the base has proved reasonably worthy resistance, with Wednesday swinging lower from the base and Thursday offering a stationary presence.
In case of a break to the upside here, two trendline resistances inhabit territory close by (prior supports – 0.6744/0.6671). Support at 0.6755 also remains in position to the downside, with a break throwing light on the 200-day simple moving average at 0.6664, a dynamic value in the process of flattening, following months of drifting lower.
H4 timeframe:
Brought forward from previous analysis –
Wednesday’s tumble proposes the possibility of a double-top pattern off 0.6977, with a neckline formed at 0.6807 (blue arrows).
Breaking the neckline, however, entails overpowering demand at 0.6773/0.6814, a familiar area boasting a connection with a 38.2% Fib level at 0.6808.
H1 timeframe:
Heading into London trade Thursday, after revisiting 0.6850, the H1 candles began chalking up a possible rising wedge pattern between 0.6847/0.6888.
The 100-period simple moving average, currently at 0.6894, may be viewed as the next resistance on the H1 timeframe, circling close by the 0.69 level. Combined, these levels could be adequate enough to welcome a move lower, one that penetrates the lower limit of the current rising wedge.
Support targets outside of the aforesaid pattern can be seen at 0.6850, closely intersecting with two trendline supports (0.6976/0.6776).
Structures of Interest:
Combined, monthly supply at 0.7029/0.6664, daily resistance at 0.6931 and room for H4 to drop into demand at 0.6773/0.6814 could swing prices lower from 0.69 today, breaching the H1 rising wedge pattern.
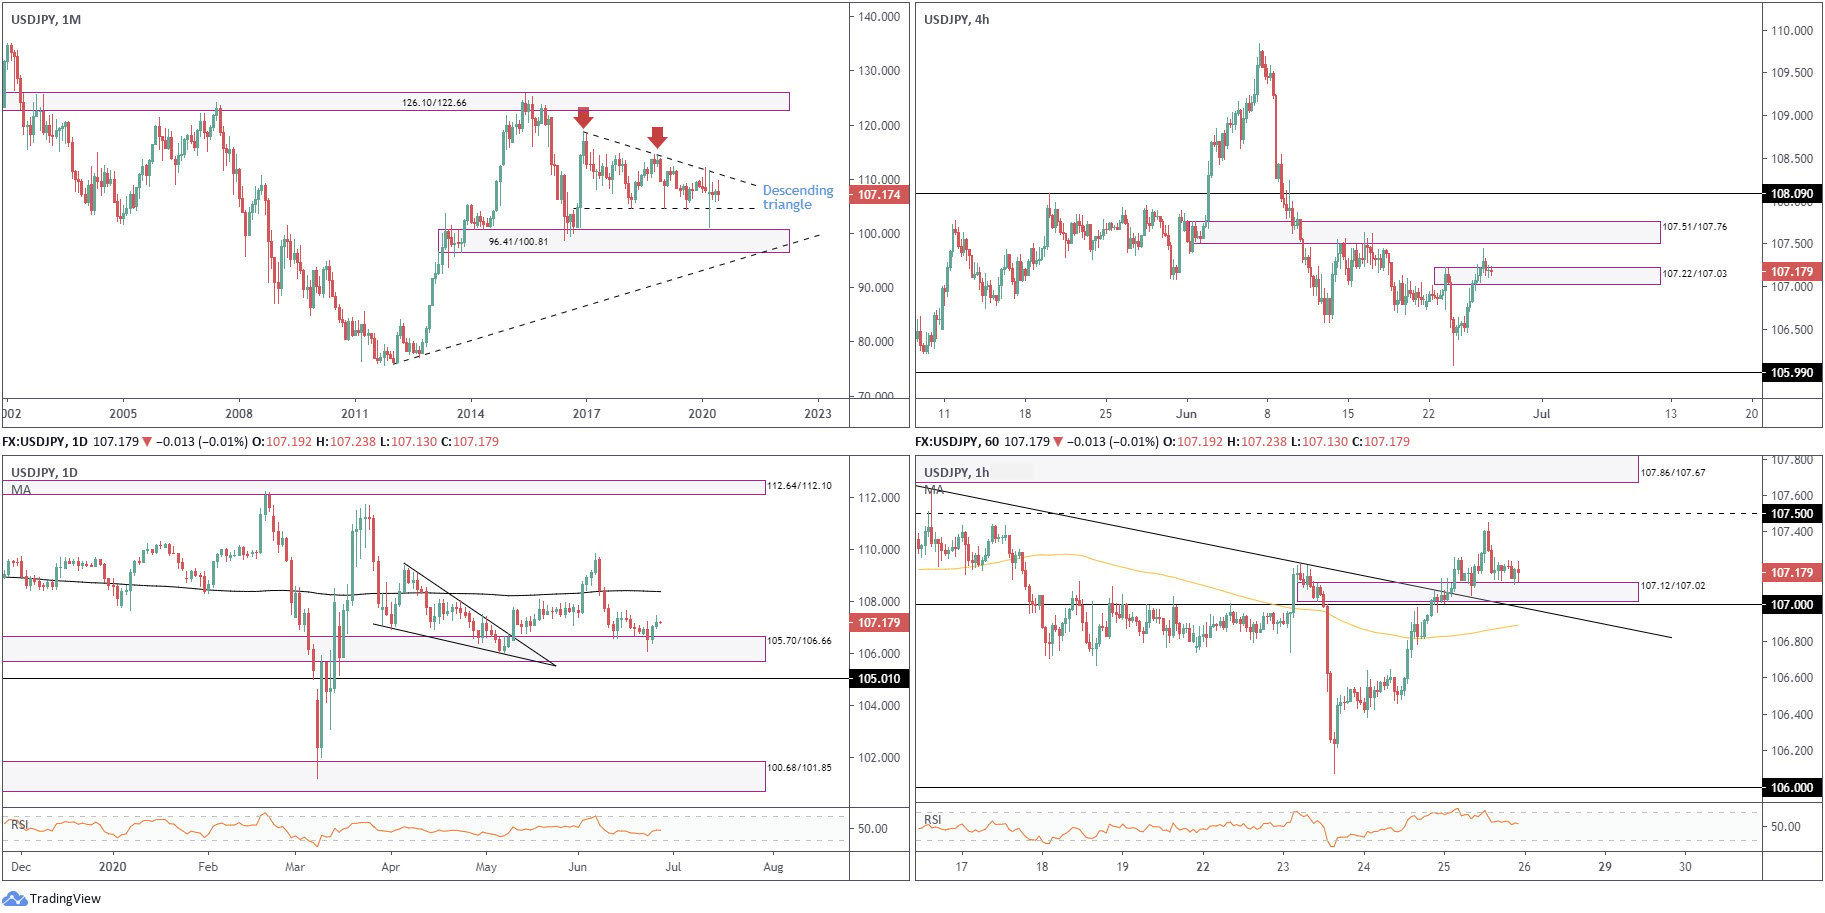
USD/JPY:
Monthly timeframe:
(Technical change on this timeframe is often limited though serves as guidance to potential longer-term moves)
Since kicking off 2017, USD/JPY has been busy carving out a descending triangle pattern between 118.66/104.62.
The month of March concluded by way of a long-legged doji candlestick pattern, ranging between 111.71/101.18, with extremes piercing the outer limits of the aforementioned descending triangle formation. April was pretty uneventful, ranging between 109.38/106.35. May also remained subdued, ranging between 108.08/105.98, with June currently off best levels, down 0.6%.
Areas outside of the noted triangle pattern can be seen at supply from 126.10/122.66 and demand coming in at 96.41/100.81.
Daily timeframe:
Partially altered from previous analysis –
USD/JPY came out swinging from demand at 105.70/106.66 Wednesday, printing a bullish inside candle pattern. Thursday extended gains though wrapped up quite a way off best levels.
The 200-day simple moving average at 108.37 has been flattening since mid-March – represents achievable resistance should a continuation to the upside come to fruition.
Dethroning current demand, on the other hand, possibly leads price action to nearby support at 105.01, with a break uncovering demand at 100.68/101.85.
H4 timeframe:
Supply at 107.22/107.03, a rally-base-drop formation, threw in the towel Thursday and potentially liberated buyers to supply coming in at 107.51/107.76.
Technically, the abandoned supply may offer demand today, enough to perhaps propel the pair towards 107.51/107.76, with a break possibly charting the way towards resistance at 108.09.
H1 timeframe:
A similar scenario to H4 is seen on the H1 timeframe, as early trade sailed through 107, the trendline resistance (107.62) and supply at 107.12/107.02, with the latter currently serving as demand.
Above current price, aside from 107.50, we see limited supply until coming into contact with 107.86/107.67, an area glued to the upper limit of H4 supply at 107.51/107.76.
Structures of Interest:
Daily, H4 and H1 timeframes suggest scope to climb. As a result of this, we likely have H1 traders seeking bullish strategies off demand at 107.12/107.02, with 107.50 denoting a possible target (also underlines the lower edge of H4 supply).
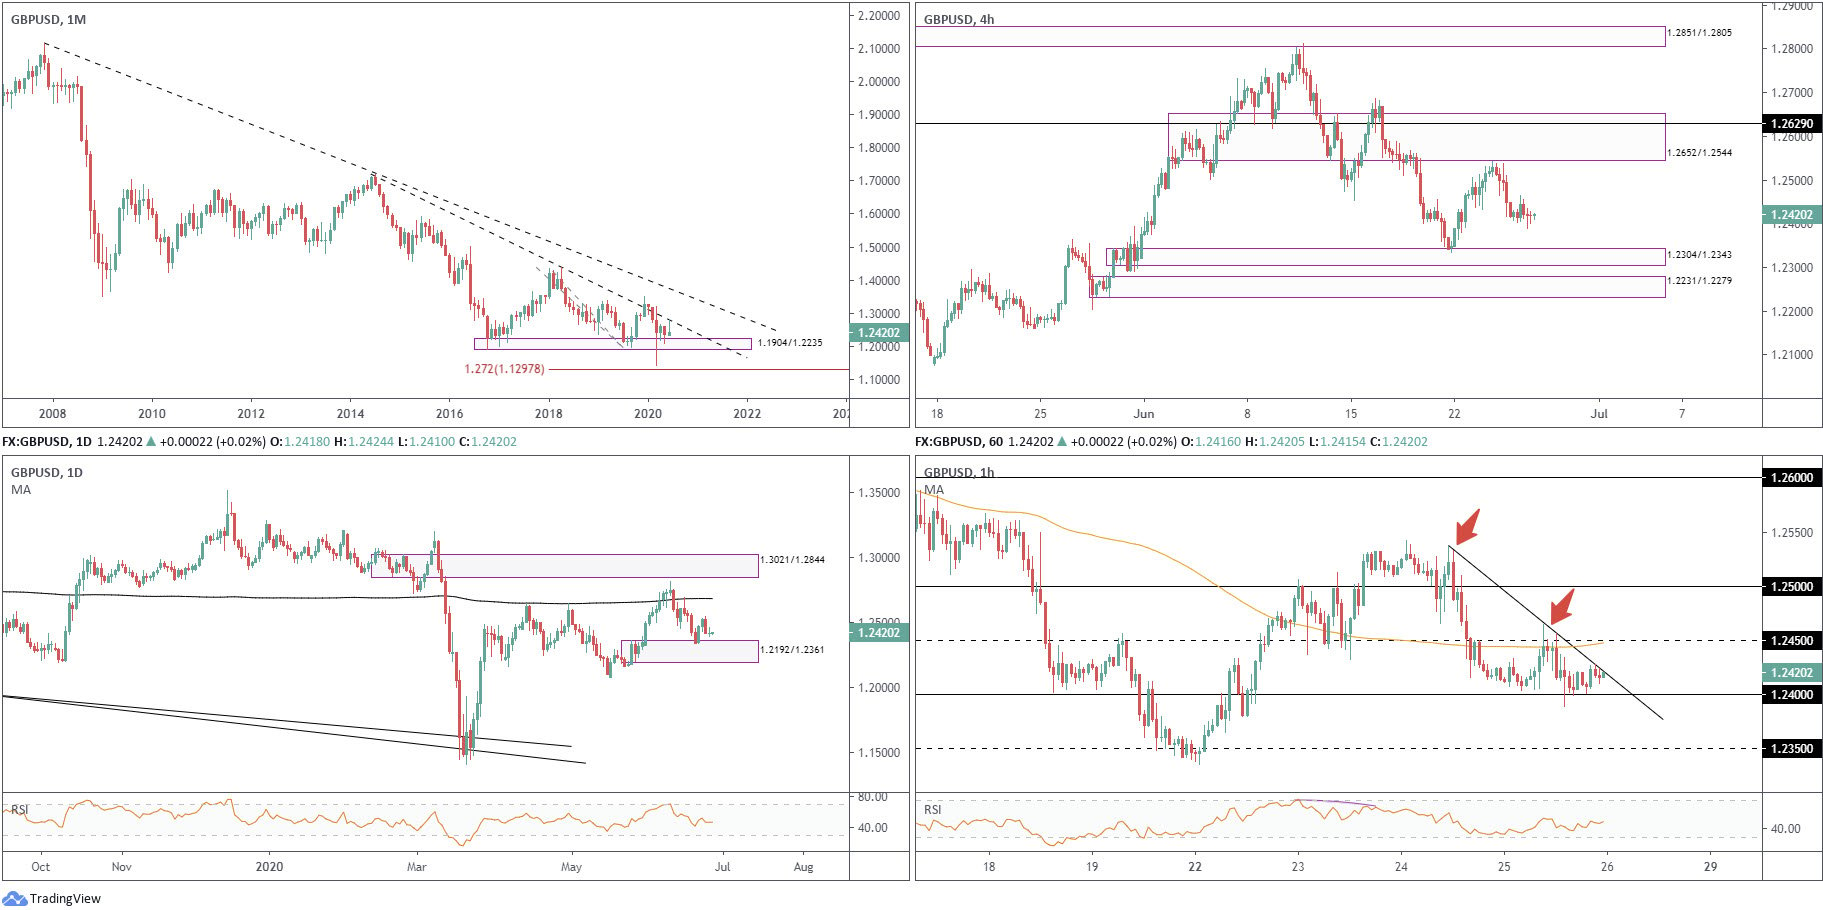
GBP/USD:
Monthly timeframe:
(Technical change on this timeframe is often limited though serves as guidance to potential longer-term moves)
Support at 1.1904/1.2235 and long-term trendline resistance (1.7191) remain clear structure on the monthly timeframe, with the latter so far prompting a notable upper shadow this month.
Concerning the primary trend, lower peaks and troughs have decorated the monthly chart since early 2008, placing 1.1904/1.2235 in a vulnerable position.
Daily timeframe:
Partially altered from previous analysis –
Formed by way of a bearish outside day, sellers stepped in on Wednesday and snapped a two-day winning streak derived out of demand at 1.2192/1.2361. This, as underscored in recent analysis, is an area not only fastened to the top edge of monthly support, it is also considered the decision point to break 1.2647 (April 14 high).
Thursday wrapped up indecisively, pushing across a Japanese doji candlestick formation. In its current position, ahead of demand at 1.2192/1.2361, research feels the doji could represent the beginnings of a reversal.
H4 timeframe:
Brought forward from previous analysis –
Supply at 1.2652/1.2544, an area boasting a moderately large range that captures resistance at 1.2629 within its upper boundary, came within a handful of pips of making a show Wednesday.
Current action, as you can see, is unlikely to attract support until meeting demand at 1.2304/1.2343.
H1 timeframe:
Local trendline resistance (1.2537) is, as we write, capping upside after candles modestly rebounded from 1.24 plotted nearby.
A GBP bid shines light on 1.2450, accompanied by the 100-period simple moving average, while territory below 1.24 has 1.2350 on the radar.
Structures of Interest:
Short sellers are unlikely to commit off H1 trendline resistance, having seen buyers make a stand off 1.24. A H1 close under the latter may be required before traders are comfortable taking aim at 1.2350.
An additional point to be aware of here, nevertheless, is we may stall ahead of 1.2350, in favour of the top edge of daily demand at 1.2361.
DISCLAIMER:
The information contained in this material is intended for general advice only. It does not take into account your investment objectives, financial situation or particular needs. FP Markets has made every effort to ensure the accuracy of the information as at the date of publication. FP Markets does not give any warranty or representation as to the material. Examples included in this material are for illustrative purposes only. To the extent permitted by law, FP Markets and its employees shall not be liable for any loss or damage arising in any way (including by way of negligence) from or in connection with any information provided in or omitted from this material. Features of the FP Markets products including applicable fees and charges are outlined in the Product Disclosure Statements available from FP Markets website, www.fpmarkets.com and should be considered before deciding to deal in those products. Derivatives can be risky; losses can exceed your initial payment. FP Markets recommends that you seek independent advice. First Prudential Markets Pty Ltd trading as FP Markets ABN 16 112 600 281, Australian Financial Services License Number 286354.


 Access +10,000 financial
instruments
Access +10,000 financial
instruments