
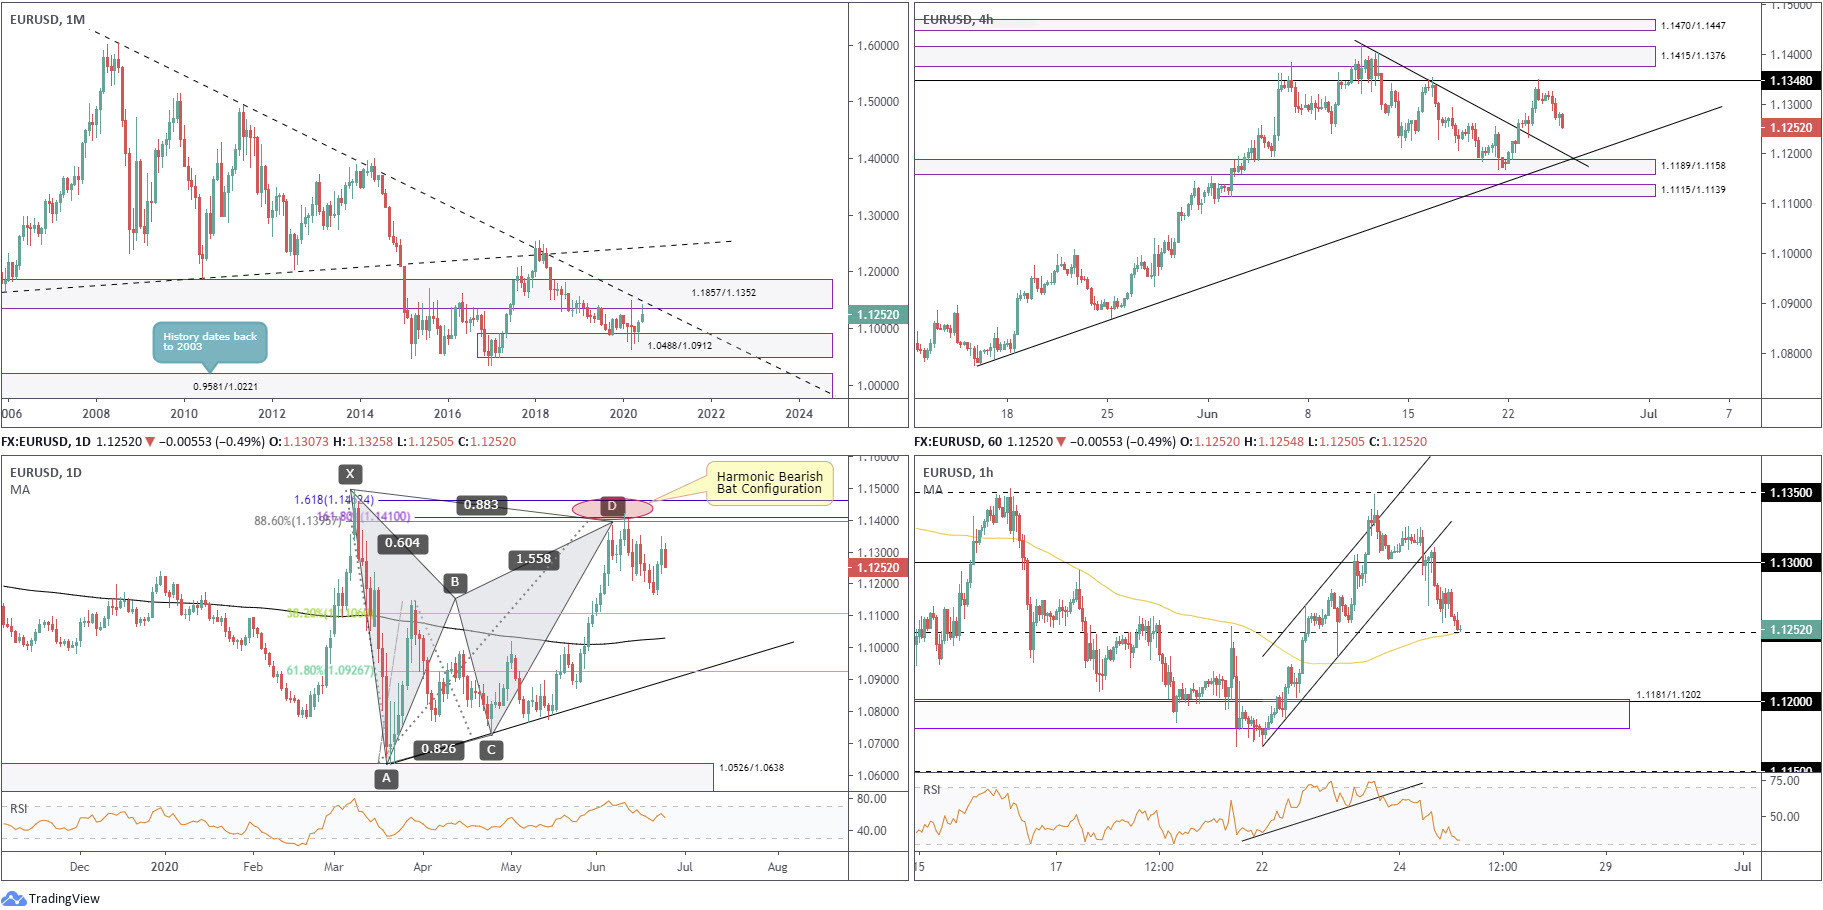
EUR/USD:
Monthly timeframe:
(Technical change on this timeframe is often limited though serves as guidance to potential longer-term moves)
May, as you can see, recovered off worst levels and wrapped up a few pips shy of monthly highs out of demand from 1.0488/1.0912.
June extended gains, though recently ran into opposition at the lower ledge of supply from 1.1857/1.1352 (unites with long-term trendline resistance [1.6038]) – the month currently trades off best levels.
With reference to the primary trend, price has exhibited clear lower peaks and troughs since 2008.
Daily timeframe:
Brought forward from previous analysis –
EUR/USD recently addressed a potential reversal zone (PRZ), derived from a harmonic bearish bat pattern, comprised of an 88.6% Fib level at 1.1395, a 161.8% BC projection at 1.1410 and a 161.8% Fib ext. level at 1.1462 (red oval).
It’s typical to see traders sell PRZs and place protective stop-loss orders above the X point, in this case at 1.1495. Common take-profit targets fall in at the 38.2% and 61.8% Fib levels (legs A/D) at 1.1106 and 1.0926, respectively.
H4 timeframe:
Tuesday’s rejection off resistance at 1.1348 stirred a decisive sell-off Wednesday, snapping a two-day winning streak.
According to technical structure, the pair is tipped for more near-term underperformance today until crossing paths with trendline support (prior resistance – 1.1422). Additional areas to be mindful of are demand at 1.1189/1.1158 (prior supply), trendline support (1.0780) and another demand at 1.1115/1.1139.
H1 timeframe:
Following London’s open Wednesday, EUR/USD exhibited a one-sided market to the downside amid a stronger-than-expected USD recovery.
Channel support (1.1168), together with the 1.13 level, put up little fight and led candles towards the 1.1250 hurdle, which, as you can see, currently joins with the 100-period simple moving average. South of this point re-opens the risk of a return to 1.12 that intersects with demand at 1.1181/1.1202. Also note this demand area is glued to the top edge of H4 demand at 1.1189/1.1158 and intersects closely with H4 trendline supports (1.1422/1.0780).
Indicator-based traders will also want to note the RSI is seen fast approaching oversold territory.
Structures of Interest:
Higher timeframes point to a break of 1.1250. As such, a H1 close formed under the aforesaid level today will likely see breakout sellers push for the 1.12 structure.
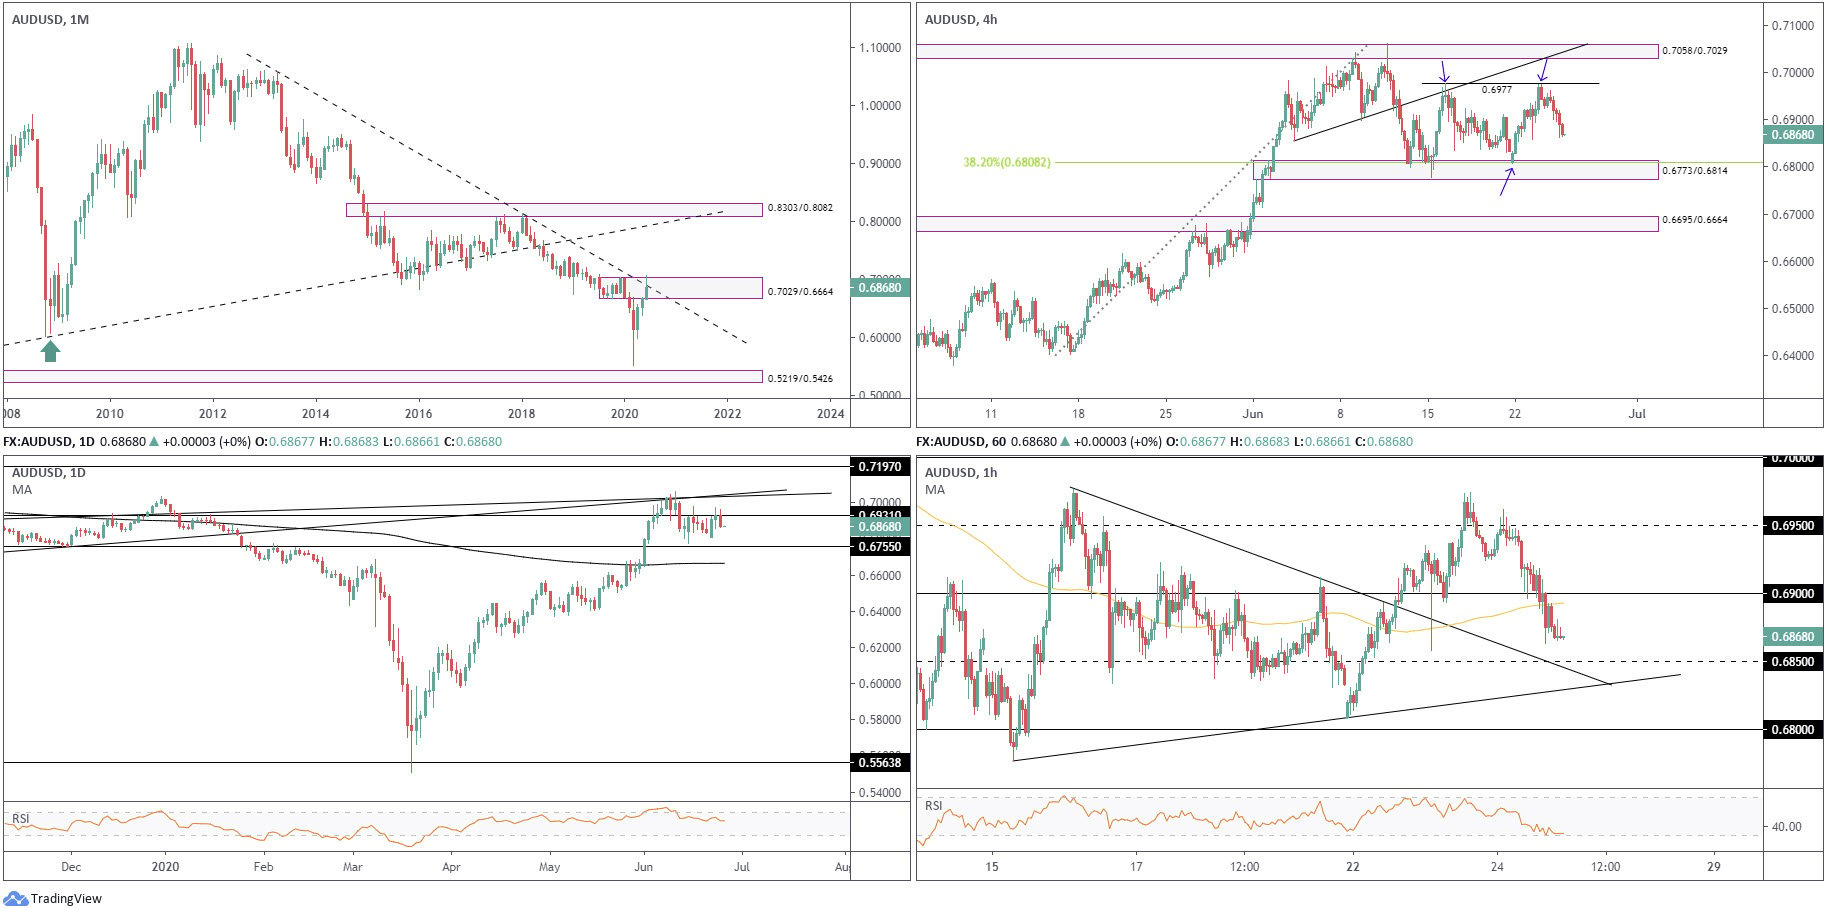
AUD/USD:
Monthly timeframe:
(Technical change on this timeframe is often limited though serves as guidance to potential longer-term moves)
May’s extension as well as June’s follow-through has supply at 0.7029/0.6664 echoing a somewhat vulnerable tone at the moment, despite the base benefitting from additional resistance by way of a long-term trendline formation (1.0582).
Regarding the market’s primary trend, a series of lower lows and lower highs have been present since mid-2011.
Daily timeframe:
Partially altered from previous analysis –
Since June 11 smothered support at 0.6931, the base has proved reasonably worthy resistance, with Wednesday swinging lower from the base in strong form and snapping a modest two-day winning streak. In case of a break to the upside, two trendline resistances inhabit territory close by (prior supports – 0.6744/0.6671).
Support at 0.6755 remains in position to the downside, with a break throwing light on the 200-day simple moving average at 0.6664, a dynamic value in the process of flattening, following months of drifting lower.
H4 timeframe:
Wednesday’s tumble proposes the possibility of a double-top pattern off 0.6977, with a neckline formed at 0.6807 (blue arrows).
Breaking the neckline, however, entails overpowering demand at 0.6773/0.6814, a familiar area boasting a connection with a 38.2% Fib level at 0.6808.
H1 timeframe:
Despite an effort to recover off 0.69, the psychological level surrendered heading into US trade Wednesday. The pair made quick work of the 100-period simple moving average and settled just ahead of 0.6850, closely intersecting with two trendline supports (0.6976/0.6776).
With respect to the RSI, we can see the value hovering within close proximity of oversold levels.
Structures of Interest:
The H4 double-top scenario is appealing at 0.6977, though in order to break the neckline at 0.6807 entails not only handling H4 demand at 0.6773/0.6814, but also contending with daily support at 0.6755.
Near-term intraday action may also welcome price action at 0.6850 today, coupled with two nearby H1 trendline supports. Treat this area with caution, as entering long from here throws you against monthly and daily sellers.
0.68 also offers a possible reversal zone on the H1, a level bonding with H4 demand at 0.6773/0.6814.
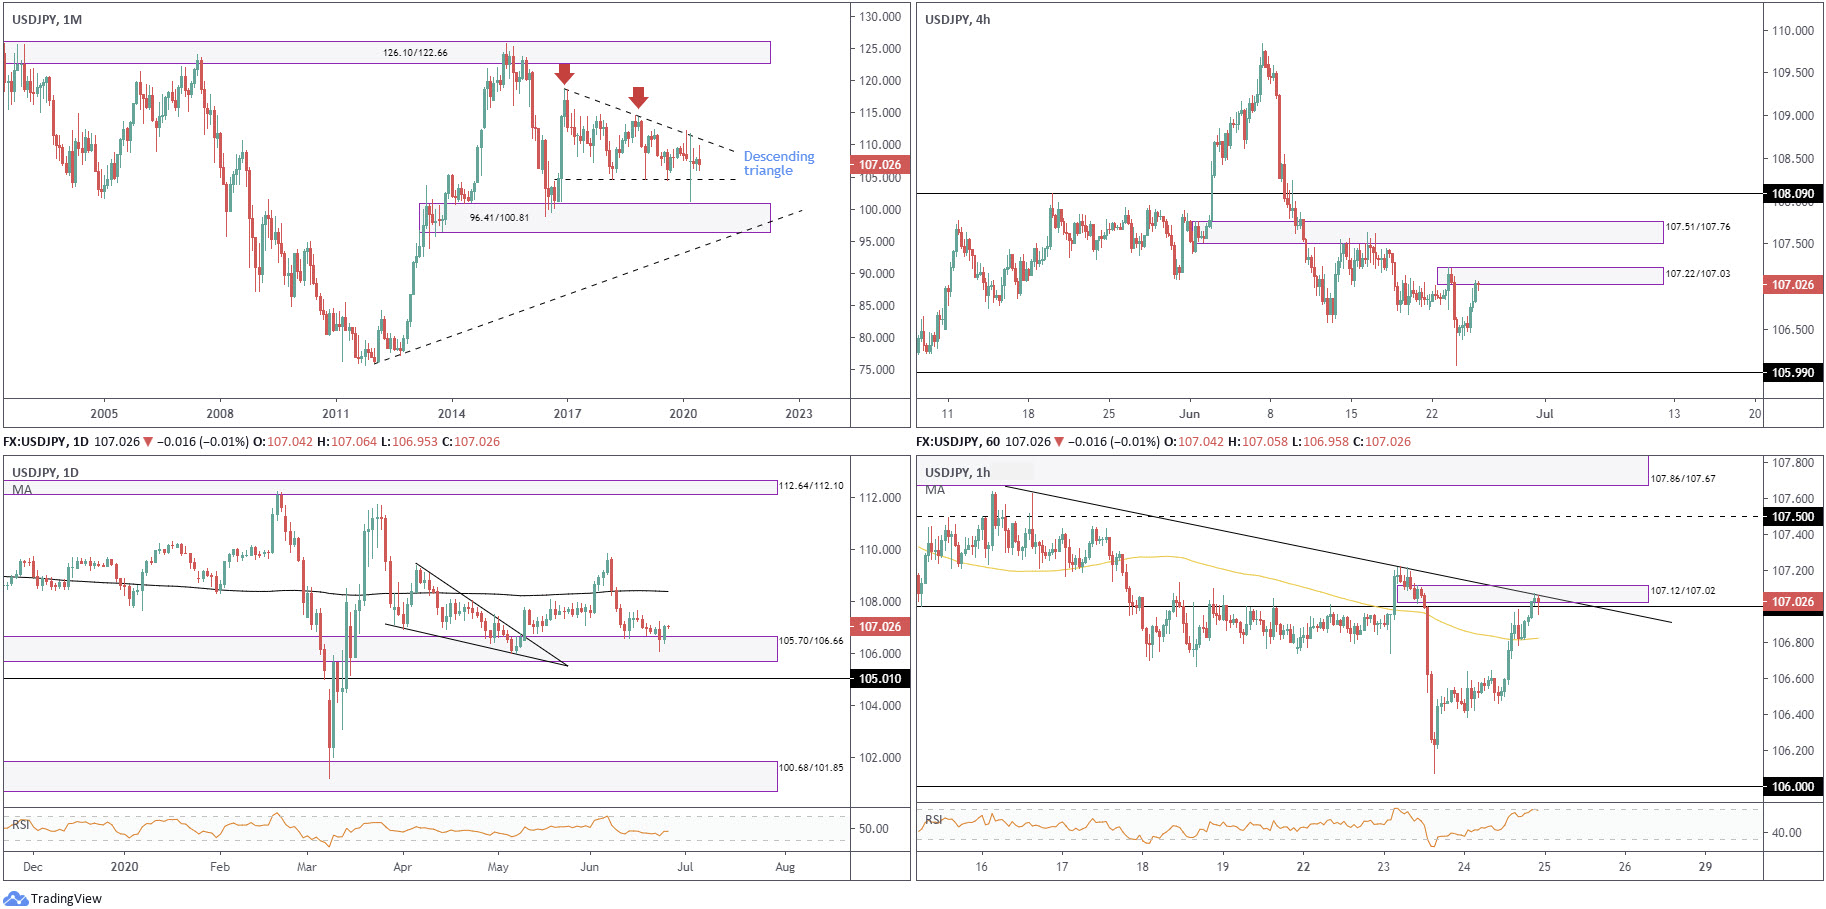
USD/JPY:
Monthly timeframe:
(Technical change on this timeframe is often limited though serves as guidance to potential longer-term moves)
Since kicking off 2017, USD/JPY has been busy carving out a descending triangle pattern between 118.66/104.62.
The month of March concluded by way of a long-legged doji candlestick pattern, ranging between 111.71/101.18, with extremes piercing the outer limits of the aforementioned descending triangle formation. April was pretty uneventful, ranging between 109.38/106.35. May also remained subdued, ranging between 108.08/105.98, with June currently off best levels, down 0.6%.
Areas outside of the noted triangle pattern can be seen at supply from 126.10/122.66 and demand coming in at 96.41/100.81.
Daily timeframe:
USD/JPY came out swinging from demand at 105.70/106.66 Wednesday, wrapping up the session mildly off best levels and printing a bullish inside candle pattern. The 200-day simple moving average at 108.38 has been flattening since mid-March – the dynamic value represents achievable resistance should a continuation to the upside come to fruition.
Dethroning current demand, on the other hand, possibly leads price action to nearby support at 105.01, with a break uncovering demand at 100.68/101.85.
H4 timeframe:
Supply at 107.22/107.03, a rally-base-drop formation, recently made an entrance on the H4 timeframe. Stripping this area today could land the candles at the door of supply from 107.51/107.76 (prior demand), while a move lower could take aim at the 105.99 May 6 low.
H1 timeframe:
Joining the underside of H4 supply at 107.22/107.03 is another layer of supply on the H1 timeframe at 107.12/107.02. This base deserves notice owing to it also bringing forward the round number 107, trendline resistance (107.62) and an RSI overbought signal.
Above the current area, aside from 107.50, we see limited supply until coming into contact with 107.86/107.67.
Structures of Interest:
Bearish signals out of H4 supply, knowing the area also benefits from H1 confluence, could be in the offing today. The caveat, however, despite the immediate trend facing downwards, is daily price appears to be making a push out of demand at 105.70/106.66.
H1 sellers may wait and see if the pair can close beneath the 100-period simple moving average at 106.82 as a means of confirmation.
GBP/USD:
Monthly timeframe:
(Technical change on this timeframe is often limited though serves as guidance to potential longer-term moves)
Support at 1.1904/1.2235 and long-term trendline resistance (1.7191) remain clear structure, with the latter so far prompting an upper shadow this month.
Concerning the primary trend, lower peaks and troughs have decorated the monthly chart since early 2008, placing 1.1904/1.2235 in a vulnerable position.
Daily timeframe:
Formed by way of a bearish outside day, sellers stepped in on Wednesday and snapped a two-day winning streak derived from demand at 1.2192/1.2361. This, as underscored in recent analysis, is an area not only fastened to the top edge of monthly support, it is also considered the decision point to break 1.2647 (April 14 high).
Dollar resurgence fuelled recent moves, which could have Thursday reconnect with the aforesaid demand. At the same time, a turn to the upside shines light on the 200-day simple moving average at 1.2683 as feasible resistance.
H4 timeframe:
Supply at 1.2652/1.2544, an area boasting a moderately large range that captures resistance at 1.2629 within its upper boundary, came within a handful of pips of making a show Wednesday.
Current action, as you can see, is unlikely to attract support until meeting demand at 1.2304/1.2343.
H1 timeframe:
Unable to find acceptance above 1.25, despite numerous upside attempts and a spirited rebound off trendline support (prior resistance – 1.2813), price dived into US trade.
Unseating a number of key technical supports, the pound left Wednesday stationed a few pips ahead of the 1.24 level. Slipping through orders at 1.24 today throws light on 1.2350 as the next available support.
In terms of the RSI, we are establishing a mild bottom north of oversold terrain.
Structures of Interest:
1.24 on the H1 timeframe offers fragile support, absent of confluence across the board.
Breaching 1.24 will likely generate a wave of intraday sell orders. Strict trade management is a must, as between 1.2361 (top edge of daily demand) and 1.2343 (top edge of H4 demand), we’re likely to witness a bullish comeback.

DISCLAIMER:
The information contained in this material is intended for general advice only. It does not take into account your investment objectives, financial situation or particular needs. FP Markets has made every effort to ensure the accuracy of the information as at the date of publication. FP Markets does not give any warranty or representation as to the material. Examples included in this material are for illustrative purposes only. To the extent permitted by law, FP Markets and its employees shall not be liable for any loss or damage arising in any way (including by way of negligence) from or in connection with any information provided in or omitted from this material. Features of the FP Markets products including applicable fees and charges are outlined in the Product Disclosure Statements available from FP Markets website, www.fpmarkets.com and should be considered before deciding to deal in those products. Derivatives can be risky; losses can exceed your initial payment. FP Markets recommends that you seek independent advice. First Prudential Markets Pty Ltd trading as FP Markets ABN 16 112 600 281, Australian Financial Services License Number 286354.


 Access +10,000 financial
instruments
Access +10,000 financial
instruments